
miR-155 regulates high glucose-induced cardiac fibrosis via the TGF-β signaling pathway
Dong
Zhang
,
Yongchun
Cui
,
Bin
Li
,
Xiaokang
Luo
,
Bo
Li
and
Yue
Tang
 *
*
Chinese Academy of Medical Sciences, Peking Union Medical College, National Centre for Cardiovascular Disease, Fuwai Hospital, State Key Laboratory of Cardiovascular Disease, Beijing Key Laboratory of Pre-Clinical Research and Evaluation for Cardiovascular Implant Materials, Animal Experimental Centre, Beijing 100037, China. E-mail: tangyue@fuwaihospital.org
First published on 30th November 2016
Abstract
Cardiac fibrosis, as a pathological process, plays an important role in various cardiac diseases. microRNA-155 (miR-155) is one of the most important miRNAs, and previous studies have shown that it is a regulatory factor in various fibrotic diseases. However, the mechanism by which miR-155 affects myocardial fibrosis remains unclear. In this study, we aim to establish the biological function of miR-155 in myocardial fibrosis induced by diabetes in mice. We used normal C57BL/6 wild type (WT) and miR-155 knockout (KO) mice to establish the diabetic model by intraperitoneal injection of streptozotocin, and we utilized echocardiography to evaluate the cardiac function at 30 and 60 days post-modeling. Hematoxylin–eosin (HE) and sirius-red (SR) staining were used to evaluate the degree of myocardial lesions. Furthermore, we extracted cardiac fibroblasts (CFs) from the WT mice and transfected them with miR-155 inhibitors, mimics and negative control siRNAs to analyze the specific mechanism involved in the development of myocardial fibrosis. The results showed that miR-155 deficiency could prevent cardiac fibrosis induced by diabetes in mice and also that attenuated collagen synthesis is induced by high glucose (HG) in CFs. We found that miR-155 regulated cardiac fibrosis via the TGF-β1–Smad 2 signaling pathway. These findings suggest that miR-155 may be a therapeutic target for preventing cardiac fibrosis induced by diabetes.
1. Introduction
Diabetes, one of the most common human diseases, plays an important role in various disorders, including fundus lesions,1 neuropathy,2 and fibrotic diseases.3,4 Cardiac fibrosis, one of the main fibrotic diseases, often leads to cardiac dysfunction that eventually evolves to cardiac failure.5,6 However, there are few effective treatments to prevent cardiac fibrosis. Previous studies show that cardiac fibroblasts (CFs) are the most important elements in the process of cardiac fibrosis and that collagen synthesis and deposition play vital roles in this disease.7 It is reported that high glucose (HG) induces the production and multiplication of collagens, and eventually leads to cardiac dysfunction.8Transforming growth factor-β1 (TGF-β1) is a key cytokine that regulates the process of fibrosis in some vital organs. It also plays an important role in cardiac fibrosis through its receptors that include Smad2, Smad3 and Smad7.9 It has been reported that suppression of TGF-β1 can reduce the degree of fibrotic diseases in mice,10 indicating that the TGF-β1–Smad cascade plays a vital role in fibrosis.11
microRNAs (miRNAs) are noncoding, small RNAs that regulate gene expression at the post-transcriptional level.12 microRNA-155 (miR-155) is one of the most important miRNAs and plays a role in various biological processes, including immunity,13,14 inflammation,15,16 autophagy,17 cancer18,19 and fibrosis.20,21 Previous studies have shown that miR-155 is a regulatory factor in various fibrotic diseases.22,23 In the cardiovascular system, miR-155 was used to regulate the development of atherosclerotic plaques, inflammation, and macrophages.24,25 However, the mechanism by which myocardial fibrosis is affected by miR-155 remains unclear.
In our previous experiments, we established the miR-155 knockout (KO) mouse model using the CRISPR/Cas9 system and completed the establishment of a homozygous mouse line. We aim to utilize this mouse model to identify the biological function of miR-155 in myocardial fibrosis caused by diabetes and to identify therapeutic targets to prevent cardiac fibrosis.
2. Materials and methods
2.1 Animals and groups
Our experiments were conducted on C57BL/6 wild type (WT) and miR-155 knockout (KO) mice. These mice were obtained from the animal center in the Fuwai Hospital of Peking Union Medical College (Beijing, China). The animals were maintained under routine conditions, including a 12 h light/dark cycle and adequate water and food. All the experimental protocols were approved by the Ethical Committee of the Fuwai Hospital of Peking Union Medical College.The mice were randomly assigned to four groups that included the wild type (WT) group, the miR-155 knockout (KO) group, the high glucose + WT (HWT) group, and the high glucose + KO (HKO) group. The WT and KO were the control groups, and the HWT and HKO were the model groups. Each group contained 10 mice (each weighing from 20 to 25 g, aged 8 weeks).
Diabetic mice in the model groups were induced by a single dose of streptozotocin (150 mg kg−1, Sigma, USA) via intraperitoneal injection. At the third and seventh day after streptozotocin injection, fresh blood obtained from the tail-vein was tested using a standard glucometer (Roche, Switzerland), and the mice with fasting blood glucose levels higher than 11.1 mM were considered to be diabetic.
2.2 Echocardiography
At 30 and 60 days post-modeling, we used echocardiography to evaluate the cardiac function of all the groups. To standardize the ultrasonic inspection and measurement, only the mice with heart rates within the range of 400–600 bpm during anesthesia were included in the analysis.26 Echocardiography used the VisualSonics Vevo 2100 ultrasound system (VisualSonics, Toronto, Canada). The mice were first anesthetized with an intraperitoneal injection of 20 mg kg−1 chloral hydrate (2.5% in normal saline) and sustained with isoflurane through a nose cone during operations. The mice were placed in the supine position on a heated platform with ECG leads. Depilatory paste was used to remove fur in the region of detection, and medical ultrasound gel was used to ensure optimal imaging. All the examinations were performed by an experienced operator, and all the measurements were repeated three times at the same site.272.3 Histological analyses
The excised hearts were cut into approximately 2 mm transverse slices and fixed in 4% paraformaldehyde. After being embedded in paraffin, the transverse sections were stained with hematoxylin–eosin (HE) and sirius-red (SR). The SR staining was performed using a kit from LEAGENE (Beijing, China) according to the manufacturer's protocol. Collagen I was stained red and orange, collagen III was stained green, and cell nuclei were stained blue.The quantification of the degree of myocardial fibrosis on sections stained with SR was measured using Image-Pro Plus 6.0 (GelDoc2000, Bio-Rad). In each section, digital photographs were taken in five randomly selected fields. And the area of myocardial collagens was calculated by the ratio of the stained area to the total area. The calculation of the collagen volume fraction is as follows: collagen volume fraction (CVF, %) = (total area of collagens/total area of image) × 100%.28
2.4 Cell culture and transfection
CFs were extracted from normal C57BL/6J WT mice (aged 3–4 weeks) and were cultured in low glucose (LG) (5 mM) and high glucose (HG) (40 mM) DMEM (Gibco, USA) containing 10% fetal bovine serum (FBS) (Gibco, USA), penicillin and streptomycin in an incubator with a 5% CO2 atmosphere at 37 °C. To control osmolality, a separate set of cells were exposed to LG (OC) (5 mM glucose + 35 mM mannitol, osmotic control) medium. All the CFs used in the experiments were from the second to the fourth generations after isolation.The CFs were seeded in 6-well culture plates at a density of 2 × 10⁵ cells per well with DMEM containing 10% FBS and 5 mM glucose. The cells were incubated at 37 °C and 5% CO2 for 18–24 h until 30–50% confluence was reached. Before transfection, the cells were transferred to serum-free medium overnight. Then, 50 nM miR-155 hairpin inhibitors, 20 nM miR-155 hairpin mimics and the negative control siRNAs (GeneCopoeia™, Guangzhou, China) were transfected into the CFs using Lipofectamine RNAiMAX Transfection Reagent (Thermo, USA), followed by incubation for 24 h in serum-free medium. Cells were then exposed to HG or LG medium for 12 h, 24 h and 48 h. In the end, cells were collected for western blotting analyses or harvested for real-time PCR analyses, and the cell supernatants were used for enzyme linked immunosorbent assays (ELISAs).
2.5 RNA extraction and real-time PCR
Total RNA was extracted using miRcute–miRNA Isolation Kits (Tiangen, Beijing, China) according to the protocols provided by the manufacturer. The signal was detected using the Applied Biosystems 7500 Real-time PCR System with the SYBR Green Real-time PCR Master Mix (ABI, USA). The routine amplification condition included pre-denaturation at 95 °C for 10 min, denaturation at 95 °C for 15 s and annealing at 60 °C for 60 s for 40 cycles. The parameters of gene expression were analyzed using a comparative CT method with U6 as the normalization control.29The miR-155 primer sequences are:
Forward: 5′-UUAAUGCUAAUUGUGAUAGGGGU-3′;
Reverse: 5′-CUCCUACCUGUUAGCAUUAAC-3′.
2.6 Western blotting analysis
Proteins were extracted from the CFs with RIPA buffer and collected via centrifugation at 12![[thin space (1/6-em)]](https://www.rsc.org/images/entities/char_2009.gif) 000 g. Then, the proteins were separated using SDS/PAGE and transferred to PVDF membranes. The membranes were blocked and incubated with primary antibodies at 4 °C overnight. Antibodies against GAPDH (1:1000, Golden Bridge, China), Collagen I (1:1000, Abcam, UK), Smad 2 (1:1000, Abcam, UK), Smad 3 (1:1000, Abcam, UK) and TGF-β1 (1:1000, Abcam, UK) were used. After being incubated with secondary antibodies, the membranes were scanned directly using an ultraviolet imaging system.
000 g. Then, the proteins were separated using SDS/PAGE and transferred to PVDF membranes. The membranes were blocked and incubated with primary antibodies at 4 °C overnight. Antibodies against GAPDH (1:1000, Golden Bridge, China), Collagen I (1:1000, Abcam, UK), Smad 2 (1:1000, Abcam, UK), Smad 3 (1:1000, Abcam, UK) and TGF-β1 (1:1000, Abcam, UK) were used. After being incubated with secondary antibodies, the membranes were scanned directly using an ultraviolet imaging system.
2.7 Enzyme-linked immunosorbent assay (ELISA)
The concentration of collagen I in the cell supernatants was tested using ELISA kits (R&D Systems, MN, USA) according to the manufacturer's instructions, and the relevant parameters were determined using the standard curve for the OD value.2.8 Statistical analysis
The data are shown as the mean ± standard deviation. All parameters were compared between the control groups and the model groups using one-way analysis of variance (ANOVA). A P-value less than 0.05 was considered statistically significant. The GraphPad Prism 5 software (San Diego, CA, USA) was used for the statistical analysis.3. Results
3.1 MiR-155 deficiency attenuated diabetes-induced myocardial damage in mice
To confirm the degree of myocardial damage induced by diabetes, we used echocardiography to evaluate the cardiac function of all mice at 30 and 60 days post-modeling. For more effective inspection and measurement, the sweep speed, depth, and focus were adjusted to acquire the best images. Using echocardiography, the left ventricular end-diastolic diameter (LVEDD), the left ventricular end-systolic diameter (LVESD), the left ventricular end-diastolic volume (LVEDV), the left ventricular end-systolic volume (LVESV), the mitral valve peak E (MV E), and the mitral valve wave A (MV A) were measured and recorded. The left ventricular stroke volume (LVSV), the left ventricular ejection fraction (LVEF), the left ventricular fractional shortening (LVFS), the cardiac output (CO), and the mitral E/A ratio (MV E/A) were calculated from the parameters. Specific parameters are illustrated in Table 1.| Item (unit) | 30 days | 60 days | ||||||
|---|---|---|---|---|---|---|---|---|
| WT (n = 10) | KO (n = 10) | HWT (n = 10) | HKO (n = 10) | WT (n = 10) | KO (n = 10) | HWT (n = 7) | HKO (n = 9) | |
| Note: the values represent the mean ± standard deviation; one-way analysis of variance and pairwise comparison; and *P < 0.05 compared with the control groups. | ||||||||
| Heart rate (bpm) | 471.30 ± 7.13 | 452.00 ± 6.98 | 480.80 ± 5.86 | 471.40 ± 7.80 | 465.30 ± 7.56 | 484.4 ± 10.18 | 476.29 ± 4.87 | 475.44 ± 5.06 |
| LVEDD (mm) | 3.48 ± 0.15 | 3.42 ± 0.17 | 3.53 ± 0.22 | 3.42 ± 0.08 | 3.57 ± 0.04 | 3.49 ± 0.07 | 3.83 ± 0.03 | 3.70 ± 0.02 |
| LVESD (mm)* | 1.91 ± 0.07 | 1.96 ± 0.08 | 2.38 ± 0.05 | 2.08 ± 0.05 | 2.11 ± 0.06 | 2.06 ± 0.06 | 2.85 ± 0.02 | 2.81 ± 0.02 |
| LVEDV (μl) | 54.72 ± 1.92 | 55.55 ± 2.20 | 57.68 ± 0.84 | 57.03 ± 1.13 | 56.86 ± 1.34 | 55.57 ± 2.09 | 64.49 ± 0.48 | 61.96 ± 0.41 |
| LVESV (μl)* | 18.05 ± 1.08 | 18.01 ± 0.71 | 19.49 ± 0.62 | 18.89 ± 0.57 | 19.54 ± 0.51 | 19.56 ± 0.45 | 32.44 ± 0.62 | 32.29 ± 0.86 |
| LVSV (μl) | 35.45 ± 1.30 | 35.79 ± 1.54 | 37.19 ± 1.35 | 36.96 ± 1.60 | 37.04 ± 1.24 | 38.01 ± 0.96 | 30.37 ± 0.49 | 31.40 ± 0.39 |
| LVEF (%)* | 65.36 ± 2.15 | 63.73 ± 1.50 | 64.18 ± 1.25 | 68.32 ± 2.30 | 67.55 ± 1.27 | 66.35 ± 1.49 | 48.23 ± 1.12 | 54.64 ± 1.38 |
| LVFS (%) | 39.10 ± 1.64 | 40.13 ± 2.10 | 38.39 ± 1.17 | 39.35 ± 1.55 | 40.58 ± 1.66 | 39.16 ± 1.53 | 26.12 ± 0.38 | 27.16 ± 0.62 |
| CO (mL min−1) | 20.94 ± 0.80 | 21.95 ± 1.07 | 20.07 ± 0.37 | 21.66 ± 0.62 | 21.98 ± 0.70 | 21.50 ± 0.60 | 14.98 ± 1.23 | 16.46 ± 1.21 |
| MV E (mm s−1)* | 609.97 ± 15.11 | 621.77 ± 12.55 | 534.59 ± 14.45 | 582.88 ± 7.45 | 558.63 ± 13.43 | 552.94 ± 11.88 | 370.21 ± 20.37 | 419.34 ± 16.59 |
| MV A (mm s−1) | 308.41 ± 14.10 | 308.31 ± 10.32 | 267.66 ± 9.39 | 295.99 ± 7.64 | 272.34 ± 6.40 | 279.70 ± 7.93 | 245.34 ± 2.78 | 255.84 ± 8.77 |
| MV E/A* | 2.00 ± 0.09 | 2.04 ± 0.07 | 2.02 ± 0.09 | 1.98 ± 0.06 | 2.07 ± 0.08 | 1.99 ± 0.06 | 1.51 ± 0.09 | 1.64 ± 0.06 |
At 30 days post-modeling, all the mice were alive and examined using echocardiography (Fig. 1A). The HWT group had an obviously higher LVESD and MV E than the WT group, and a significantly higher LVESD than the HKO group (P < 0.05) (Fig. 1B). Other parameters showed no significant differences among the groups. The results showed that the cardiac function of all the mice was generally normal, although the HWT group showed a slight change in the cardiac function compared to the control groups, whereas the HKO group did not.
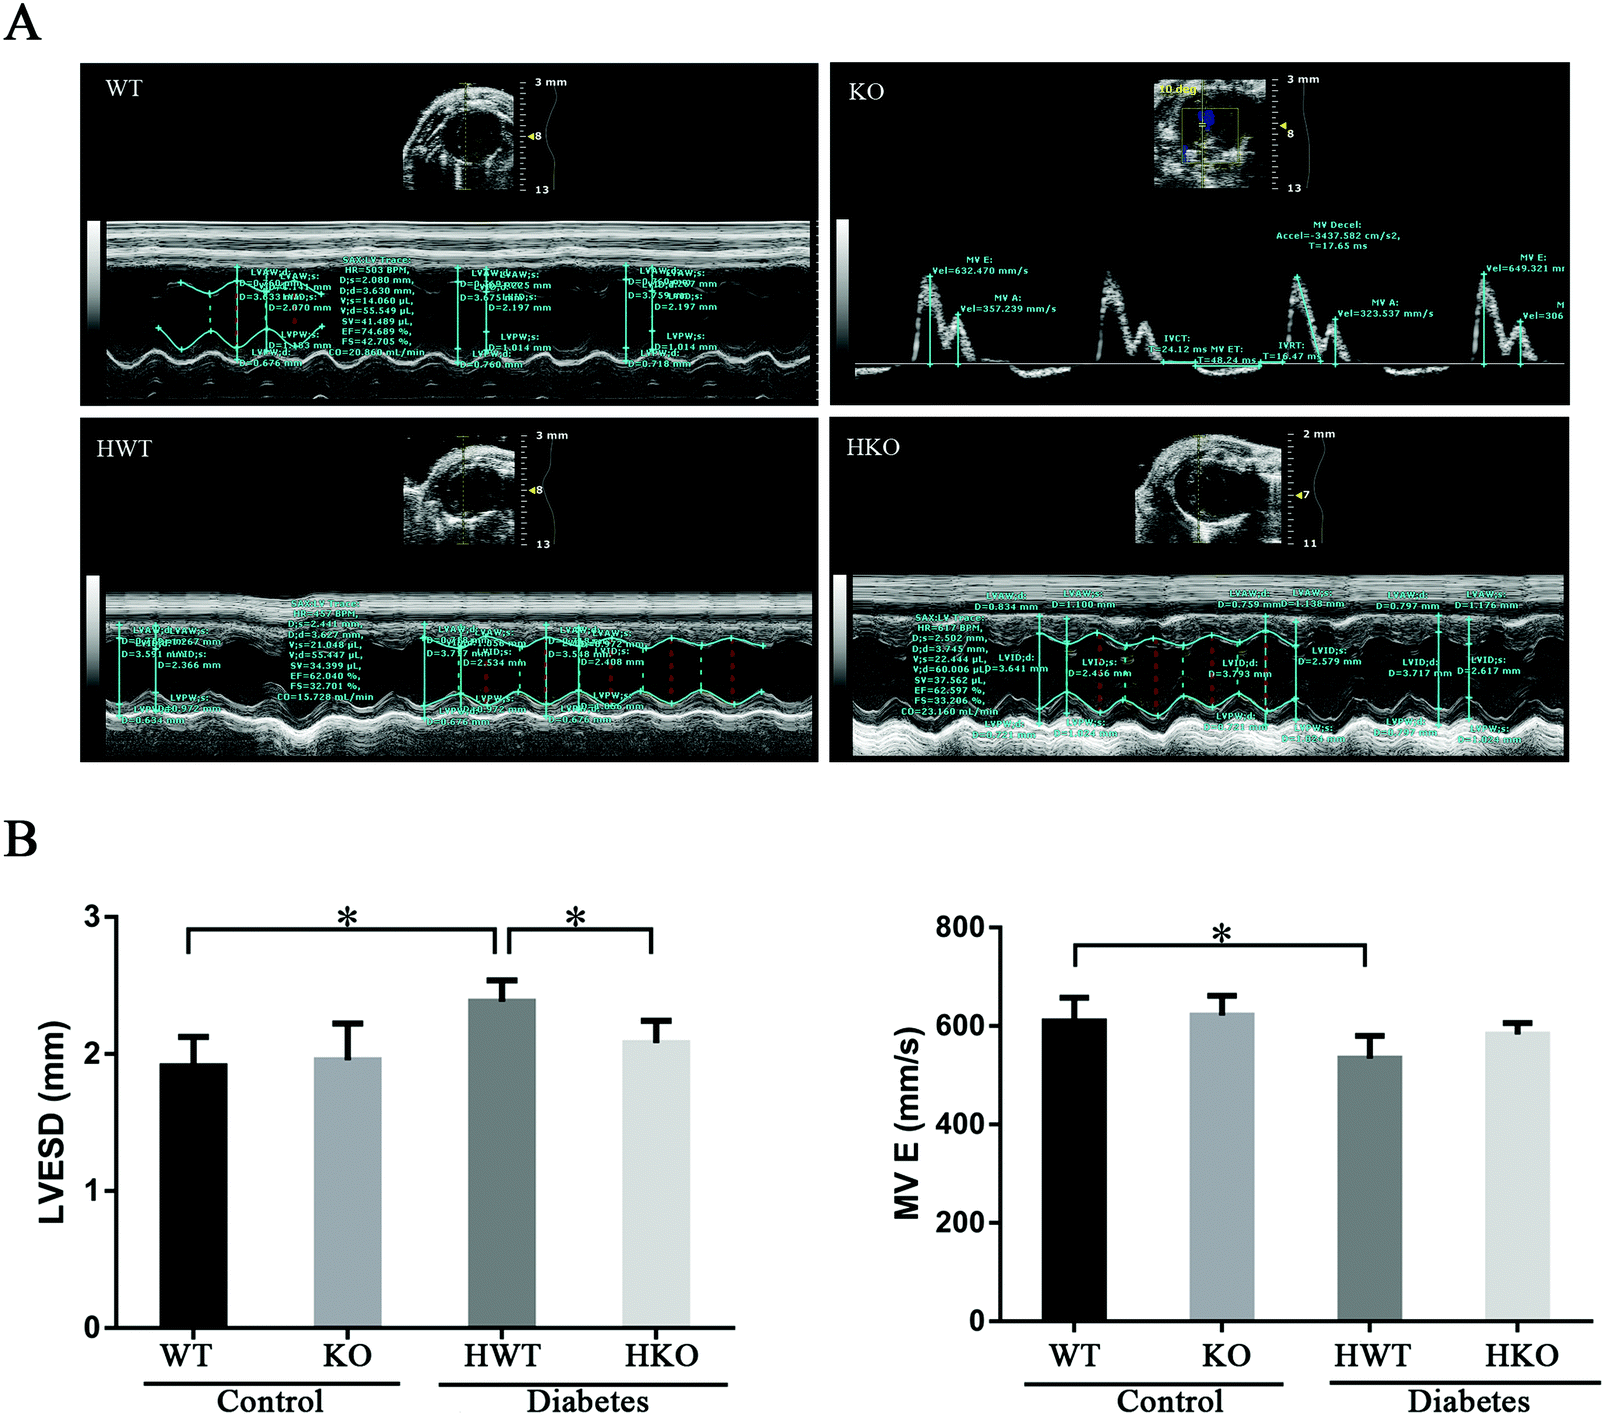 | ||
| Fig. 1 Echocardiographic analysis at 30 days post-modeling. (A) The data were measured and recorded using echocardiography, and representative slides are shown. (B) Significant differences were observed in LVESD and MV E. At least three independent measurements were performed. Data are shown as the mean ± standard deviation. *P < 0.05. | ||
At 60 days post-modeling, the condition of the mice in the model groups deteriorated. In the HWT group three mice died, and in the HKO group one mouse died. The remaining mice were evaluated using echocardiography (Fig. 2A). The result showed that, compared with the control groups, the model groups had significant differences in LVESD, LVESV, LVEF, and MV E/A and that the mice in the HWT group had significantly higher LVEDV, LVEDD and LVEF than those in the HKO group (P < 0.05) (Fig. 2B). We found that the diabetic mice at 60 days post-modeling showed obvious cardiac dysfunction as evidenced by the echocardiography data and that the cardiac dysfunction observed in the HWT group was significantly greater than that in the HKO group at 60 days post-modeling, indicating that miR-155 deficiency could attenuate the myocardial damage induced by diabetes.
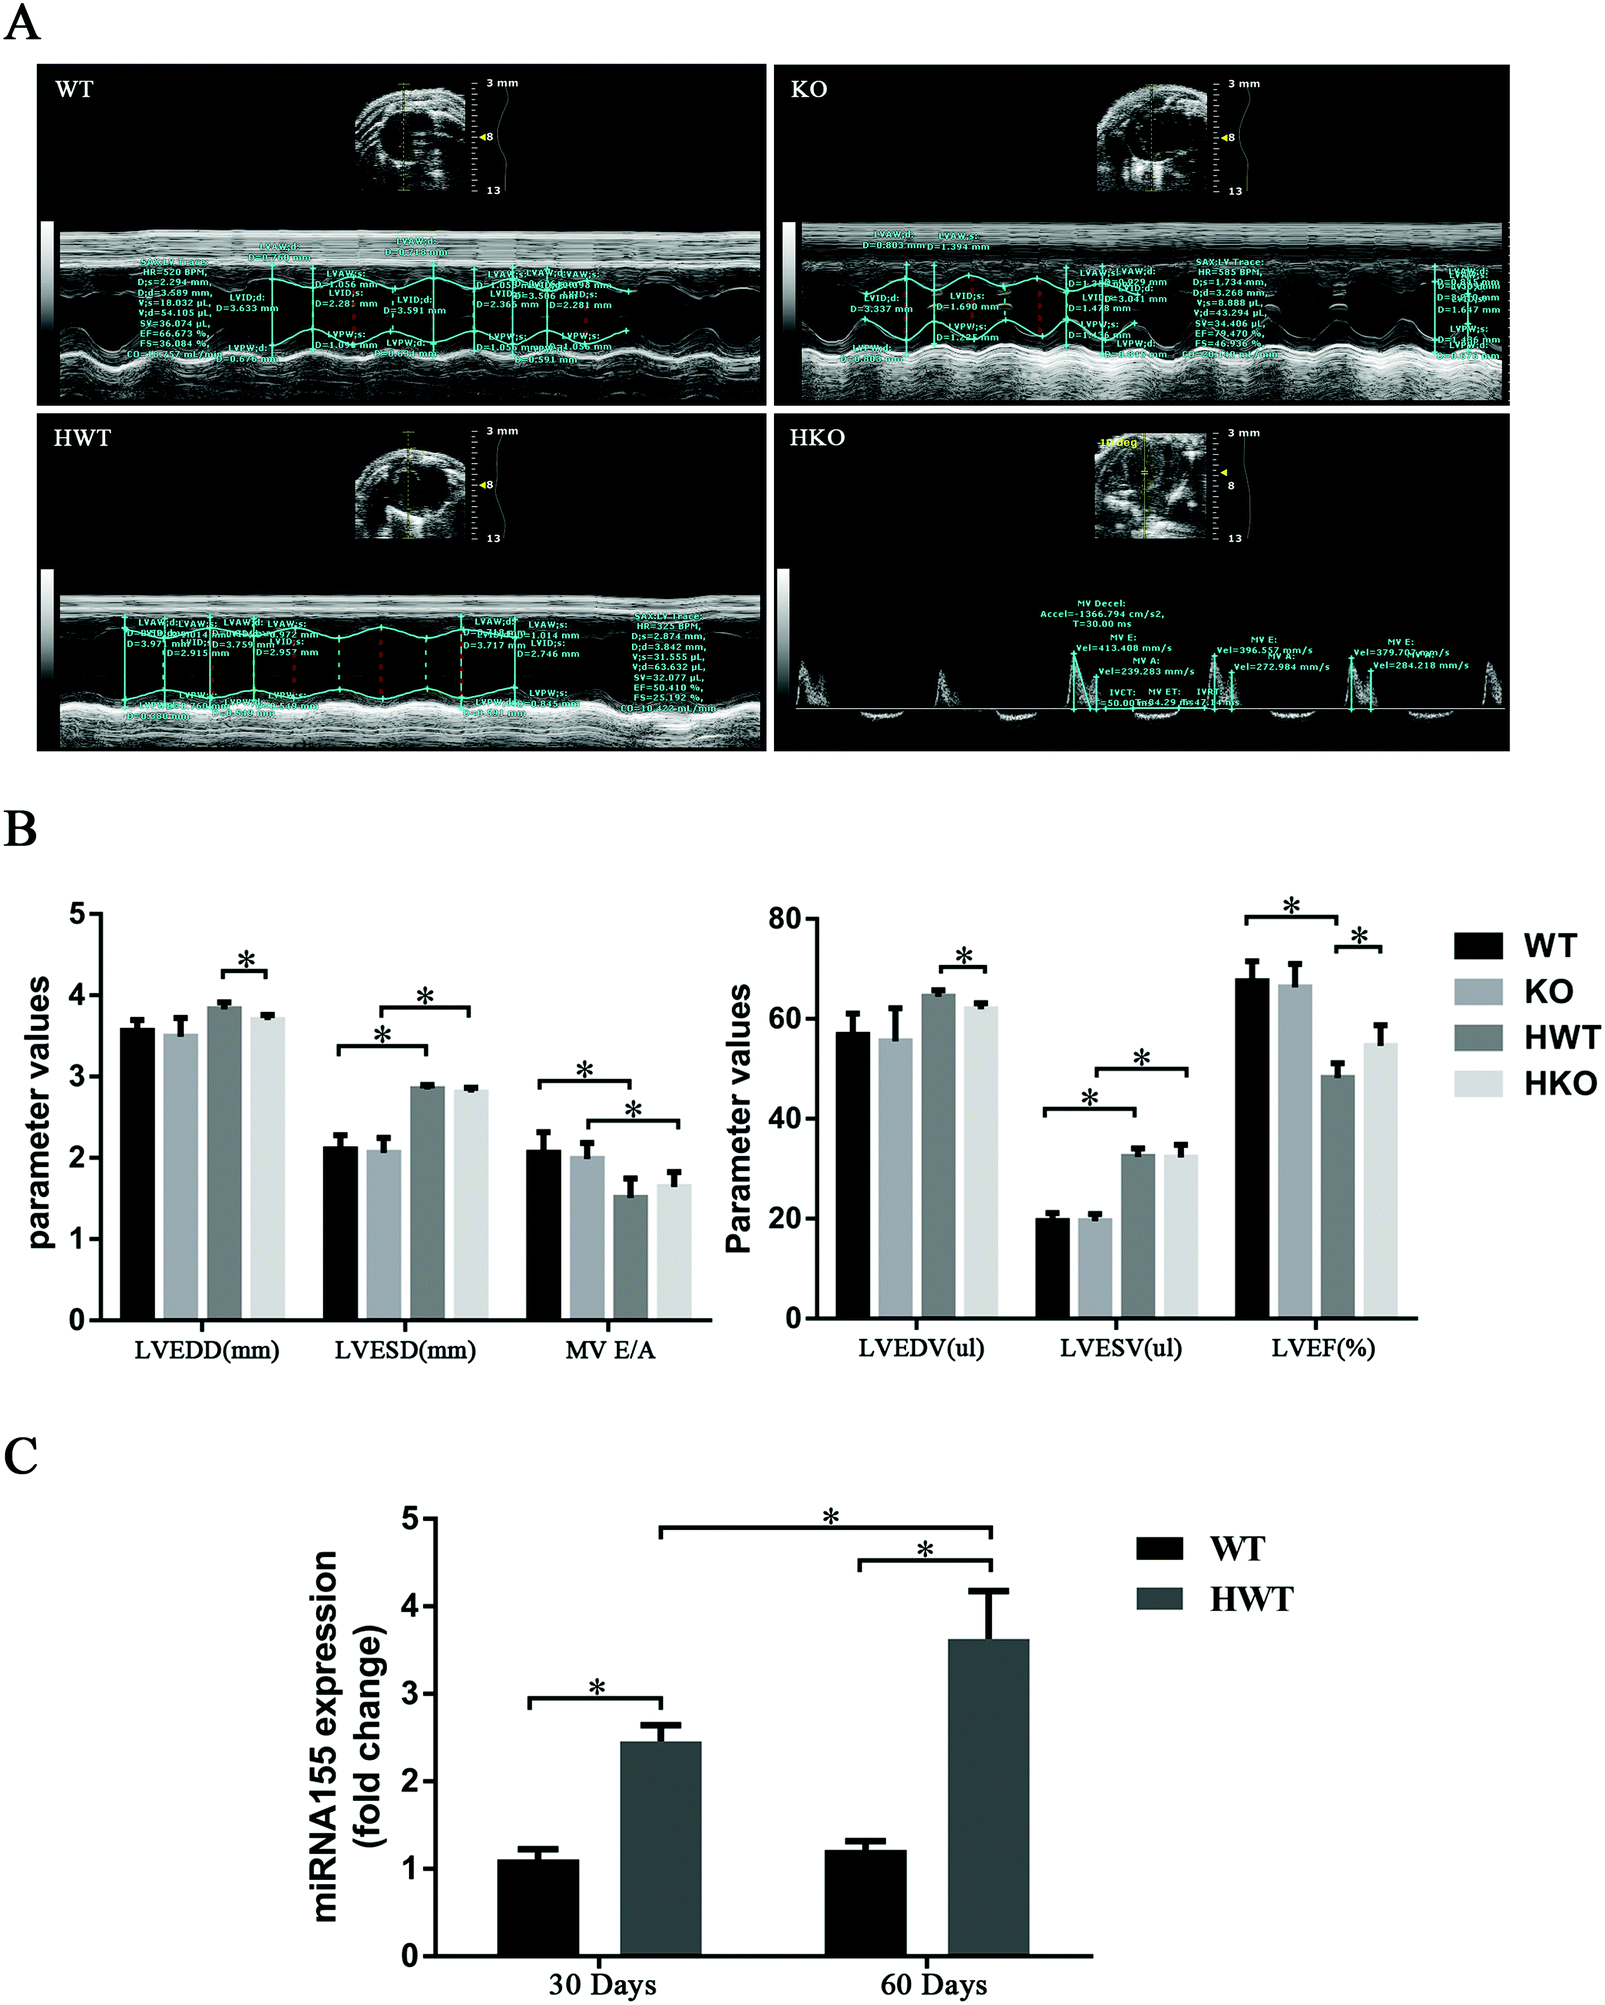 | ||
| Fig. 2 Echocardiographic analysis at 60 days post-modeling and the expression level of miR-155 in mice. (A) The data were measured and recorded using echocardiography, and representative slides are shown. (B) Significant differences were observed in LVEDD, LVESD, LVEDV, LVESV and LVEF. (C) The expression level of miR-155 in the mouse model at 30 and 60 days post-modeling. At least three independent measurements were performed. Data are shown as the mean ± standard deviation. *P < 0.05. | ||
We examined the expression level of miR-155 in the HWT group at 30 and 60 days post-modeling with the WT group as a control. As shown in Fig. 2C, the miR-155 expression level was higher in the HWT group than in the WT group. We also found that the expression of miR-155 increased with time in the HWT group (P < 0.05).
3.2 MiR-155 regulated cardiac fibrosis induced by diabetes in mice
After cardiac ultrasonography, all the mice were euthanized for histopathological examination. By HE staining, we observed the structure and morphology of the myocardium. Using SR staining, we determined the degree of myocardial fibrosis.As shown in Fig. 3A, the SR staining results viewed under a polarized light microscope revealed that the mice in the model groups showed varying degrees of collagen deposition in the intercellular space of the cardiomyocytes. Collagens I and III were the main contributors to myocardial fibrosis. As shown in Table 2, the deposition of collagens I and III increased significantly in the model groups compared with the control groups. And compared to the HKO group, the HWT group exhibited more collagen deposition in the intercellular spaces of the cardiomyocytes (Fig. 3B).
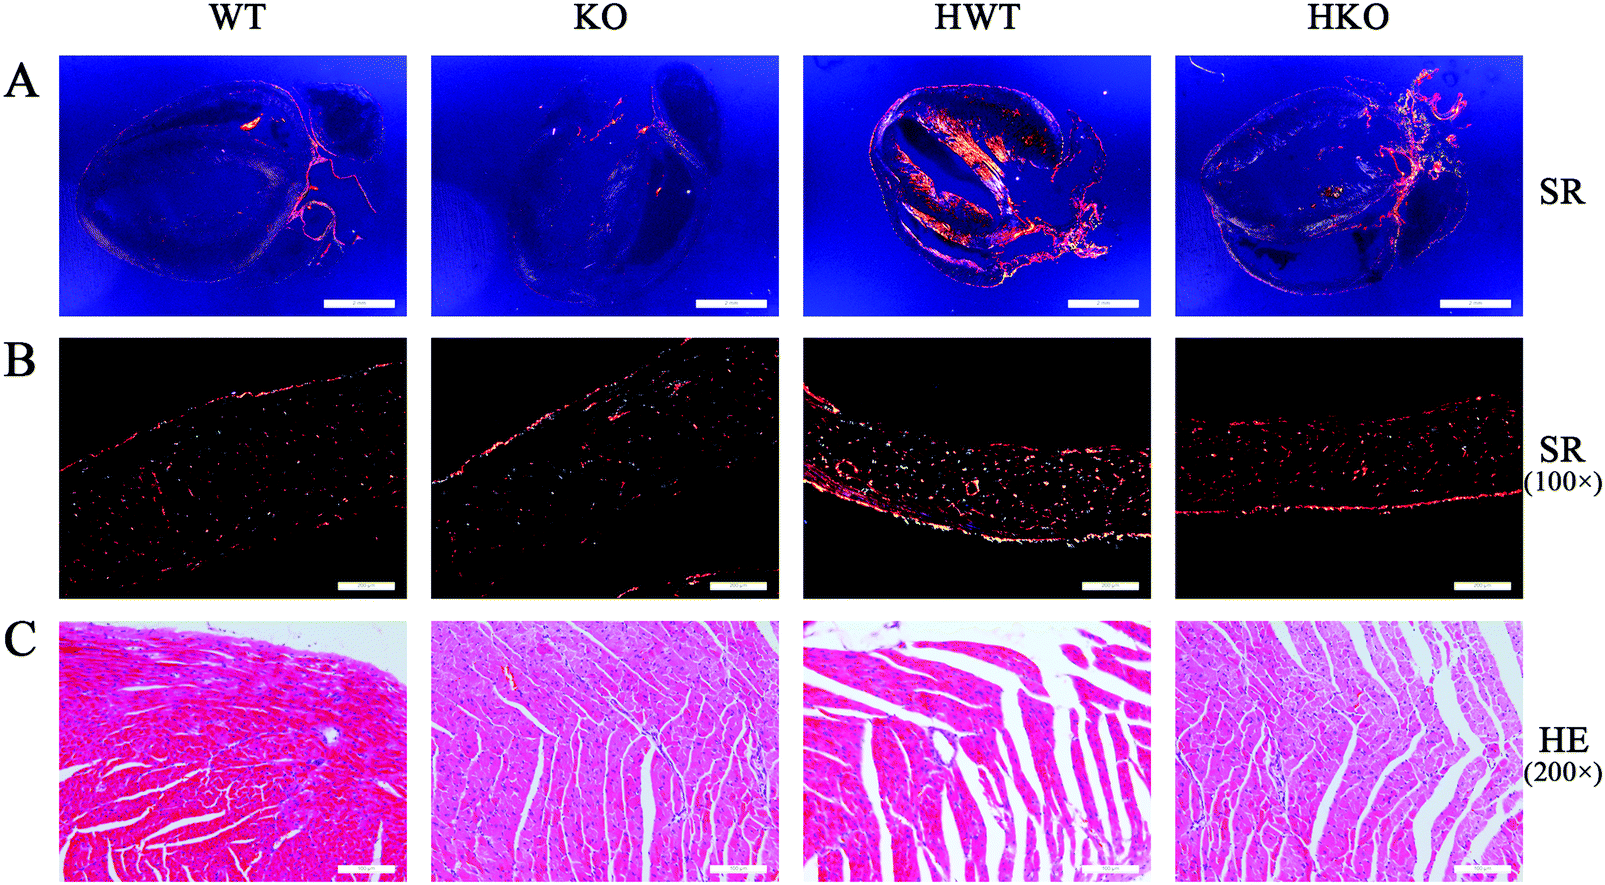 | ||
| Fig. 3 Histopathologic examination to observe the structure and morphology of the myocardium. Paraformaldehyde fixed heart sections were stained with hematoxylin–eosin (HE) and sirius-red (SR). (A) SR staining, holistic view under a polarized light microscope. (B) Slides were observed using a polarized light microscope (100×), and representative slides are shown. (C) HE staining. Slides were observed using a light microscope (200×), and representative slides are shown. | ||
| Item (unit) | Control groups* | Model groups* | ||
|---|---|---|---|---|
| WT (n = 10) | KO (n = 10) | HWT (n = 7) | HKO (n = 9) | |
| Note: the values represent the mean ± standard deviation; one-way analysis of variance and pairwise comparisons were performed; one-way analysis of variance and pairwise comparison; and *P < 0.05 compared with control groups; #P < 0.05 compared with the HWT group. | ||||
| Degree of myocardial fibrosis (%) | 1.77 ± 0.29 | 1.90 ± 0.42 | 25.68 ± 3.65# | 17.09 ± 2.32# |
In addition, HE staining revealed abnormal changes in the cellular structure, including cracks, porosity, and other structural failures, in the cardiomyocytes of the HWT group. These abnormal structures were less frequent in the HKO group (Fig. 3C).
3.3 MiR-155 regulated the collagen synthesis induced by HG in CFs
The results described above indicate that miR-155 deficiency could attenuate diabetes-induced myocardial fibrosis in mice. We then used CFs for further research on the specific mechanism involved in this process.To investigate the mechanism of miR-155 on myocardial fibrosis, miR-155 hairpin inhibitors, mimics and negative control siRNAs were transfected into CFs. As shown in Fig. 4A, after transfection, the miR-155 expression decreased in the CFs transfected with miR-155 inhibitors (the anti-miR group) and increased in the mimic-miR group. Compared with the control group, miR-155 expression increased 2.37 ± 0.31 fold in the mimic-miR group. And there was little endogenous miR-155 (0.24 ± 0.11 fold) exerting an effect in the presence of the miR-155 inhibitor. We also found that the LG conditions induced less miR-155 expression than the HG conditions in all groups, indicating that high glucose could directly lead to high levels of expression of miR-155. Collagen synthesis is the main contributor to myocardial fibrosis. To determine whether miR-155 could affect the collagen synthesis induced by HG, CFs of all the transfectants were exposed to LG (OC) and HG medium for 24 h and 48 h.
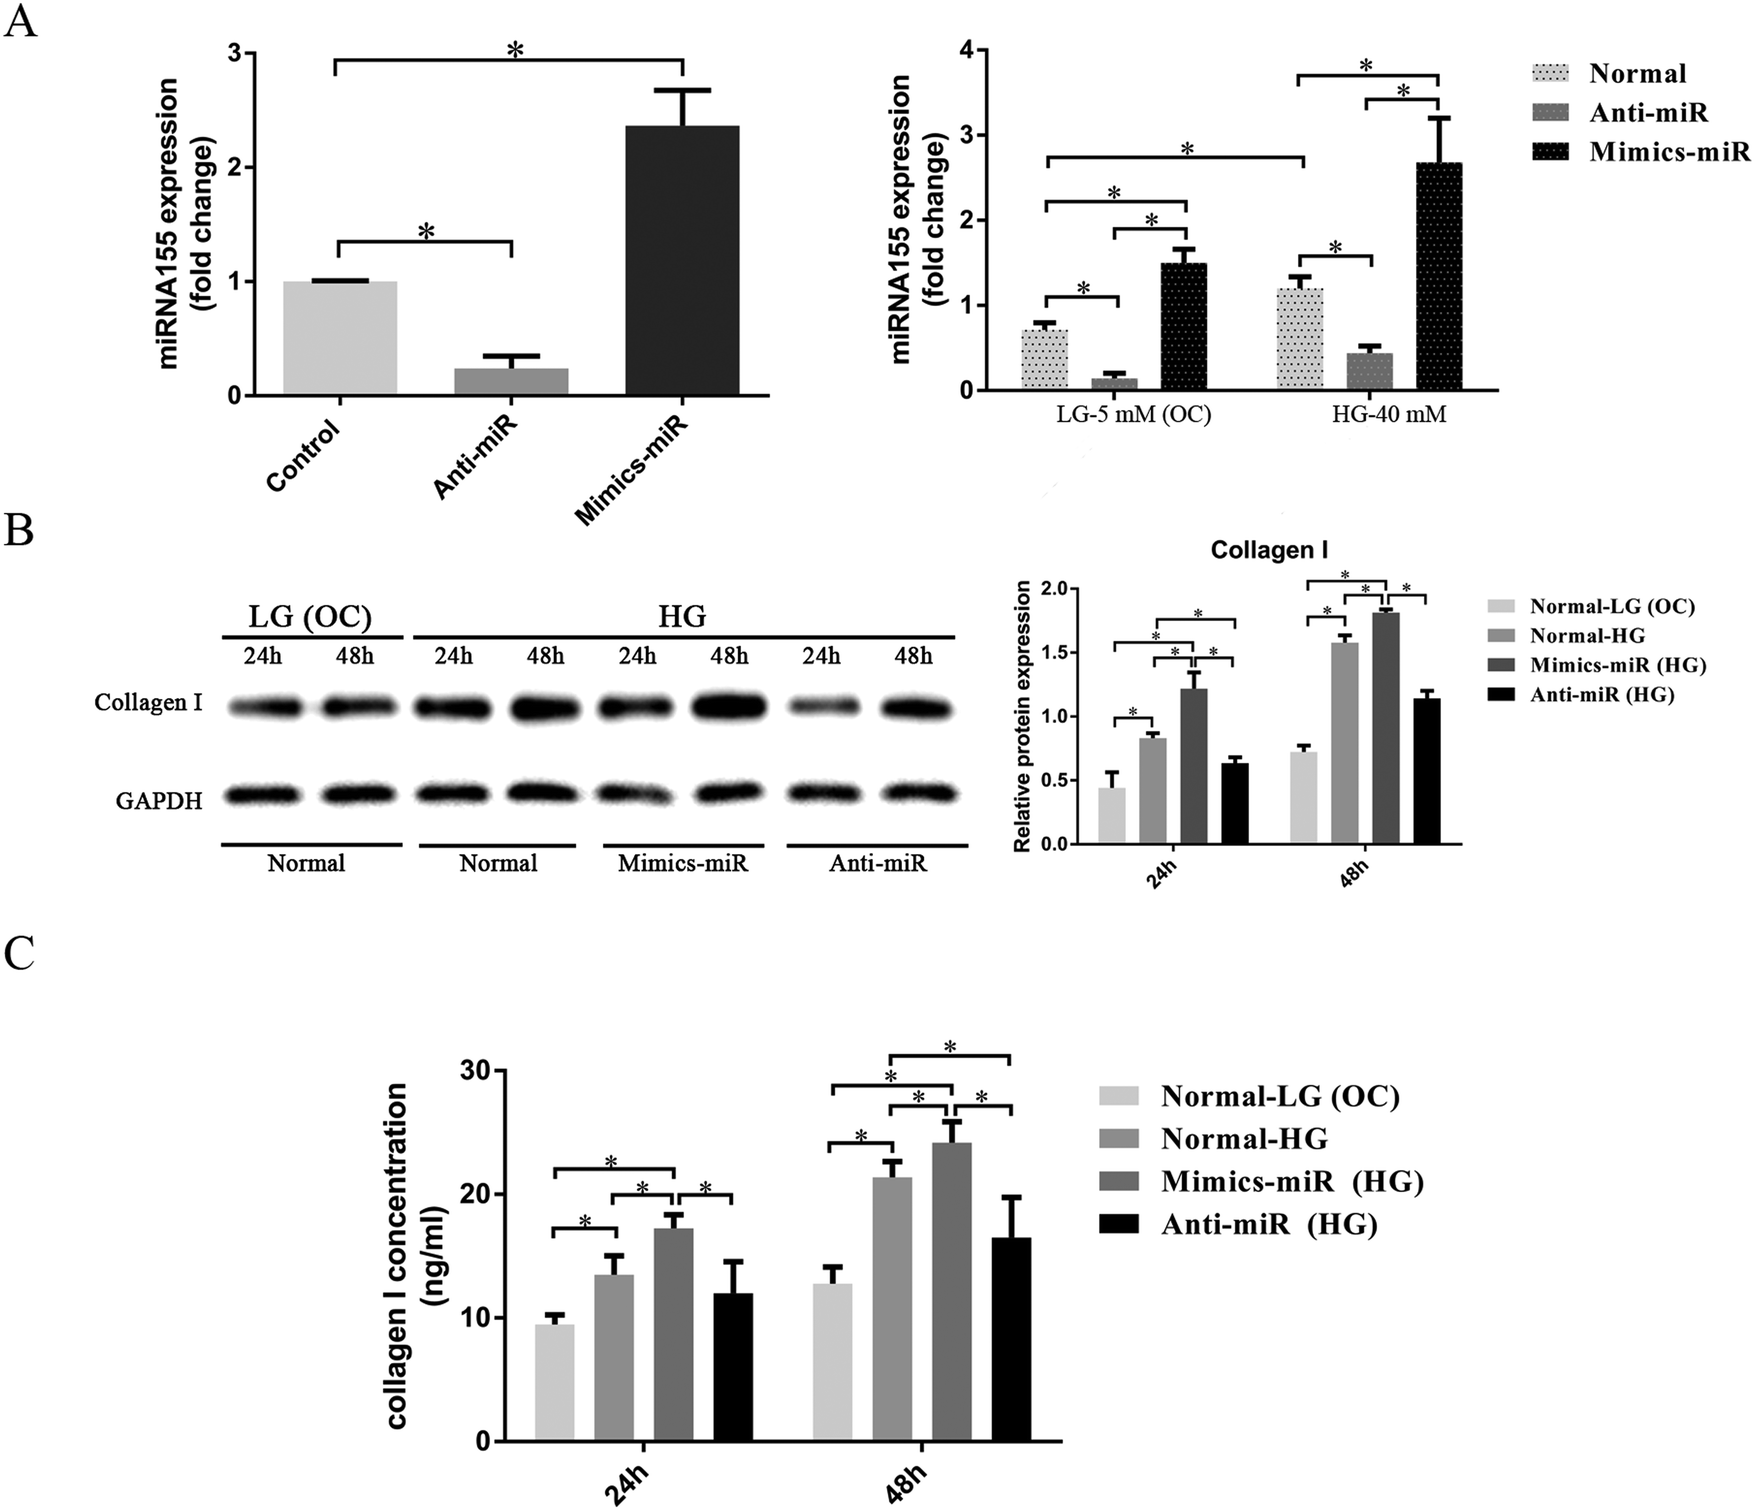 | ||
| Fig. 4 MiR-155 regulated collagen synthesis induced by HG in CFs. (A) Graph illustrating relative miRNA expression levels following transfection with miR-155 mimics, inhibitors and negative control. After the transfection, CFs were treated with LG (OC) (5 mM glucose + 35 mM mannitol, osmotic control) or HG (40 mM glucose) medium for 12 h. The expression level of miR-155 was detected using a QT-PCR with RNU6 as the normalization control. (B) To evaluate the interaction on collagen I deposition by miR-155, CFs were exposed to LG (OC) and HG medium for 24 h and 48 h. The expression level of collagen I was detected via western blot analysis with GAPDH as the normalization control. (C) The level of collagen I in the cell supernatants was evaluated using ELISAs. At least three independent experiments were performed. Data are shown as the mean ± standard deviation. *P < 0.05. | ||
Western blotting analysis (Fig. 4B) showed that the expression level of collagen I in HG (normal-HG group) was higher than in the normal-LG (OC) group, and that the level in the mimic-miR (HG) group was significantly higher than that in the other groups. The expression level of collagen I was significantly lower in the anti-miR (HG) group than in the normal-HG group (P < 0.05). We also found that the expression level of collagen I stimulated by HG increased with time.
We used ELISAs to evaluate the level of collagen I secreted into the cell supernatants. As shown in Fig. 4C, the amount of collagen I secreted by the normal-HG group was significantly greater than that by the normal-LG (OC) group. The supernatants from the mimics-miR (HG) group had the highest concentration of collagen I, whereas the concentration of collagen I in the supernatants from the anti-miR (HG) group was significantly lower than in the supernatants from the normal-HG group (P < 0.05). The concentration of collagen I stimulated by HG increased progressively with time.
3.4 MiR-155 regulated cardiac fibrosis induced by HG via the TGF-β signaling pathway in CFs
To investigate whether miR-155 has a direct influence on the TGF-β signaling pathway, the expression of relevant proteins was assessed (Fig. 5A). The results show that with time, the expression of TGF-β1 and Smad 2, and the phosphorylation of Smad 2 (P-Smad 2) stimulated by HG, increased. As shown in Fig. 5B, the mimic-miR (HG) group showed the highest level of expression of the TGF-β1 protein, and the anti-miR (HG) group had the lowest level (P < 0.05). In addition, compared to the normal group, the results showed that miR-155 overexpression promoted the expression of Smad 2 and P-Smad 2, significantly increasing the ratio of P-Smad 2/Smad 2 after stimulation by HG for 48 h, whereas anti-miR-155 significantly inhibited Smad 2, P-Smad 2 and P-Smad 2/Smad 2 after stimulation by HG for 24 h and 48 h (Fig. 5C).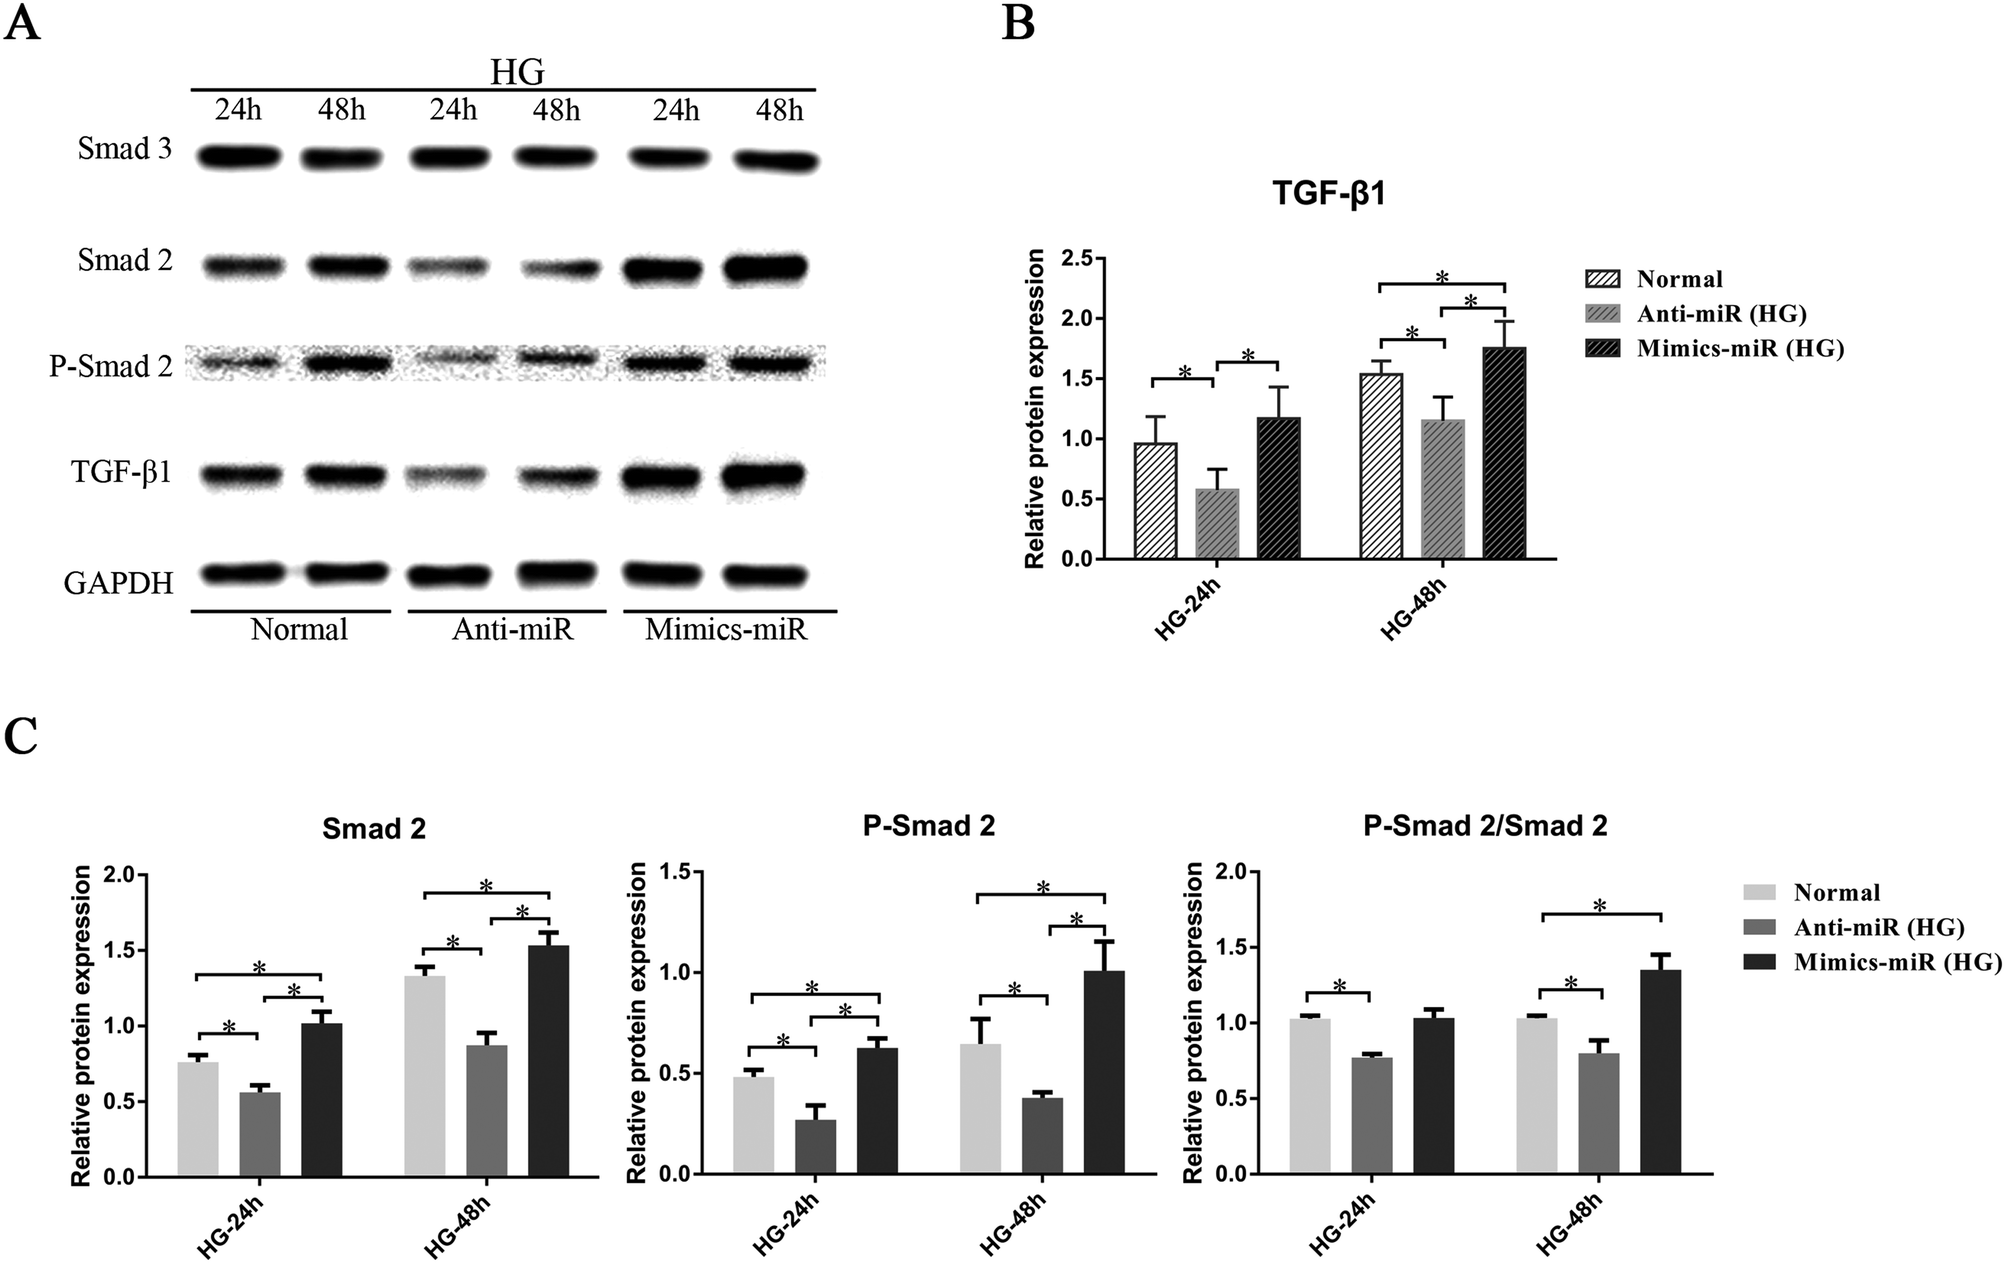 | ||
| Fig. 5 MiR-155 regulated cardiac fibrosis induced by HG via the TGF-β signaling pathway in CFs. CFs were incubated in HG medium for 24 h and 48 h. (A) The protein expression levels of TGF-β1, Smad 2, P-Smad 2, and Smad 3 were detected via western blot analysis with GAPDH as the normalization control. (B) Histogram showing the protein expression levels of TGF-β1. (C) Histogram showing the protein expression levels of Smad 2, P-Smad 2 and the ratio of P-Smad2/Smad2. At least three independent experiments were performed. Data are shown as the mean ± standard deviation. *P < 0.05. | ||
We also tested the level of Smad 3 to assess whether the targeting of miR-155 on Smad 2 was unique. The results show that the expression of Smad 3 was unaltered and that this indicates that the TGF-β1–Smad 3 signaling pathway was not affected by miR-155 in our experiments. The results showed that miR-155 could specifically regulate the expression of TGF-β1 and Smad 2 induced by HG in CFs.
4. Discussion
Diabetes is a risk factor for heart disease, and it leads to the aggravation of cardiovascular diseases. Cardiac fibrosis is a pathological consequence of diabetes, and it plays an important role in a variety of cardiac diseases, including myocardial infarction, atrial fibrillation and cardiomyopathy.30 TGF-β is a pleiotropic cytokine, and plays a role in a variety of important biological processes. TGF-β1 and its products are thought to contribute to cardiac fibrosis induced by diabetes. Furthermore, several signaling cascades, including RAAS, ROS, STRA 6, and STAT 3, also regulate the process of cardiac fibrosis.31,32 Previous research showed that miRNAs, including miR-21, miR-29, and miR-214, play important roles in cardiac fibrosis.33,34 It has been reported that the overexpression of miR-21 in CFs can cause cardiac fibrosis by up-regulation of STAT 3,35 and that miR-328 can significantly enhance cardiac fibrosis during myocardial infarction.36 A detailed review on previous studies linking miRNAs with TGF-β/Smad signaling by H. Butz37 indicates that most members of the TGF-β pathway are known to be targeted by one or more miRNAs. In addition, the biogenesis of miRNAs is also regulated by TGF-β both directly and through Smads. It is confirmed that some miRNAs can modulate the progress of myocardial fibrosis via the TGF-β/Smad signaling pathway. We have presented data here demonstrating that miR-155 regulates high glucose-induced cardiac fibrosis via the TGF-β1–Smad 2 signaling pathway.In fact, the main feature of cardiac fibrosis is collagen synthesis in the interstices of the myocardium. Collagens result from the synthesis of the extracellular matrix (ECM) under physiological and pathological conditions. Moderate amounts of collagens are beneficial for cardiac structure and function under physiological conditions. Our results show that the level of collagen I was significantly increased in both cell lysates and supernatants. Generally, the homeostasis of the ECM is maintained by the balance between collagen synthesis and degradation. However, when the balance breaks down due to high glucose or up-regulation of miR-155, the increase of collagens under pathological conditions can lead to cardiac dysfunction and even heart failure.38 The results also suggest that the change of miR-155 in the cell's intracellular component is likely to disrupt normal cellular metabolic processes such as collagen synthesis and protein secretion, and may result in cardiac dysfunction and fibrosis.
We next evaluated the direct effect of miR-155 on the TGF-β signaling pathway, which has been reported to promote collagen synthesis and to be strongly associated with cardiac fibrosis. From the bioinformatics database, (TargetScan and miRDB) miR-155 is predicted to target TGF-beta activated kinase 1(TGF-β-ak 1) at two distinct sites located at its 3′UTR. The first site is 7 mer-m8, located at position 334–340, and the second is 7 mer-1A, located at position 1079–1085. Furthermore, miR-155 is also predicted to target Smad 2 at two distinct sites located at its 3′UTR. The first site is 7 mer-m8, located at position 1760–1766, and the second is 8-mer, located at position 6981–6988. Then we referred to correlational studies published in recent years. In 2008, W. Kong, et al.39 found that miR-155 is regulated via the TGF-β/Smad pathway and contributes to epithelial cell plasticity by targeting RhoA. And in 2010, a study by Louafi F40 provides evidence for the first time of a direct link between miR-155 and human Smad 2 and the relevance of these two different seeding regions in HeLa cells. So we have reason to believe that there must be direct interactions between miR-155 and its gene targets (TGF-β-ak 1 and Smad 2) in the TGF-β/Smad pathway. Furthermore, Smad 2 is a vital target of miR-155, which is the most relevant regarding the TGF-β1–Smad 2 signaling pathway.
The results of our study show that after 24 h of stimulation by high glucose, there were no significant changes in P-Smad 2/Smad 2 in the mimic-miR group. A possible reason for this may be that there is a delayed activation of Smad 2 via the TGF-β pathway, because a few studies have shown that TGF-β exerts its effects via the other pathway in a small window during the early stage of cardiac dysfunction.41,42 Furthermore, Smad proteins are closely related to other transcription factors. For example, Smad 2/3 as a complex is associated with hypoxia-inducible factor (HIF-1), which enhances TGF-β-induced activation via a vascular endothelial growth factor (VEGF) promoter.43,44 Thus, it is conceivable that miR-155 may be affected by other transcription factors. However, with time, we found that significant changes in P-Smad2/Smad2 were shown in both the anti-miR and mimics-miR groups after stimulation by HG for 48 h. These results suggest that the activation of Smad 2 is a vital factor for miR-155 in the progress of cardiac fibrosis, as indicated by the regulation of the TGF-β1–Smad 2 pathway.
Recent studies have shown that miR-155 plays an important role in various aspects of cardiovascular disease, including the prevention of inflammatory infiltration, the regulation of autophagy, and the participation of immunoreactions.45,46 In addition, it has been reported that miR-155 has a close association with fibrotic diseases. R. B. Christmann, et al.47 found that miR-155 may play a role in the progression of lung fibrosis. S. Bala, et al.48 discovered that high levels of miR-155 may promote liver fibrosis and alcohol-induced steatohepatitis. Although previous investigations have described a role for miR-155 in liver and lung fibrosis, our study of cardiac fibrosis is an important supplement to correlational studies on the biological characteristics and mechanisms of miR-155. Furthermore, the experimental results will provide a reference for our further study and data analysis.
The data above indicate that miR-155 plays an important role in the development of cardiac fibrosis. To reduce myocardial damage and the development of cardiac fibrosis, it is necessary to regulate the expression of miR-155 in vivo before acute symptoms of diabetes develop. Furthermore, high glucose can directly lead to high levels of expression of miR-155. These data suggest that miR-155 is one of the significant regulatory factors in the process of cardiac fibrosis. However, the mechanism of cardiac fibrosis induced by diabetes is extremely complex. Many mechanisms have been implicated in cardiac fibrosis, particularly in pathologic situations, including diabetic cardiomyopathy.49 Many studies have identified various types of pathological mechanisms induced by diabetes, including glycogen deposition, metabolic disorder and abnormal signaling pathways.50,51 In fact, the main characteristic of cardiac fibrosis induced by diabetes is collagen deposition in the interstices of the myocardium.52 It is reported that regulation of Smad 2/3 can adjust the levels of HG-induced collagen synthesis.53 Our study confirms that miR-155 regulates high glucose-induced cardiac fibrosis through direct targeting of TGF-β receptors, and it has an obvious impact on the TGF-β1–Smad 2 signaling pathway. However, it is not clear whether other mechanisms or pathways contributing to cardiac fibrosis are affected by miR-155. Therefore, we will next explore the interaction between the TGF-β1–Smad2 pathway and other pathways that regulate cardiac fibrosis under diabetic conditions.
Altogether, our study indicates that miR-155 is expressed in cardiomyocytes, and that its expression significantly affects cardiac fibrosis. Our results show that a deficiency of miR-155 could attenuate cardiac fibrosis induced by diabetes. We focused on the effect of miR-155 on the TGF-β signaling pathway and demonstrated that miR-155 plays a vital role in regulating the TGF-β1–Smad2 cascade.
5. Conclusions
In conclusion, our study demonstrates that miR-155 deficiency could prevent cardiac fibrosis induced by diabetes in mice and that it could also attenuate collagen synthesis induced by HG in CFs. We found that miR-155 regulated cardiac fibrosis via the TGF-β1–Smad 2 signaling pathway. These findings suggest that miR-155 might be a therapeutic target for cardiac fibrosis induced by diabetes.Conflict of interest
The authors declare that they have no competing interests.Authors' contributions
DZ, YCC, BL, XKL and YT conceived and designed the experiments. DZ, YCC and YT performed the analysis. DZ, XKL, BL and YT wrote the manuscript. All authors read and approved the final manuscript.Funding
This work was supported by the National High Technology Research and Development Program of China (863 Program, Project No: SS2012AA023503, China), YT and the Peking Union Medical College Student Innovation Fund (Project No: 2015-1002-02-23, Beijing, China), DZ.Acknowledgements
We thank the members of Beijing Key Laboratory of Pre-Clinical Research and Evaluation for Cardiovascular Implant Materials for helpful discussions and assistance regarding this project. We specifically thank Ruicheng Sun, Peihe Wang, and Baojie Zhang (PUMC-Beijing) for help with animal feeding.References
- J. P. Medhi and S. Dandapat, Comput. Biol. Med., 2016, 74, 30–44 CrossRef PubMed.
- A. L. Barwick, J. W. Tessier, J. X. Janse de, J. R. Ivers and V. H. Chuter, BMJ Open Diabetes Res. Care, 2016, 4, e000235 CrossRef PubMed.
- C. S. Abdullah, Z. Li, X. Wang and Z. Q. Jin, Int. Immunopharmacol., 2016, 39, 251–264 CrossRef CAS PubMed.
- J. P. Arab, F. Barrera, C. Gallego, J. P. Valderas, S. Uribe, C. Tejos, C. Serrano, C. Serrano, Á. Huete, J. Liberona, P. Labbé, T. Quiroga, C. Benítez, P. Irarrázaval, A. Riquelme and M. Arrese, Ann. Hepatol., 2016, 15, 721–728 Search PubMed.
- A. Pendyal and J. M. Gelow, Heart Fail. Clin., 2016, 12, 349–361 CrossRef PubMed.
- K. T. Weber and J. Díez, Circ.: Heart Failure, 2016, 9 DOI:10.1161/CIRCHEARTFAILURE.116.003315.
- R. García, D. Merino, J. M. Gómez, J. F. Nistal, M. A. Hurlé, A. L. Cortajarena and A. V. Villar, Cell. Signaling, 2016, 28, 1563–1579 CrossRef PubMed.
- V. V. Karri, G. Kuppusamy, S. V. Talluri, S. S. Mannemala, R. Kollipara, A. D. Wadhwani, S. Mulukutla, K. R. Raju and R. Malayandi, Int. J. Biol. Macromol., 2016, 93, 1519–1529 CrossRef CAS PubMed.
- A. A. Lee, W. H. Dillmann, A. D. McCulloch and F. J. Villarreal, J. Mol. Cell. Cardiol., 1995, 27, 2347–2357 CrossRef CAS PubMed.
- B. P. Lewis, C. B. Burge and D. P. Bartel, Cell, 2005, 120, 15–20 CrossRef CAS PubMed.
- D. P. Bartel, Cell, 2009, 136, 215–233 CrossRef CAS PubMed.
- J. A. Mennigen and D. Zhang, Comp. Biochem. Physiol., Part D: Genomics Proteomics, 2016, 20, 19–26 CrossRef CAS PubMed.
- L. T. Morton, D. Situnayake and G. R. Wallace, Curr. Opin. Rheumatol., 2016, 28, 39–44 CrossRef CAS PubMed.
- I. Omrane and A. Benammar-Elgaaied, Biochim. Biophys. Acta, Rev. Cancer, 2015, 1856, 28–38 CrossRef CAS PubMed.
- H. K. Park, W. Jo, H. J. Choi, S. Jang, J. E. Ryu, H. J. Lee, H. Lee, H. Kim, E. S. Yu and W. C. Son, J. Vet. Sci., 2016, 17, 45–51 CrossRef PubMed.
- E. Tili, M. Chiabai, D. Palmieri, M. Brown, R. Cui, C. Fernandes, T. Richmond, T. Kim, T. Sheetz, H. L. Sun, A. Lagana, D. Veneziano, S. Volinia, L. Rassenti, T. Kipps, H. Awad, J. J. Michaille and C. M. Croce, Oncotarget, 2015, 6, 24599–24610 CrossRef PubMed.
- Q. Yin, X. Wang, C. Roberts, E. K. Flemington and J. A. Lasky, Virology, 2016, 494, 158–167 CrossRef CAS PubMed.
- C. H. Lawrie, Br. J. Haematol., 2013, 160, 571–581 CrossRef CAS PubMed.
- M. M. Zadeh, N. Motamed, N. Ranji, M. Majidi and F. Falahi, J. Breast Cancer, 2016, 19, 45–52 CrossRef PubMed.
- X. M. Fu, Y. Z. Zhou, Z. Cheng, X. B. Liao and X. M. Zhou, BioMed Res. Int., 2015, 2015, 831641 Search PubMed.
- H. J. Lee, E. J. Lee and M. Seo, Yonsei Med. J., 2016, 57, 247–253 CrossRef CAS PubMed.
- C. Z. Wang, J. J. Yuan, W. J. Li, H. Y. Zhang and J. Z. Ye, Molecules, 2015, 20, 22257–22271 CrossRef CAS PubMed.
- M. K. Balijepalli, V. Suppaiah, A. M. Chin, A. S. Buru, S. R. Sagineedu and M. R. Pichika, Pharmacogn. Res., 2015, 7, 38–44 CrossRef PubMed.
- M. Pacurari and P. B. Tchounwou, Int. J. Inflammation, 2015, 2015, 101527 Search PubMed.
- R. Wang, L. D. Dong, X. B. Meng, Q. Shi and W. Y. Sun, Biochem. Biophys. Res. Commun., 2015, 464, 574–579 CrossRef CAS PubMed.
- A. Fayssoil, G. Renault, N. Guerchet, C. Marchiol-Fournigault, F. Fougerousse and I. Richard, Neurol. Int., 2013, 5, e22 CrossRef PubMed.
- D. A. Springer, M. Allen, V. Hoffman, L. Brinster, M. F. Starost, M. Bryant and M. Eckhaus, Pathobiol. Aging Age-Relat. Dis., 2014, 4 DOI:10.3402/pba.v4.24932.
- C. L. Song, B. Liu, H. Y. Diao, Y. F. Shi, Y. X. Li, J. C. Zhang, Y. Lu, G. Wang, J. Liu, Y. P. Yu, Z. Y. Guo, J. P. Wang, Z. Zhao, J. G. Liu, Y. H. Liu, Z. X. Liu, D. Cai and Q. Li, Int. J. Mol. Sci., 2014, 15, 17442–17456 CrossRef PubMed.
- T. D. Schmittgen and K. J. Livak, Nat. Protoc., 2008, 3, 1101–1108 CrossRef CAS PubMed.
- B. Heydari, S. Abdullah, J. V. Pottala, R. Shah, S. Abbasi, D. Mandry, S. A. Francis, H. Lumish, B. B. Ghoshhajra, U. Hoffmann, E. Appelbaum, J. H. Feng, R. Blankstein, M. Steigner, J. P. McConnell, W. Harris, E. M. Antman, M. Jerosch-Herold and R. Y. Kwong, Circulation, 2016, 134, 378–391 CrossRef CAS PubMed.
- J. Wang, L. Lu, Y. Wang, Y. Wu, J. Han, W. Wang, C. Li and P. Tu, J. Ethnopharmacol., 2015, 176, 375–384 CrossRef PubMed.
- Q. Zhang, Y. Deng, W. Lai, X. Guan, X. Sun, Q. Han, F. Wang, X. Pan, Y. Ji, H. Luo, P. Huang, Y. Tang, L. Gu, G. Dan, J. Yu, M. Namaka, J. Zhang, Y. Deng and X. Li, Sci. Rep., 2016, 6, 30146 CrossRef PubMed.
- H. Dong, S. Dong, L. Zhang, X. Gao, G. Lv, W. Chen and S. Shao, Anat. Rec., 2016, 299, 1348–1357 CrossRef CAS PubMed.
- J. Wang, O. W. Liew, A. M. Richards and Y. T. Chen, Int. J. Mol. Sci., 2016, 18 DOI:10.3390/ijms17050749.
- Z. Huang, X. J Chen, C. Qian, Q. Dong, D. Ding, Q. F. Wu, J. Li, H. F. Wang, W. H. Li, Q. Xie, X. Cheng, N. Zhao, Y. M. Du and Y. H. Liao, Circ.: Arrhythmia Electrophysiol., 2016, 9 DOI:10.1161/CIRCEP.115.003396.
- W. Du, H. Liang, X. Gao, X. Li, Y. Zhang, Z. Pan, C. Li, Y. Wang, Y. Liu, W. Yuan, N. Ma, W. Chu, H. Shan and Y. Lu, Cell. Physiol. Biochem., 2016, 39, 827–836 CrossRef CAS PubMed.
- H. Butz, K. Rácz, L. Hunyady and A. Patócs, Trends Pharmacol. Sci., 2012, 33, 382–393 CrossRef CAS PubMed.
- T. H. Thai, D. P. Calado, S. Casola, K. M. Ansel, C. Xiao, Y. Xue, A. Murphy, D. Frendewey, D. Valenzuela, J. L. Kutok, M. Schmidt-Supprian, N. Rajewsky, G. Yancopoulos, A. Rao and K. Rajewsky, Science, 2007, 316, 604–608 CrossRef CAS PubMed.
- W. Kong, H. Yang, L. He, J. J. Zhao, D. Coppola, W. S. Dalton and J. Q. Cheng, Mol. Cell. Biol., 2008, 28, 6773–6784 CrossRef CAS PubMed.
- F. Louafi, R. T. Martinez-Nunez and T. Sanchez-Elsner, J. Biol. Chem., 2010, 285, 41328–41336 CrossRef CAS PubMed.
- M. Ikeuchi, H. Tsutsui, T. Shiomi, H. Matsusaka, S. Matsushima, J. Wen, T. Kubota and A. Takeshita, Cardiovasc. Res., 2004, 64, 526–535 CrossRef CAS PubMed.
- D. J. Hausenloy and D. M. Yellon, Cardiovasc. Res., 2004, 61, 448–460 CrossRef CAS PubMed.
- T. Sánchez-Elsner, L. M. Botella, B. Velasco, A. Corbí, L. Attisano and C. Bernabéu, J. Biol. Chem., 2001, 276, 38527–38535 CrossRef PubMed.
- S. C. Shih and K. P. Claffey, Growth Factors, 2001, 19, 19–34 CrossRef CAS PubMed.
- I. Faraoni, F. R. Antonetti, J. Cardone and E. Bonmassar, Biochim. Biophys. Acta, Mol. Basis Dis., 2009, 1792, 497–505 CrossRef CAS PubMed.
- M. Nazari-Jahantigh, Y. Wei, H. Noels, S. Akhtar, Z. Zhou, R. R. Koenen, K. Heyll, F. Gremse, F. Kiessling, J. Grommes, C. Weber and A. Schober, J. Clin. Invest., 2012, 122, 4190–4202 CAS.
- R. B. Christmann, A. Wooten, P. Sampaio-Barros, C. L. Borges, C. R. Carvalho, R. A. Kairalla, C. Feghali-Bostwick, J. Ziemek, Y. Mei, S. Goummih, J. Tan, D. Alvarez, D. J. Kass, M. Rojas, T. L. de Mattos, E. Parra, G. Stifano, V. L. Capelozzi, R. W. Simms and R. Lafyatis, Arthritis Res. Ther., 2016, 18, 155 Search PubMed.
- S. Bala, T. Csak, B. Saha, J. Zatsiorsky, K. Kodys, D. Catalano, A. Satishchandran and G. Szabo, J. Hepatol., 2016, 64, 1378–1387 CrossRef CAS PubMed.
- S. M. Blackman and V. Tangpricha, Pediatr. Clin. North Am., 2016, 63, 699–708 CrossRef PubMed.
- M. J. MacDonald, N. M. Hasan, I. U. Ansari, M. J. Longacre, M. A. Kendrick and S. W. Stoker, Diabetes, 2016, 65, 2051–2059 CrossRef CAS PubMed.
- D. Cieniawski, P. Miarka, E. Ignacak, A. Bętkowska-Prokop, M. Waluś-Miarka, B. Idzior-Waluś, M. Kuźniewski and W. Sułowicz, Transplant. Proc., 2016, 48, 1604–1607 CrossRef CAS PubMed.
- V. M. Monnier, W. Sun, X. Gao, D. R. Sell, P. A. Cleary, J. M. Lachin, S. Genuth and Research Group, DCCT/EDIC, Cardiovasc. Diabetol., 2015, 9, 138 CrossRef PubMed.
- X. Chen, G. Liu, W. Zhang, J. Zhang, Y. Yan, W. Dong, E. Liang, Y. Zhang and M. Zhang, Int. J. Biochem. Cell Biol., 2015, 69, 52–61 CrossRef CAS PubMed.
| This journal is © The Royal Society of Chemistry 2017 |