
Advancement of mass spectrometry-based proteomics technologies to explore triple negative breast cancer
Sayem
Miah
ab,
Charles A. S.
Banks
a,
Mark K.
Adams
a,
Laurence
Florens
a,
Kiven E.
Lukong
b and
Michael P.
Washburn
*ac
aStowers Institute for Medical Research, 1000 E. 50th St, Kansas City, MO 64110, USA. E-mail: mpw@stowers.org; Tel: +816-926-4457
bDepartment of Biochemistry, College of Medicine, University of Saskatchewan, Saskatoon, Saskatchewan S7N 5E5, Canada
cDepartments of Pathology & Laboratory Medicine, University of Kansas Medical Center, Kansas City, KS 66160, USA
First published on 15th November 2016
Abstract
Understanding the complexity of cancer biology requires extensive information about the cancer proteome over the course of the disease. The recent advances in mass spectrometry-based proteomics technologies have led to the accumulation of an incredible amount of such proteomic information. This information allows us to identify protein signatures or protein biomarkers, which can be used to improve cancer diagnosis, prognosis and treatment. For example, mass spectrometry-based proteomics has been used in breast cancer research for over two decades to elucidate protein function. Breast cancer is a heterogeneous group of diseases with distinct molecular features that are reflected in tumour characteristics and clinical outcomes. Compared with all other subtypes of breast cancer, triple-negative breast cancer is perhaps the most distinct in nature and heterogeneity. In this review, we provide an introductory overview of the application of advanced proteomic technologies to triple-negative breast cancer research.
Introduction
Breast cancer is arguably one of the most extensively studied cancers. Despite tremendous advancements in breast cancer research and treatment, it is still one of the leading causes of cancer-related deaths among women and a major health problem in the developed world. Over 1.7 million women are diagnosed with breast cancer annually, worldwide, representing about 12% of all new cancer cases and about 25% of all cancers in women, and over half a million women die of the disease each year.1 Although the overall breast cancer-related mortality rate has slightly declined, the American Cancer Society projects more than 246![[thin space (1/6-em)]](https://www.rsc.org/images/entities/char_2009.gif) 660 new cases of breast cancer with over 40450 deaths of American women each year.2 Additionally, while many patients are treated successfully, one third of breast cancer patients experience cancer metastasis or recurrence in their lifetime.3 Many of the differences in disease progression are because breast cancer is not a single disease but rather a heterogeneous group of diseases with distinct pathological, morphological, and molecular features with clinical outcomes depending on tumour characteristics. The further molecular characterization of each breast cancer subtype would enable us to develop subtype specific treatments with resulting increases in breast cancer survival rates.
660 new cases of breast cancer with over 40450 deaths of American women each year.2 Additionally, while many patients are treated successfully, one third of breast cancer patients experience cancer metastasis or recurrence in their lifetime.3 Many of the differences in disease progression are because breast cancer is not a single disease but rather a heterogeneous group of diseases with distinct pathological, morphological, and molecular features with clinical outcomes depending on tumour characteristics. The further molecular characterization of each breast cancer subtype would enable us to develop subtype specific treatments with resulting increases in breast cancer survival rates.
Breast cancer is caused by several factors including an accumulation of chromosomal aberrations of either genetic or environmental origin.4 These abnormalities range from DNA point mutations to chromosomal defects such as chromosomal instability, copy number variation, translocation, and epigenetic alteration.4 In recent decades genomic and transcriptomic technologies have led to the identification and characterization of several breast cancer-related genes. These include BRCA1,5 ErBB26 (also known as HER2), ESR17 (also known as ER) and protein kinases, such as ATM,8 that acquire driver mutations in certain human breast cancers.9 The advent of cDNA microarray technology and subsequently RNAseq has enabled us to look at global patterns of gene expression in breast cancer cells, which can be classified according to distinct molecular characteristics.10 However, gene expression patterns do not necessarily reflect proteome pattern of diseased cells. Cellular protein regulation is a dynamic process controlled by translation, post-translational modifications, protein stability and protein degradation.11 Characterisation of proteomes are now possible using MS-based quantitative proteomics, which are capable of sensitive protein identification and quantitation. We can examine the cancer proteomes that are responsible for functional cellular changes with high accuracy and supplement our understanding of genomic and transcriptomic changes to achieve a more sophisticated understanding of the molecular causes of different breast cancers.11
Proteomics technologies allow us to quantitatively examine large numbers of proteins in complex protein mixtures and to map post-translational protein modifications under different circumstances. Considering the heterogeneity and complexity of carcinogenesis, proteomics technologies provide suitable tools for investigating the complex network of protein interactions that cannot be examined using the classical one-gene-one-protein approach. Therefore, proteomics has emerged as an integral part of modern biomedicine. For example, proteomics tools have been used for both cancer diagnosis and therapy selection as well as for researching the underlying mechanisms of disease pathogenesis and progression.12–14 Specifically, one recent proteomic-based breast cancer study uncovered clinically distinct protein signatures for different histologically graded tumors.12 Another study developed a triple-negative breast cancer-specific protein profile13 and a study by Tyanova et al. characterised functional differences between different breast cancer subtypes.14
In this review, we present a comparative overview of the different labelled and label free quantitative proteomics techniques used to address various biological parameters. We will examine their effectiveness in elucidating the protein signatures in breast cancer subtypes and especially triple-negative breast cancer, and their overall impact on molecular breast cancer research.
Non-mass spectrometry-based proteomic platforms in cancer research
Proteomic studies are varied, but can be categorized based on whether or not MS is used in the analysis pipeline. While most MS-based proteomic studies allow us to examine protein mixtures without prior biological knowledge of the protein content,10 prior knowledge of the targeted protein is a prerequisite for non-MS based approaches. For instance, non-MS techniques such as Western blotting, enzyme-linked-immunosorbent assay (ELISA), immunohistochemistry (IHC), immunocytochemistry (ICC), and recently protein microarray (PMA) and tissue microarray (TMA) analyses, all require specific antibodies to examine target proteins. Many of these non-MS based technologies are very useful for addressing particular problems. For example, TMA analysis, a large-scale tissue protein analysis technique,15 has become one of the most popular proteomic approaches in cancer research. TMA can be used to simultaneously analyse millions of cylindrical sections of paraffin block tissue samples for the presence of a unique protein marker or for a set of proteins providing a ‘protein signature’. The IHC-based TMA analysis technique is reliable and cost effective, making it a potent tool in investigative pathology.10 However, the proteome coverage is limited by the availability of high quality, validated antibodies.Another non-MS based technique, the protein array, is a “bait and prey” protein based signal-detection technology analogous to the cDNA microarray.16 Typically 150–200 protein probes (for example specific antibodies) are immobilized on a solid surface for the quantification of their binding partners across thousands of samples, for example breast cancer samples16 and pan-cancer samples.11 A related technique called reverse phase protein array (RPPA), has been used with 3467 patient samples from 11 different cancer types, and has revealed that the expression of HER2 is less frequent in breast cancer than in serous endometrial cancer.11 This study also found that HER2 is expressed more frequently at higher levels in bladder, colorectal and lung cancers, a finding that had not been predicted by a study focused on levels of mRNA expression.11
Despite significant impacts on cancer research, both the availability of and the high cost associated with producing suitable antibodies limit the wide application of non-MS techniques. Additionally, cancer is often heterogeneous in nature, with differential expression of numerous proteins affecting many biological processes. Therefore, screening methods are warranted that interrogate entire human proteomes in an unbiased fashion, rather than just a few selected proteins. Among proteomics tools, MS has become one of the most versatile and useful instruments in cancer research. MS-based proteomic research has allowed the global analysis of proteomes, which has resulted in the discovery of new protein signatures for breast cancers,14 and better understanding of breast cancer development and progression.17 Recent advances in quantitative proteomics have moved beyond simple protein detection to reliable protein quantitation in different biological samples.18
Quantitative mass spectrometry-based proteomic strategies in cancer research
The rapid advancement of mass spectrometry-based technologies in terms of mass accuracy, sequencing speed, resolution, power, and cost effectiveness provides a unique opportunity to accurately and rapidly profile cancer proteomes.19 Powerful mass spectrometers such as the Q-TOF, TOF/TOF, Q-OT and Q-Exactive have high resolution, sensitivity, and sub-ppm mass accuracy, which make them well-suited for shotgun proteomics approaches aimed at quantifying hundreds to thousands of proteins in a biological sample.20,21Just a decade ago, gel-based mass spectrometry analysis was the technique of choice (and is still widely used today). However, gel-free shotgun proteomics technologies, which allow for high-throughput quantitative analysis of protein specimens in a non-targeted manner,22 now lead the way. In particular, multidimensional protein identification technology (MudPIT), a gel-free proteomic approach which couples multidimensional chromatography with mass spectrometry, enables us to sensitively quantitate and detect proteins.23 In shotgun proteomics, samples are lysed or homogenized and extracted proteins are enzymatically digested into peptides, typically with trypsin. The peptides are then separated by liquid chromatography (LC) and sprayed directly into the mass spectrometer using electrospray ionization. The heterogeneous mixture of ionised peptides is then analysed. They are separated based on their mass-to-charge (m/z) ratios, and populations of peptides with a particular value of m/z can then be isolated for further characterization in an MS/MS analysis. The peptides in this (now homogeneous) population are fragmented using resonance excitation in a radio frequency dynamic electric field (a process called collision-induced dissociation or CID). Product ions generate an MS/MS spectrum, characteristic of a particular peptide sequence.23 Using a variety of algorithms, the amino acid sequences of all peptides characterized in this way are determined from the MS/MS spectra. The peptide sequences are then used to infer and assemble a list of proteins that were present in the original sample.24 In the following section, we will briefly discuss and compare the different techniques for quantitating proteins identified in this way.
(i) Stable labelling approaches
To accurately quantify proteins, several unique stable labelling strategies have been developed. These strategies include enzymatic,25 chemical,26 and metabolic labelling.27 Each approach has particular strengths and weaknesses.28 All three approaches use stable isotopes, which are incorporated into proteins or peptides of different samples. The stable isotopes change the masses of similar peptide fragments in one sample compared with the other, with no other effect on the biophysical and chemical properties of the labelled peptides or proteins.29 These small mass differences in peptide fragments between “heavy” or “light” samples result in a shift in m/z values. Heavy and light samples are mixed prior to introduction into the mass spectrometer, thus labelled peptides will produce a doublet of m/z values. Relative protein abundances can be calculated based on characteristics such as the relative peak heights for the distinguishable m/z values.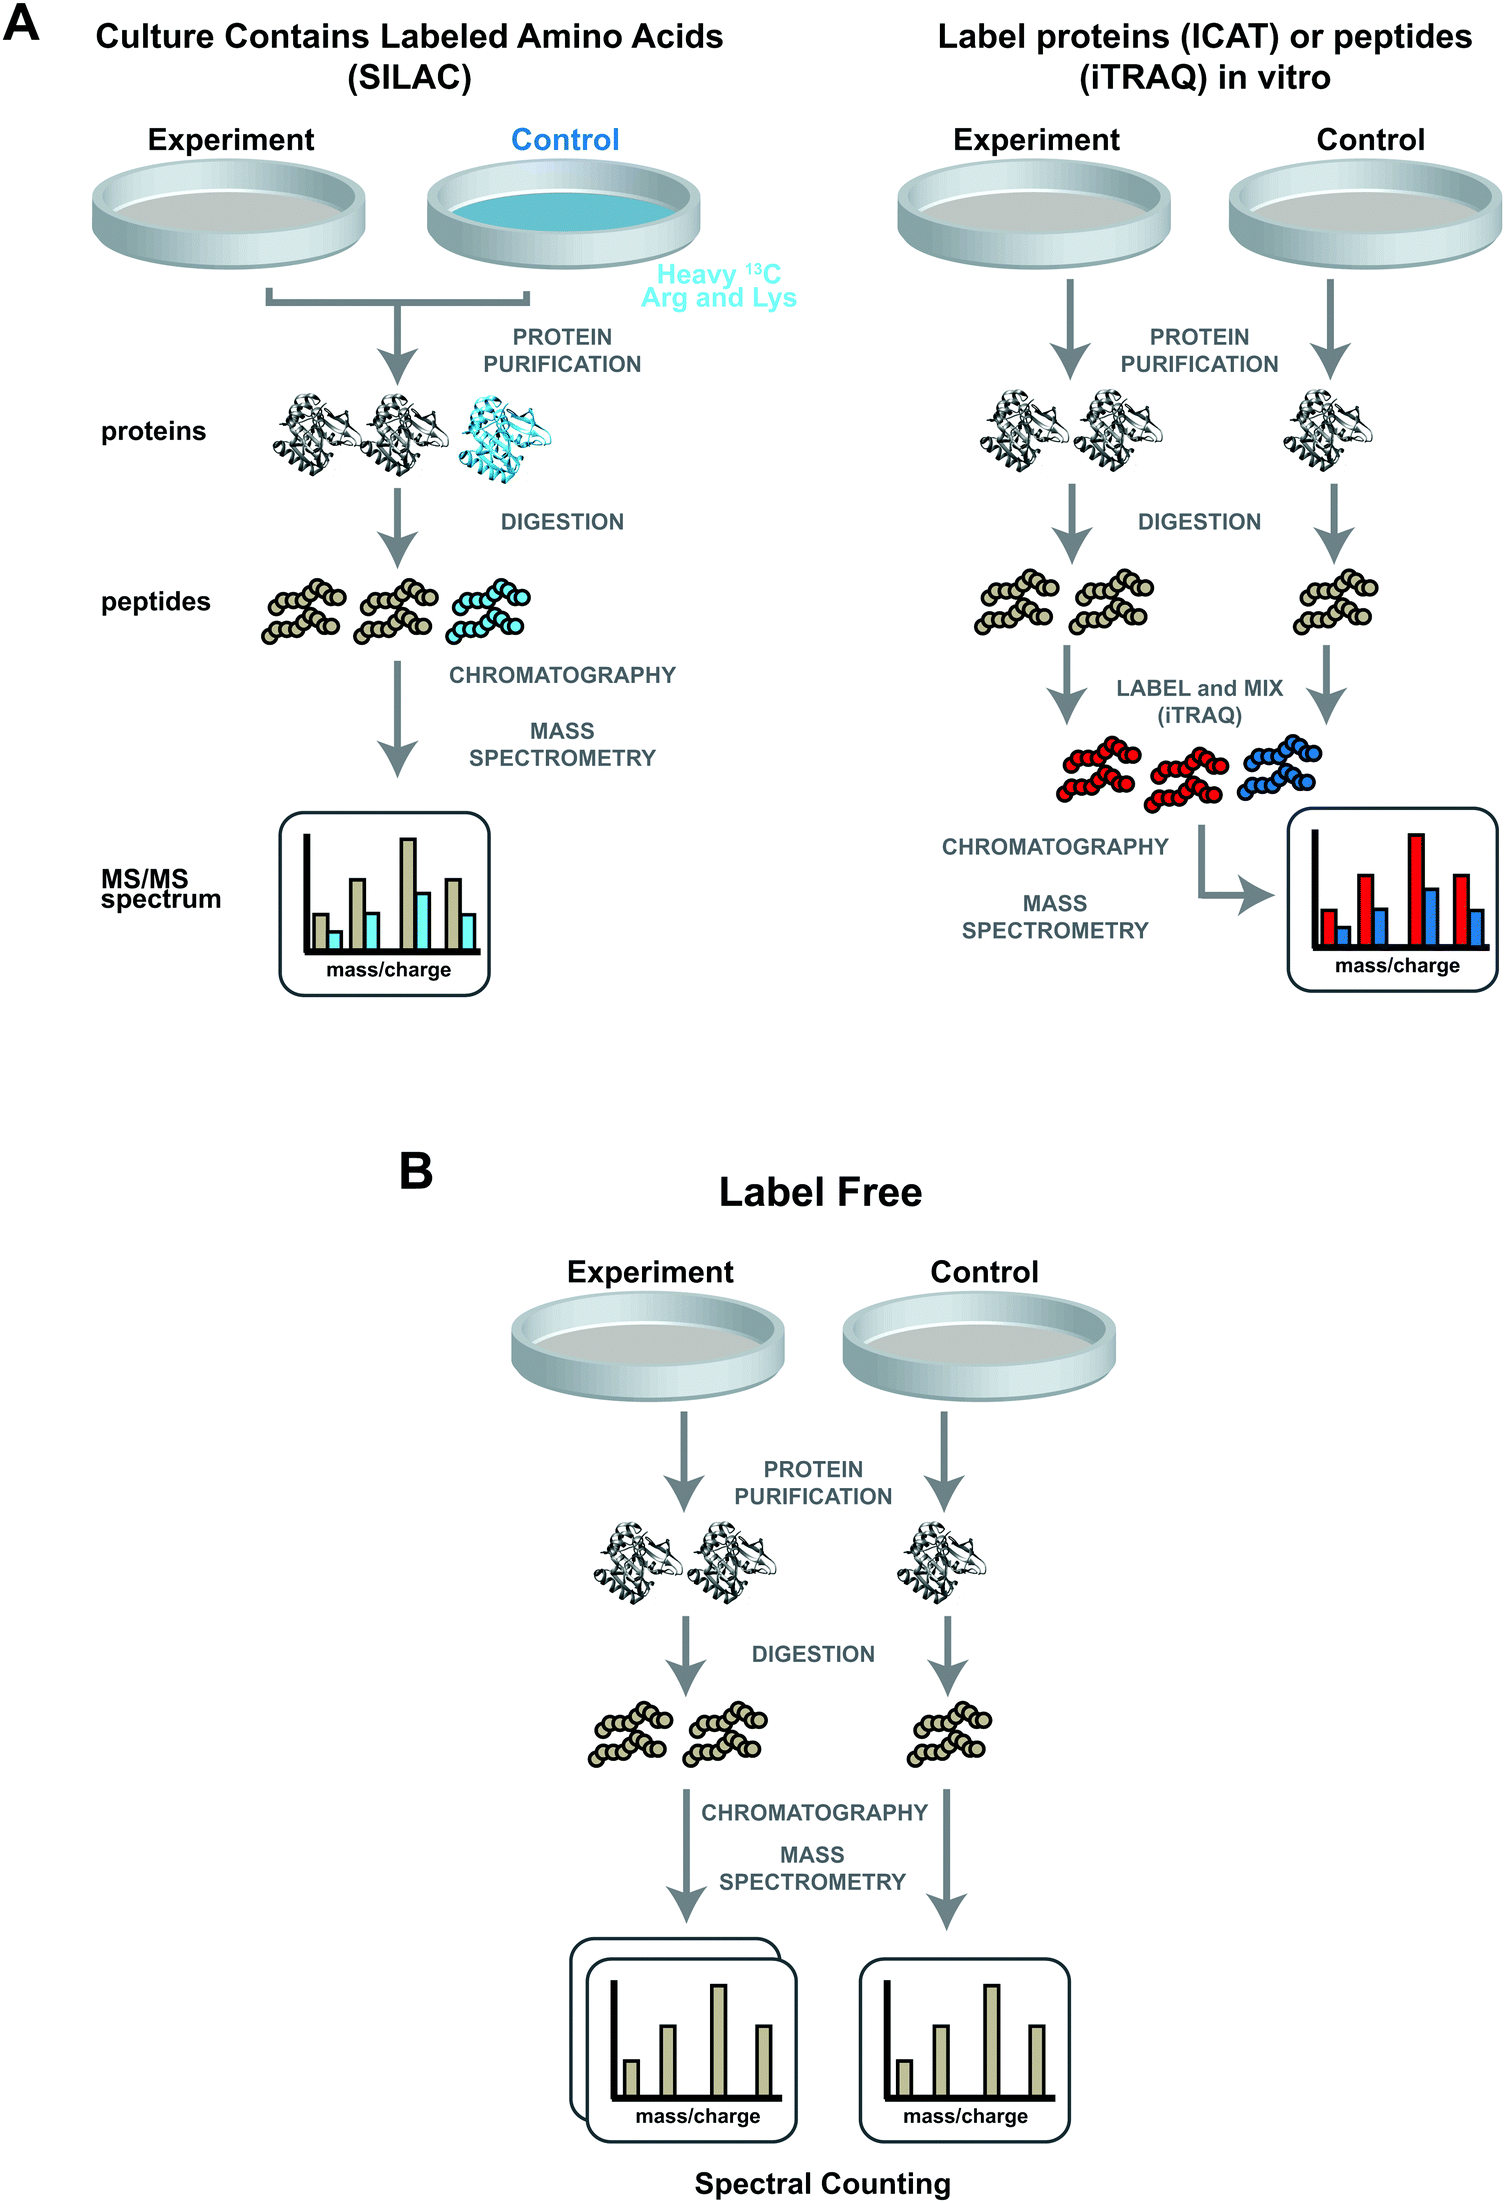 | ||
| Fig. 1 Quantitative proteomic analyses using either labelling or label free approaches. (A) Labelling two samples using either metabolic (left panel) or chemical (right panel) labelling. In metabolic labelling or SILAC, cells are cultured in medium containing either light or heavy amino acids (for example 12C or 13C containing arginine and lysine). Whole cell extracts can then be combined prior to an optional protein purification step. After protein digestion, peptides are chromatographically separated and sprayed into the mass spectrometer. Otherwise identical heavy (brown) and light (blue) peptides have similar chromatographic properties and coelute. The fragmentation patterns of such peptides can be distinguished in an MS/MS spectrum from the shift in mass/charge ratios (blue vs. brown spectral lines). The different characteristics of these two fragmentation patterns (for example relative peak height) allow quantitation. For chemical labelling, either the proteins purified from two samples (ICAT), or the peptides from the protein digest (ITRAQ), can be chemically labelled with suitable reagent (red and blue labelled peptides). These reagents do not change the chromatographic properties of the peptides but again result in a shift in fragmentation pattern in the MS/MS spectrum (red vs. blue spectral lines). (B) Label free quantitation. Peptides obtained from either “experiment” or “control” cells are analysed in separate mass spectrometry runs. For a particular peptide, the total number of MS/MS spectra generated during the mass spectrometry run is used for relative quantitation. | ||
Two similar isobaric chemical labelling strategies for relative and absolute quantification (iTRAQ and TMT) have become methods of choice. These reagents are designed for multiplex experiments; they can be used to differentially label multiple samples and so different time points and treatment conditions can be compared in the same experiment. In these methods, samples are proteolysed and the peptides are labelled separately with different isotopic variants of iTRAQ and TMT (Fig. 1A, right panel). The samples are then combined for quantitative mass spectrometry analysis to determine relative protein abundance.28 Isobaric labelling techniques deliver a wider multiplexing capacity and analytical throughput than other labelling strategies.47 For example, iTRAQ allows simultaneous comparison of eight samples47 and TMT can be used with up to 90 samples48 combined in a single LC-MS/MS analysis. The latest 12-Plex ‘DiLeu’ isobaric tags are cheaper as reagents can be readily synthesized in-house47 unlike other members in these strategies. Both iTRAQ and TMT strategies have been broadly employed in cancer studies for drug discovery,49 investigating cancer signaling,50 as well as for investigating diagnostic and prognosis markers.51 iTRAQ has also been employed to predict cancer recurrence and patient survival in triple negative breast tissue samples.52 Although these approaches have shown merit, they are less accurate and sensitive compared with SILAC, as the tag is added at a later stage of the procedure, resulting in lower proteome coverage.53
(ii) Label-free quantitative proteomics
Unlike other shotgun strategies, with label-free proteomics approaches, protein samples are typically digested into peptides and analysed by mass spectrometry without adding any stable isotopic or chemical labels28 (Fig. 1B). Instead of mixing two labelled samples prior to a single mass spectrometry run, two unlabelled samples are analysed using separate chromatography/mass spectrometry runs. Using the MudPIT technique, peptides are resolved using multidimensional chromatography and electrosprayed directly for analysis by tandem mass spectrometry. The resulting product-ion mass spectra (MS/MS spectra), are used to identify the selected peptide and hence the original protein.54 A typical MudPIT run takes about 20 hours of mass spectrometer time and generates about 200000 MS/MS spectra, each one corresponding to a short peptide sequence. Various characteristics of the spectra can be used to estimate relative peptide abundance from run to run, and hence relative protein abundance from sample to sample. Quantitation methods include MS/MS spectral counting,55,56 and MS peak area measurement.57 Each of these methods uses a single parameter to estimate protein abundance, thereby limiting the accuracy of the quantitation. The normalised spectral index (SIN) strategy, which combines several measured parameters, was developed to try to improve quantitation accuracy. This strategy combines the spectral count (number of MS/MS spectra per peptide), the unique peptide number, and the fragment-ion (MS/MS) intensities to obtain accurate protein quantification.58 Another approach is to calculate the normalised spectral abundance factor (NSAF)59 and distributed NSAF (dNSAF)60 to obtain more accurate protein quantification. In brief, the spectral abundance factor (SAF) for a particular protein is the number of MS/MS spectra for the protein divided by the length of the protein. To account for run-to-run variation, SAF values are divided by the sum of all SAF values in the sample (NSAF). A further refinement to the calculation distributes peptides shared by multiple proteins based on the number of unique peptides assigned to a protein. Label free analysis has also benefitted from improved software (such as MaxQuant,61 Skyline62) and improved search capabilities (ultra-tolerant database54) for accurate identification and precise quantification.
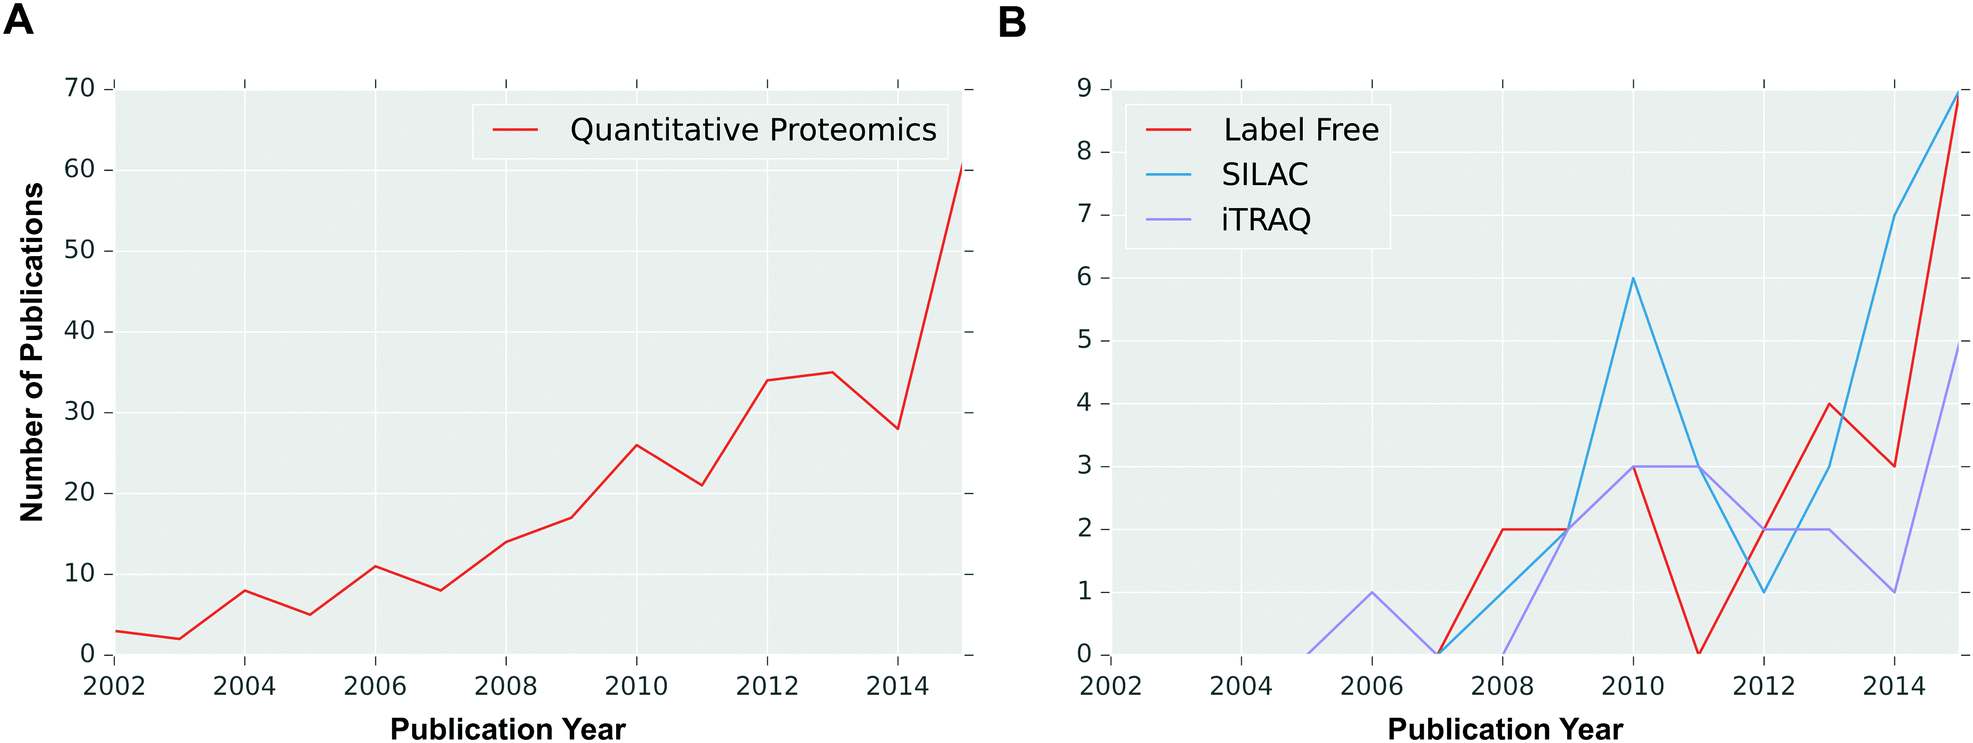 | ||
| Fig. 2 Number of breast cancer-related quantitative proteomics publications per year. An Entrez text query of PubMed was performed with the phrases (A) ‘breast cancer quantitative proteomics’ (quantitative proteomics), and (B) ‘breast cancer label free quantitative proteomics’ (label free), ‘breast cancer SILAC quantitative proteomics’ (SILAC), or ‘breast cancer iTRAQ quantitative proteomics’ (iTRAQ). | ||
Over the last few decades, the technical progression of label-free quantitative approaches has made label free quantitative proteomics strategies powerful approaches in cancer research, with constant improvements both in LC-MS equipment and in software for data analysis.63 Label-free quantitation allows simultaneous identification and quantification of proteins, without the need for tedious and expensive labelling process, and can be used with samples from any sources.28 As each sample of interest is prepared and analysed separately by LC-MS/MS, samples can be compared in different ways in different analyses.64 As a result, there is no limit to the number of samples which can be compared and higher proteome coverage can be attained as there is no mixing of samples in the experiment. Label-free quantification methods offer high analytical depth, dynamic range and modest quantitative precision well suited for observing large global protein expression changes. Therefore, label-free proteomics approaches have become the methods of choice (Fig. 2) for biomarker discovery and clinical proteomics.65 Label-free approaches are sometimes described as “semiquantitative” because of poor quantitative accuracy for low abundant protein samples.28 However, in recent years a number of strategies have been introduced to enhance proteome coverage, precision and accuracy in protein identification and quantification. For example, Liu et al. reported a pipeline for label-free quantitative proteomics which showed great reproducibility and precise and accurate quantification of thousands of peptides and proteins in their laser captured microdissection (LCM) driven breast tissue samples.18 Furthermore, the same research group recently demonstrated that a label-free quantification approach outperformed stable labelling strategy (SILAC) in terms of dynamic range and proteome coverage of LCM tissue samples,65 further highlighting the potential applications of label-free proteomics in routine clinical applications for cancer treatment, for example breast cancer.
The landscape of breast cancer
Breast cancer tumours
Breast cancer is a highly heterogeneous group of cancers, with diversity in its morphology, molecular genetics, biology, and clinical outcome. Adenocarcinoma is a cancer of the epithelium that originates in glandular tissue and most breast cancers start as adenocarcinoma. Adenocarcinoma progresses into ductal carcinoma in situ (DCIS), also arising from the ductal epithelium, or lobular carcinoma in situ (LCIS), which originates from the epithelium of the lobules. The most common kind of breast cancer, invasive ductal carcinoma (IDC) also called infiltrating ductal carcinoma, and infiltrating lobular carcinoma (ILC), grows from DCIS and LCIS respectively.66 The invasive tumour cells metastasize preferentially to the bones, lungs and brain (Fig. 3).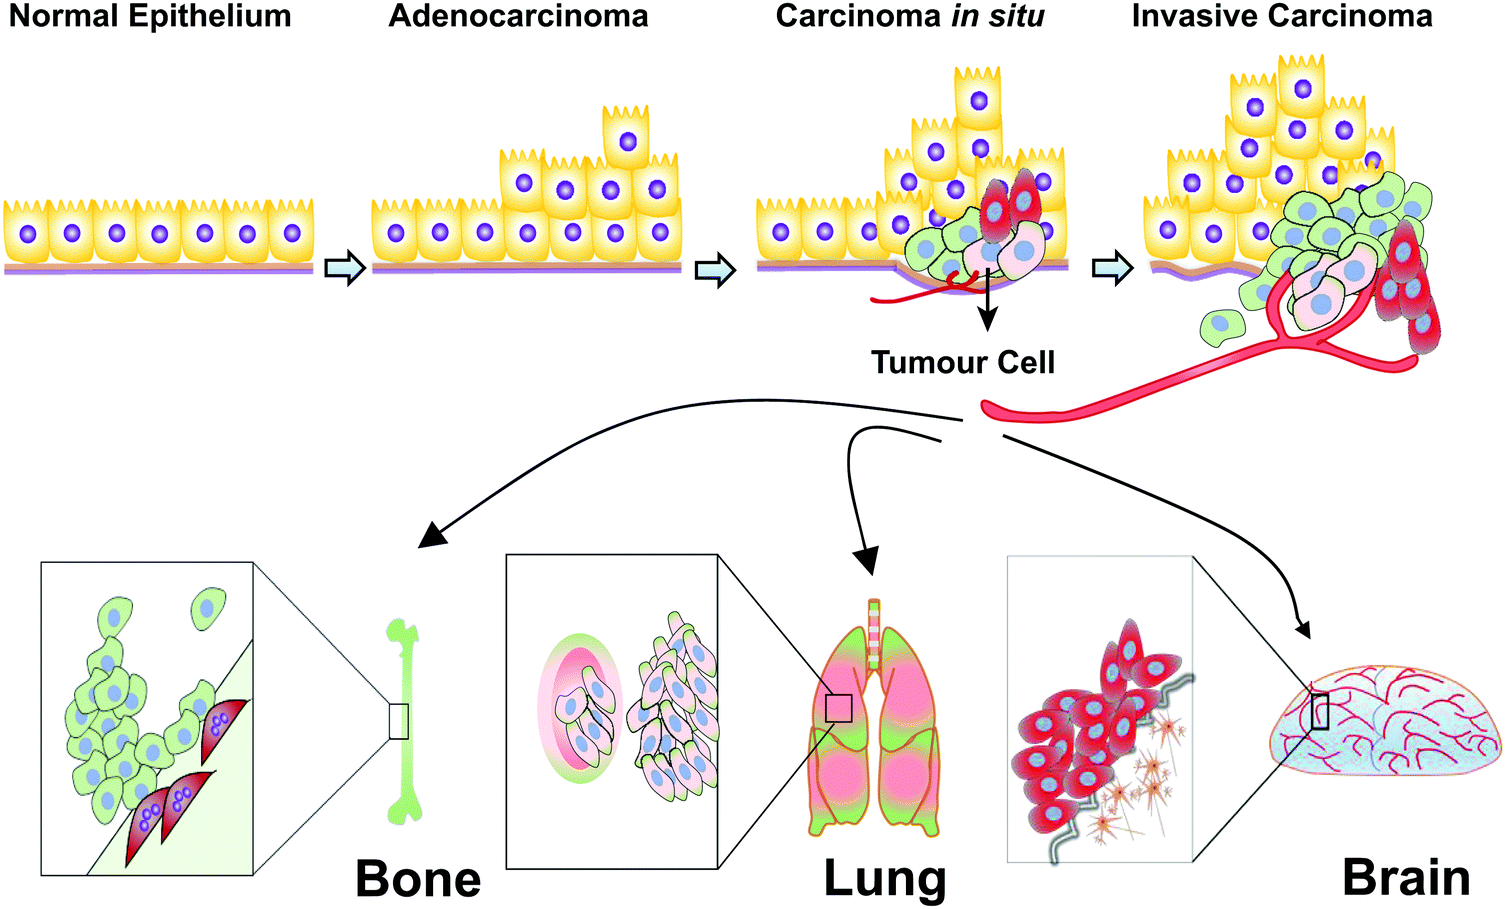 | ||
| Fig. 3 Progression of human breast cancer. Normal epithelium of glandular tissues alters into malignant adenocarcinomas, then becomes tumorigenic (carcinoma in situ) and subsequently develops into invasive carcinomas. Preferential metastatic sites of breast malignant tumour cells are to the bones and lungs. Triple negative breast cancer cells have tendency to metastasize to the brain. | ||
The biology of breast tumours remains poorly understood, although several measures have been undertaken to distinguish tumour features according to tumour grade, stage, and gene profile. Grading is based on the microscopic structure of the tumour and scaled from 1–3, from the least aggressive in appearance to the most aggressive. The stages are classified from non-invasive Stage 0 to the highly metastatic Stage IV, based on measurements of the tumour, lymph node involvement, and the metastatic spread.67
Molecular classification of breast cancer subtypes
Traditionally four different breast cancer subtypes have been identified based on expression of three molecules: oestrogen receptors (ER), progesterone receptor (PR), and human epidermal growth factor receptor 2 (HER2). One of these subtypes, triple-negative breast cancer (TNBC), is characterised by the absence of all three receptors. Recent studies have aimed to develop a more sophisticated understanding of different breast cancer subtypes based on global gene expression patterns. For example, in 2000 Perou et al. examined dozens of breast tumours and analysed both global patterns of gene expression and gene copy number variation. Their analyses defined several novel molecular classes of breast cancer based on these global characteristics, termed “intrinsic subtypes”.66 Subsequent studies supported their findings and found additional breast cancer subclasses.11,67 Breast cancer subtypes can be classified according to their molecular features (Table 1) as: (1) basal-like (triple-negative), (2) luminal A, (3) luminal B, and (4) HER2-positive, and additionally normal-like and claudin-low.70 Most, but not all, basal-like tumours are triple-negative breast cancers. A recent large scale genomic-transcriptomic integrated study re-clustered the current subtypes into 10 different molecular breast cancer subtypes.71 However, these subtype classifications have not yet been used in clinical practice.14| Basal-like (triple-negative) | Luminal A | Luminal B | HER2-positive | Normal breast-like | Claudin-low | |
|---|---|---|---|---|---|---|
| Gene expression | ER−, PR−, HER2−, and BRCA1 mutations. Cytokeratin 5, 6, 14 & 17 | High ER+ and PR+ HER2− | Low ER+ and PR+ HER2+ | HER2+ GRB7+ | Cytokeratin 5−, 6− and 8+, 18+ | Low expression of claudin and E-cadherin and high expression of vimentin, snail, TWIST and ZEB |
| Histological grade | Histological high grade and highly metastatic | Histological low grade and less metastatic | Histological low grade and less metastatic | Histological high grade and very aggressive | High metastatic potential |
The luminal subtypes (luminal A and luminal B) that make up hormone receptor expressing breast cancers represent about 70% of tumours. Luminal subtypes express luminal cytokeratins 8/18, oestrogen receptors (ER) and genes associated with ER activation such as LIV1 and Cyclin D1.75 The basal-like tumours are usually ER-, PR- and HER2-negative and are also associated with germ-line BRCA1 mutations, one of the most important forms of the hereditary breast cancer.16
HER2-positive breast cancers are characterised by high expression of HER2, usually as a result of amplification of the 17q12q21 locus that contains the HER2 gene. Unlike other breast tumours, basal-like and HER2 tumours have a higher proportion (84%) of TP53 mutations.16 The normal breast-like subtype has been poorly characterised, has gene expression patterns similar to adipose tissues, and is usually non-responsive to neoadjuvant chemotherapy.76 Luminal A tumours have the longest survival times, luminal B tumours have intermediate survival times, whereas the basal-like and HER2 positive subtypes display the shortest survival times. Luminal A and B subtypes possess low and intermediate metastatic properties respectively, while the basal-like and HER2 positive subtypes are highly aggressive tumours that express low levels of E-cadherin and the tight junction protein claudin 3.69 These aggressive tumours also have a low expression of luminal markers and a high expression of mesenchymal markers, which are associated with poor prognosis. Claudin-low tumours have EMT (epithelial-to-mesenchymal transition) characteristics with tumour initiating cell features, and exhibit stem cell-associated biological processes.77 All of these features are associated with higher metastatic potential.
Our current understanding of breast cancer biology is more comprehensive than ever. Various molecular subtypes of breast cancer have been elucidated using genomic profiling strategies and other major technological discoveries, opening new windows into breast cancer treatment and research. However, the basal-like (triple negative) subtype, the most distinct among all the intrinsic subtypes in breast cancer, has not been well characterised.78 Additionally, a genomic study revealed that the basal-like (triple negative) breast cancer subtype is not only distinct among other breast cancer subtypes, but also among other cancer types.79
Triple-negative breast cancer (TNBC)
Although breast cancers originate from a common tissue, they display considerable heterogeneity. Different breast cancer subtypes have distinct biological, morphological, histological and molecular features, and display different responses to therapy. In particular, TNBC, a group of the most diverse breast cancers, is posing a major challenge for viable clinical decision making.13 TNBC tumours are generally higher grade with distinct metastatic patterns and have more aggressive clinical behaviours than other breast tumours.80 It is estimated that TNBC accounts for ∼10–20% of invasive breast cancers, with approximately 170000 cases yearly worldwide.81
TNBC is heterogeneous and the lack of well-defined molecular targets remains a huge clinical challenge. It is often seen in younger and premenopausal women and more frequently in African-American women.70 TNBC tumours have a weak association between tumour grade and lymph node metastasis. They preferentially metastasize to the brain and have a higher recurrence potential and often worse prognosis than other breast cancer subtypes.82 Several studies consistently reported that TNBC patients showed a stronger response to chemotherapy than non-TNBC patients despite a lack of known targetable biomarkers.83 Additionally, they respond better to combination chemotherapies than to single agents. However, this comes at the expense of increased chemotherapeutic toxicity and has no impact on patient survival.84 In fact, less than 30% of women with metastatic breast cancer will survive five years after initial diagnosis despite systematic chemotherapy and virtually all metastatic TNBC patients eventually die of this disease.85 To overcome this TNBC paradox, there is an urgent need to further sub-classify this aggressive cancer subtype to help in the development of more targeted patient treatments with better clinical outcomes.
Genomic and transcriptomic characterization of TNBC
To date, significant progress has been made on molecular subtyping of breast cancer by global gene expression analysis.68 Recently, The Cancer Genome Atlas (TCGA) Program joined in this effort and established a comprehensive molecular subtype of breast cancer through mRNA, miRNA, DNA, epigenetics and reverse phase protein arrays.16 In this study, they reported 80% of basal-like breast cancers were triple negative breast cancers, traditionally defined by gene expression profile or cytokeratin expression.16 Several other studies also showed significant progress in subtyping TNBC. An aggregate analysis of publicly available gene expression datasets performed by Lehmann and colleagues revealed TNBCs are more complex and heterogeneous in nature than currently acknowledged and further classified TNBC into six subtypes:86 (1) basal-like-1 (BL1); (2) basal-like-2 (BL2); (3) immunomodulatory (IM); (4) claudin-low-enriched mesenchymal (M); (5) mesenchymal stem-like (MSL); and (6) luminal androgen receptor positive (LAR). However, a subsequent study reported basal-like-1 & 2 were indistinguishable and that these six subtypes could be categorized in three major groups. They are, namely mesenchymal, basal-like and LAR, which is highly concordant with the previously identified three main groups termed claudin-low, basal-like and luminal/HER2E.87In addition, several other groups implementing multiple methods have also appeared to re-delineate the sub-classification of TNBC. A comprehensive transcriptome study identified four distinct subclasses of TNBC based on the integrated expression profile of mRNA and lncRNA (IM, LAR, a mesenchymal-like subtype (MES) and a basal-like and immune suppressed (BLIS) subtype).88 Additionally, Burstein and colleagues also identified and confirmed four molecular subtypes of TNBCs and putative specific targets of those subtypes through a comprehensive genomic study.89 These four subtypes of TNBC (AR, LAR, MES, BLIS and BLIA) have the following corresponding targets: androgen receptor and the cell surface protein mucin, MUC1 (AR; LAR), PDGFRA and c-Kit specific target for MES, an immunosuppressing molecule termed VTCN1 for basal-like immunosuppressed (BLIS), and cytokines as well as STAT signal transduction molecules (BLIA) TNBC.89 Moreover, Burstein and colleagues also indicated that their attempt to reproduce the 6 subtypes of Lehmann and colleagues was unsuccessful.89 In addition, a higher frequency of protein abundance than projected by mRNA and DNA levels has been reported in colorectal cancer, bladder urothelial carcinoma and lung adenocarcinoma.11 In a cohort of 26 lung cancer cell samples, seven showed high HER2 protein expression whereas only two cell samples demonstrated elevated levels of HER2 mRNA,90 suggesting that high protein abundance might not directly result from high mRNA level in cells.11 In such cases, proteomics platforms might be useful for determining the predictive, prognostic and therapeutic implication of functional proteomes (Table 2).
| Author | Sample type | Mass spectrometry | Quantitation method | Identified protein | Potential clinical use | |||
|---|---|---|---|---|---|---|---|---|
| Upregulated or phosphorylated | Down-regulated or dephosphorylated | Bio/prognostic marker | Drug target | |||||
| Liu et al. (2014)97 | Tissue | nLC-MS/MS | Label free | CMPK1, AIFM1, FTH1, EML4, GANAB, CTNNA1, AP1G1, STX12, AP1M1, CAPZB | MTHFD1 | Yes | — | |
| Liu et al. (2014)100 | Tissue | nLC-MS/MS | Label free | FTH1 | — | — | Yes | |
| Campone et al. (2015)101 | Tissue | MALDI-MS/MS | iTRAQ labelling | DP, TPS1, TrpRS | — | Yes | Yes | |
| Maurizio et al. (2016)103 | Cell lines | LC-MS/MS | Label free | KIFC1, LRRC59, TRIP13 | — | Yes | Yes | |
| Sun et al. (2011)104 | Cell lines | LC-MS/MS | Dimethyl labeling | — | PTPN12 | |||
| Cabezon et al. (2012)105 | Tissue and serum | 2D-MALDI- MS/MS | Label free | Mage-A4 | — | — | Yes | |
| Song et al. (2016)107 | Serum | MALDI- MS/MS | Label free | apoC-I | — | Yes | — | |
| He et al. (2011)108 | Tissue | LC-MS/MS | Label free | HSP70kDa-8, periostin, RhoA, actinin alpha 4, cathepsin D, preproprotein, annexin 1, ALDH1A1, G3BP |
Thymosinβ4, transketolase, transferrin | Yes | Yes | |
| Semaan et al. (2011)109 | Tissue | LC-LTQ/FT-ICR MS | Label free | TRIM28, HSP90-alpha, hnRNP A1, CLTC, and myosin-9, HDGF | HSP90, AB1, PTRF1, AHNAK, SEPT2 | — | Yes | |
| Tyanova et al. (2016)16 | Cell lines | LC-MS/MS | Super-SILAC labelling | MCM5, STMN1, GLS, RCL1, C9ORF114, ENO1 | AGR2, MLPH, HID1, CMBL, FOXA1106 | Yes | — | |
| Wu et al. (2015)111 | Cell lines | LC-MS/MS | SILAC labeling | AXL | — | Yes | Yes | |
| Corrêa et al. (2016)106 | Tissue and serum | nLC-MS/MS | Label free | IRX1 | — | Yes | Yes | |
| Suman et al. (2016)102 | Tissue and serum | iTRAQ labeling | A2M | C4BPA | Yes | — | ||
Proteomic characterisation of TNBC
Proteomics studies that focus on characterizing the entire proteome of specific cells or tissues, provide complementary information to genomic and transcriptomic-centred breast cancer studies.91 Proteins are intrinsically more complex, dynamic, and more closely reflect biological function than genes. Shortfalls in the capacity of bioinformatics to predict the presence and function of gene products have also exemplified the requirement for protein analysis.91 It is estimated that in humans, between 500000–1000000 protein isoforms10 are encoded by only about 20000 protein coding genes.92 A single gene can encode many distinct proteins because a single pre-mRNA transcript can be spliced to generate different protein isoforms and because proteins can be modified after translation in different ways (modifications referred to as posttranslational modifications or PTMs). The advent of modern proteomics technologies has allowed us to investigate protein abundance, protein–protein interactions, PTMs, and ultimately protein function.
A proteomics-based analysis by Kennedy et al. quantitatively characterised 319 proteins that showed differential expression levels across 30 different human breast cancer cell lines.93 This proteomics data was used to successfully delineate molecular subtypes of breast cancer and identified 118 proteins that were differentially expressed in cells from basal-like vs. luminal cancers. Of these 118 proteins, a further analysis found that 30 proteins had corresponding genomic data, however the levels of only 10 of these proteins exhibited significant concordance with mRNA levels.93 In another study, Liu et al. used a label free proteomic approach to examine 126 frozen TNBC primary tumours samples split into training and testing sets and identified a signature of 11 proteins linked with clinical outcome (CMPK1, AIFM1, FTH1, EML4, GANAB, CTNNA1, AP1G1, STX12, AP1M1, CAPZB and MTHFD1). The expression pattern of those signature proteins identified from the training set of samples could be used to predict clinical outcome in TNBC in the testing set of TNBC with high sensitivity and specificity. Of these 11 proteins, 10 were up-regulated (MTHFD1 was down-regulated) in patients with a good prognosis.94 Three of the up-regulated proteins were involved in immunomodulation and apoptosis pathways, while MTHFD1, associated with poor prognosis, is involved in nucleotide and noncoding RNA metabolism. Liu et al. showed that over 60% of the TNBC patients who received adjuvant chemotherapy using the conventional St. Gallen95 and NIH96 criteria were unnecessarily treated based on the 11-proteins signature defined in this study. A subsequent proteomics study97 further validated that FTH1, an immunomodulatory molecule involved in augmentation of CD8 + T cells in the tumour area, is a potential therapeutic target in TNBC.
The first global deep proteomic analysis of TNBC molecular features identified 12000 distinct proteins whose expression patterns could discriminate between TNBC subtypes. This study also elucidated TNBC-specific signalling pathways involved in metastasis, adhesion and angiogenesis.13 Different expression signatures for three proteins desmoplakin (DP), thrombospondin-1 (TPS1) and tryptophanyl-tRNA synthase (TrpRS) were discovered for relapse and non-relapse TBNC tumours using an iTRAQ labelling based proteomic approach.98 Overexpression of DP in luminal breast cells99 and the metastatic and proangiogenic activity of TPS1100 in breast cancer cells had been previously reported. The role of TrpRS in synthesis and translation of proteins as well as angiogenic signalling was also previously reported.101 Overexpression of DP and TPS1 significantly altered the disease free survival and enhanced the risk of recurrence of TNBC patients. However, it was also reported that overexpression of TrpRS was associated with better disease free patient survival and lower risk of recurrence.98 Another iTRAQ labelling based proteomics study identified several factors which have strong associations with molecular subtypes of breast cancer (fibronectin, alpha-2-macroglobulin (A2M), complement component-4-binding protein alpha (C4BPA) and complement factor-B). One of these factors, the antiprotease A2M, is a large plasma protein that is genetically altered and differentially expressed in plasma and tissue samples from TNBC patients.102
Label-free proteomics strategies have been used extensively in breast cancer research. A label-free shotgun proteomic approach revealed a signature of 21 proteins in a High Mobility Group A1 (HMG1) silenced TNBC cell line which was associated with poor prognosis.103 A unique HMG1-linked sub protein signature of three proteins – kinesin family member C1(KIFC1); thyroid hormone receptor interacting protein 13 (TRIP13); and leucine-rich repeat containing 59 (LRRC59) – was unexplored in TNBCs. KIFC1, TRIP13, and LRRC59 proteins are downstream targets of HMG1 and involved in cell motility.103 Another label-based proteomics study reported that PTPN12, a tyrosine phosphatase, inhibited cellular transformation and metastasis of TNBC cells.104 A systematic 2D gel-based proteomic study of TNBC tissue biopsies uncovered Mage-A4,105 a family member of Mage-A, as a unique biomarker for TNBC and HER2 patients. Additionally, a label-free proteomic study identified Iroquois homeobox protein 1 (IRX1), which is involved in metanephric nephron development, as a potential plasma biomarker for TNBC.106 Recently Song et al. identified apolipoprotein C-I in their MALDI-TOF based TNBC patient serum sample study which could readily discriminate TNBC from non-TNBC tumors.107
Another label free proteomic study of TNBC reported a protein signature of 30 proteins associated with drug resistance and poor patient survival.108 Amongst these proteins, HSP70kDa-8, periostin, RhoA, actinin alpha 4, cathepsin D, preproprotein, and annexin 1 were highly expressed in TNBC tumours resistant to neoadjuvant chemotherapy. This study also identified ALDH1A1, complement component 1 inhibitor and G3BP as proteins associated with TNBC subtypes. G3BP (also known as 90 kDa Mac-2-binding protein) is a member of the beta-galactoside-binding protein family, whose association with TNBC was previously unreported. A systematic phosphoproteomic analysis of TNBC tissue uncovered 6 proteins in TNBC tumours and 5 completely different proteins at TNBC metastatic sites which were highly phosphorylated,109 suggesting that targeted dephosphorylation of these proteins may eliminate cancer progression as well as the metastatic potential of TNBC cells.
In 2010, Geiger et al. developed a SILAC-based technique aimed at quantitatively analysing proteins in human tissues. In brief, their technique (super-SILAC) compared unlabelled proteins in cells from tumour samples with metabolically labelled proteins from a panel of breast cancer cell lines cultured in media containing heavy lysine and arginine.110 This super-SILAC based quantitative proteomic strategy was later used to conduct a global protein profiling of clinical breast cancer samples and describe the specific protein profiles of breast cancer subtypes.14 In agreement with others,16 this study observed that the down-regulation of PTEN in TNBC tumours resulted in higher activity of cell survival PI3K pathways. They found that TNBC had higher levels of six positive markers (MCM5, STMN1, GLS, RCL1, C9ORF114 and ENO1) and lower levels of five negative markers (AGR2, MLPH, HID1, CMBL and, FOXA1). Of the six positive markers, four (MCM5, STMN1, RCL1 and C9ORF114) were associated with high cell proliferation rates of TNBC tumours. The other two positive markers, GLS and ENO1, function in glycolysis and glutaminolysis, consistent with the unique metabolism of TNBC compared with other breast cancer subtypes. Additionally another study also identified ENO1 as a potential biomarker of TNBC.111 Interestingly, most of the TNBC protein markers are regulated not at the genomic level but at the protein level14, suggesting the urgency of developing proteomic approaches for disease research.
It is important to investigate normal and cancer signalling networks to understand cancer biology and develop therapeutic interventions. Several studies have reported that different major signalling networks are activated specifically in TNBC.14,109,112 Phosphorylation of HMGA1 turned on the IL4-mediated signalling pathway and enhanced the metastatic potential of TNBC tumors.109PTEN, a negative regulator of PI3K signalling, is commonly lost in TNBC cells resulting in constitutive activation of the PI3K pathway. However substantial changes in key components of this pathway (such as AKT and PI3K) were not observed in breast cancer subtypes,14 consistent with the particularly aggressive nature of TNBC. Wu et al. used a SILAC based quantitative phosphoproteomic approach to assess tyrosine kinase activity in TNBC and discovered multiple activated kinase signalling pathways.112 Their phosphoproteomic analysis showed that AXL, a receptor tyrosine kinase, was highly phosphorylated in TNBC. Upon activation (phosphorylation) AXL dimerized with the receptor MET, resulting in activation of downstream signalling pathways (PI3K-AKT and FAK-SRC), augmenting cell proliferation and migration in TNBC.
Taken together, these studies illustrate the importance of proteomics-based studies and stress the need for a precise proteomic signature for understanding the complexity of TNBC in particular. A well-defined molecular signature can guide systematic therapeutic approaches to target breast cancer. Quantitative functional proteomic strategies have become indispensable in this quest for characteristic protein–protein interaction networks and precise protein signatures. These can be used to identify key TNBC regulators so that we can develop predictive, diagnostic and therapeutic applications. For example, a proteomics approach may reveal protein phosphorylation events in metastatic cells that are absent in primary tumour cells. Targeted dephosphorylation of these phosphorylation sites could potentially inhibit cancer cell metastasis. In addition, the combinatorial approach of genomics, transcriptomics and proteomics can better elucidate the biological processes that result in TNBC, so that we can overcome the current barriers in the clinical treatment of breast cancer.
Conclusion and perspective
Although the ‘one-gene, one-function’ dogma is a conceptually appealing theory, it is an over simplification of the gene regulation process. Alternative pre-mRNA splicing and post-translational modification of gene products are also a part of the molecular process of protein production that account for approximately 500000–1000000 proteins in humans. In addition, simple targeted single molecule studies do not reflect the complexity of biological processes. Complexity and heterogeneity are an intrinsic feature of TNBC, and large-scale approaches such as proteomics can be used to decipher the global picture of TNBC cancer biology.
It has been reported that up to 30% of proteomes can potentially be phosphorylated by protein kinases.113 Deregulation of the phosphorylation process may alter cell function and result in a disease state.114,115 Thus, protein kinases have emerged as major targets of drug discovery. In fact, approximately one-third of the current validated drugs in the pharmaceutical armoury that are used to treat cancer are based on kinase inhibition.116,117 The pathogenesis of TNBC may depend on the degree of deregulated phosphorylation of those protein kinases, which is mostly unknown phospho-proteomic profiling of those protein kinases in TNBC could potentially reveal aetiology and new druggable targets for treating TNBC.
Proteomics approaches have become powerful investigative tools because of their high sensitivity, accuracy, reproducibility and throughput in biomedical research. Both label-free and isobaric labelling MS based proteomics approaches allow global profiling of thousands of proteins across biological conditions and have been used to uncover potential protein biomarkers including cancer specific PTMs and proteins in key signalling pathways. The topological organization of signalling networks can be deciphered through proteomics, providing information that it is important for clinical decision-making.
Although advanced proteomics techniques have become accepted tools in cancer research, very few comprehensive studies have been undertaken to address TNBC. The treatment of TNBC remains a challenge, with poor patient outcomes and few therapeutic targets. A better understanding of the carcinogenesis of TNBC is a prerequisite for more sophisticated TNBC subtyping and for developing tailored treatment options. The power of proteomics can be used to decode the complexity of TNBC, unveil precise subtype-specific TNBC protein signatures, and ultimately develop more effective clinical interventions.
Conflict of interest
The authors declare that they have no conflict of interest.Acknowledgements
This work was supported by the Stowers Institute for Medical Research and by and the National Institute of General Medical Sciences of the National Institutes of Health under Award Number RO1GM112639 to MPW. KEL's research is funded by grants from the Canadian Breast Cancer Foundation (CBCF).References
- O. Ginsburg and R. Love, Breast J., 2011, 17, 289–295 CrossRef PubMed.
- K. D. Miller, R. L. Siegel, C. C. Lin, A. B. Mariotto, J. L. Kramer, J. H. Rowland, K. D. Stein, R. Alteri and A. Jemal, Ca-Cancer J. Clin., 2016, 66, 271–289 CrossRef PubMed.
- X. J. Qin and B. X. Ling, Oncol. Lett., 2012, 3, 735–743 CAS.
- R. M. Sallam, Dis. Markers, 2015, 2015, 321370 Search PubMed.
- J. M. Hall, M. K. Lee, B. Newman, J. E. Morrow, L. A. Anderson, B. Huey and M.-C. King, Science, 1990, 250, 1684–1689 CAS.
- A. L. Schechter, D. F. Stern, L. Vaidyanathan, S. J. Decker, J. A. Drebin, M. I. Greene and R. A. Weinberg, Nature, 1984, 312, 513–516 CrossRef CAS PubMed.
- H. M. Lemon, Cancer, 1970, 25, 423–435 CrossRef CAS PubMed.
- D. L. Stredrick, M. Garcia-Closas, M. A. Pineda, P. Bhatti, B. H. Alexander, M. M. Doody, J. Lissowska, B. Peplonska, L. A. Brinton, S. J. Chanock, J. P. Struewing and A. J. Sigurdson, Hum. Mutat., 2006, 27, 538–544 CrossRef CAS PubMed.
- A. Torkamania, G. Verkhivkerb and N. J. Schorka, Cancer, 2010, 281, 117–127 Search PubMed.
- E. R. C. G. N. Galvão, L. M. S. Martins, J. O. Ibiapina, H. M. Andrade and S. J. H. Monte, J. Cancer Res. Clin. Oncol., 2011, 137, 915–925 CrossRef PubMed.
- R. Akbani, P. K. S. Ng, H. M. J. Werner, M. Shahmoradgoli, F. Zhang, Z. Ju, W. Liu, J.-Y. Yang, K. Yoshihara, J. Li, S. Ling, E. G. Seviour, P. T. Ram, J. D. Minna, L. Diao, P. Tong, J. V. Heymach, S. M. Hill, F. Dondelinger, N. Städler, L. A. Byers, F. Meric-Bernstam, J. N. Weinstein, B. M. Broom, R. G. W. Verhaak, H. Liang, S. Mukherjee, Y. Lu and G. B. Mills, Nat. Commun., 2014, 5, 3887 CAS.
- N. Olsson, P. Carlsson, P. James, K. Hansson, S. Waldemarson, P. Malmström, M. Fernö, L. Ryden, C. Wingren and C. A. K. Borrebaeck, Mol. Cell. Proteomics, 2013, 12, 3612–3623 CAS.
- R. T. Lawrence, E. M. Perez, D. Hernández, C. P. Miller, K. M. Haas, H. Y. Irie, S. I. Lee, A. C. Blau and J. Villén, Cell Rep., 2015, 11, 630–644 CrossRef CAS PubMed.
- S. Tyanova, R. Albrechtsen, P. Kronqvist, J. Cox, M. Mann and T. Geiger, Nat. Commun., 2016, 7, 1–11 Search PubMed.
- R. Simon and G. Sauter, Exp. Hematol., 2002, 30, 1365–1372 CrossRef CAS PubMed.
- D. C. Koboldt, R. S. Fulton, M. D. McLellan, H. Schmidt, J. Kalicki-Veizer, J. F. McMichael, L. L. Fulton, D. J. Dooling, L. Ding, E. R. Mardis, R. K. Wilson, A. Ally, M. Balasundaram, Y. S. N. Butterfield, R. Carlsen, C. Carter, A. Chu, E. Chuah, H.-J. E. Chun, R. J. N. Coope, N. Dhalla, R. Guin, C. Hirst, M. Hirst, R. A. Holt, D. Lee, H. I. Li, M. Mayo, R. A. Moore, A. J. Mungall, E. Pleasance, A. G. Robertson, J. E. Schein, A. Shafiei, P. Sipahimalani, J. R. Slobodan, D. Stoll, A. Tam, N. Thiessen, R. J. Varhol, N. Wye, T. Zeng, Y. Zhao, I. Birol, S. J. M. Jones, M. A. Marra, A. D. Cherniack, G. Saksena, R. C. Onofrio, N. H. Pho, S. L. Carter, S. E. Schumacher, B. Tabak, B. Hernandez, J. Gentry, H. Nguyen, A. Crenshaw, K. Ardlie, R. Beroukhim, W. Winckler, G. Getz, S. B. Gabriel, M. Meyerson, L. Chin, P. J. Park, R. Kucherlapati, K. A. Hoadley, J. Todd Auman, C. Fan, Y. J. Turman, Y. Shi, L. Li, M. D. Topal, X. He, H.-H. Chao, A. Prat, G. O. Silva, M. D. Iglesia, W. Zhao, J. Usary, J. S. Berg, M. Adams, J. Booker, J. Wu, A. Gulabani, T. Bodenheimer, A. P. Hoyle, J. V. Simons, M. G. Soloway, L. E. Mose, S. R. Jefferys, S. Balu, J. S. Parker, D. N. Hayes, C. M. Perou, S. Malik, S. Mahurkar, H. Shen, D. J. Weisenberger, T. Triche Jr, P. H. Lai, M. S. Bootwalla, D. T. Maglinte, B. P. Berman, D. J. Van Den Berg, S. B. Baylin, P. W. Laird, C. J. Creighton, L. A. Donehower, G. Getz, M. Noble, D. Voet, G. Saksena, N. Gehlenborg, D. DiCara, J. Zhang, H. Zhang, C.-J. Wu, S. Y. Liu, M. S. Lawrence, L. Zou, A. Sivachenko, P. Lin, P. Stojanov, R. Jing, J. Cho, R. Sinha, R. W. Park, M.-D. Nazaire, J. Robinson, H. Thorvaldsdottir, J. Mesirov, P. J. Park, L. Chin, S. Reynolds, R. B. Kreisberg, B. Bernard, R. Bressler, T. Erkkila, J. Lin, V. Thorsson, W. Zhang, I. Shmulevich, G. Ciriello, N. Weinhold, N. Schultz, J. Gao, E. Cerami, B. Gross, A. Jacobsen, R. Sinha, B. A. Aksoy, Y. Antipin, B. Reva, R. Shen, B. S. Taylor, M. Ladanyi, C. Sander, P. Anur, P. T. Spellman, Y. Lu, W. Liu, R. R. G. Verhaak, G. B. Mills, R. Akbani, N. Zhang, B. M. Broom, T. D. Casasent, C. Wakefield, A. K. Unruh, K. Baggerly, K. Coombes, J. N. Weinstein, D. Haussler, C. C. Benz, J. M. Stuart, S. C. Benz, J. Zhu, C. C. Szeto, G. K. Scott, C. Yau, E. O. Paull, D. Carlin, C. Wong, A. Sokolov, J. Thusberg, S. Mooney, S. Ng, T. C. Goldstein, K. Ellrott, M. Grifford, C. Wilks, S. Ma, B. Craft, C. Yan, Y. Hu, D. Meerzaman, J. M. Gastier-Foster, J. Bowen, N. C. Ramirez, A. D. Black, R. E. Pyatt, P. White, E. J. Zmuda, J. Frick, T. M. Lichtenberg, R. Brookens, M. M. George, M. A. Gerken, H. A. Harper, K. M. Leraas, L. J. Wise, T. R. Tabler, C. McAllister, T. Barr, M. Hart-Kothari, K. Tarvin, C. Saller, G. Sandusky, C. Mitchell, M. V. Iacocca, J. Brown, B. Rabeno, C. Czerwinski, N. Petrelli, O. Dolzhansky, M. Abramov, O. Voronina, O. Potapova, J. R. Marks, W. M. Suchorska, D. Murawa, W. Kycler, M. Ibbs, K. Korski, A. Spychała, P. Murawa, J. J. Brzeziński, H. Perz, R. Łaźniak, M. Teresiak, H. Tatka, E. Leporowska, M. Bogusz-Czerniewicz, J. Malicki, A. Mackiewicz, M. Wiznerowicz, X. Van Le, B. Kohl, N. V. Tien, R. Thorp, N. Van Bang, H. Sussman, B. Duc Phu, R. Hajek, N. Phi Hung, T. V. T. Phuong, H. Q. Thang, K. Z. Khan, R. Penny, D. Mallery, E. Curley, C. Shelton, P. Yena, J. N. Ingle, F. J. Couch, W. L. Lingle, T. A. King, A. M. Gonzalez-Angulo, G. B. Mills, M. D. Dyer, S. Liu, X. Meng, M. Patangan, F. Waldman, H. Stöppler, W. K. Rathmell, L. Thorne, M. Huang, L. Boice, A. Hill, C. Morrison, C. Gaudioso, W. Bshara, K. Daily, S. C. Egea, M. D. Pegram, C. Gomez-Fernandez, R. Dhir, R. Bhargava, A. Brufsky, C. D. Shriver, J. A. Hooke, J. L. Campbell, R. J. Mural, H. Hu, S. Somiari, C. Larson, B. Deyarmin, L. Kvecher, A. J. Kovatich, M. J. Ellis, T. A. King, H. Hu, F. J. Couch, R. J. Mural, T. Stricker, K. White, O. Olopade, J. N. Ingle, C. Luo, Y. Chen, J. R. Marks, F. Waldman, M. Wiznerowicz, R. Bose, L.-W. Chang, A. H. Beck, A. M. Gonzalez-Angulo, T. Pihl, M. Jensen, R. Sfeir, A. Kahn, A. Chu, P. Kothiyal, Z. Wang, E. Snyder, J. Pontius, B. Ayala, M. Backus, J. Walton, J. Baboud, D. Berton, M. Nicholls, D. Srinivasan, R. Raman, S. Girshik, P. Kigonya, S. Alonso, R. Sanbhadti, S. Barletta, D. Pot, M. Sheth, J. A. Demchok, K. R. M. Shaw, L. Yang, G. Eley, M. L. Ferguson, R. W. Tarnuzzer, J. Zhang, L. A. L. Dillon, K. Buetow, P. Fielding, B. A. Ozenberger, M. S. Guyer, H. J. Sofia and J. D. Palchik, Nature, 2012, 490, 61–70 CrossRef CAS PubMed.
- H. Hondermarck, Mol. Cell. Proteomics, 2003, 2, 281–291 CAS.
- N. Q. Liu, R. B. H. Braakman, C. Stingl, T. M. Luider, J. W. M. Martens, J. A. Foekens and A. Umar, J. Mammary Gland Biol. Neoplasia, 2012, 17, 155–164 CrossRef PubMed.
- M. Mann and N. L. Kelleher, Proc. Natl. Acad. Sci. U. S. A., 2008, 105, 18132–18138 CrossRef CAS PubMed.
- B. Schilling, B. MacLean, J. M. Held, A. K. Sahu, M. J. Rardin, D. J. Sorensen, T. Peters, A. J. Wolfe, C. L. Hunter, M. J. MacCoss and B. W. Gibson, Anal. Chem., 2015, 87, 10222–10229 CrossRef CAS PubMed.
- N. Rauniyar, Int. J. Mol. Sci., 2015, 16, 28566–28581 CrossRef PubMed.
- M. Frantzi, A. Bhat and A. Latosinska, Clin. Transl. Med., 2014, 3, 7 CrossRef PubMed.
- C. A. Banks, M. Lakshminarasimhan and M. P. Washburn, eLS, 2014, 1–7 Search PubMed.
- C. A. S. Banks, S. E. Kong and M. P. Washburn, Protein Expression Purif., 2012, 86, 105–119 CrossRef CAS PubMed.
- X. Yao, A. Freas, J. Ramirez, P. A. Demirev and C. Fenselau, Anal. Chem., 2001, 73, 2836–2842 CrossRef CAS PubMed.
- S. P. Gygi, B. Rist, S. A. Gerber, F. Turecek, M. H. Gelb and R. Aebersold, Nat. Biotechnol., 1999, 17, 994–999 CrossRef CAS PubMed.
- C. Pan, Y. Oda, P. K. Lankford, B. Zhang, N. F. Samatova, D. A. Pelletier, C. S. Harwood and R. L. Hettich, Mol. Cell. Proteomics, 2008, 7, 938–948 CAS.
- Z. Li, R. M. Adams, K. Chourey, G. B. Hurst, R. L. Hettich and C. Pan, J. Proteome Res., 2012, 11, 1582–1590 CrossRef CAS PubMed.
- K. A. Sap and J. A. A. Demmers, Integr. Proteomics, 2012, 111–132 CAS.
- Y. Oda, K. Huang, F. R. Cross, D. Cowburn and B. T. Chait, Proc. Natl. Acad. Sci. U. S. A., 1999, 96, 6591–6596 CrossRef CAS.
- T. P. Conrads, K. Alving, T. D. Veenstra, M. E. Belov, G. A. Anderson, D. J. Anderson, M. S. Lipton, L. Paša-Tolić, H. R. Udseth, W. B. Chrisler, B. D. Thrall and R. D. Smith, Anal. Chem., 2001, 73, 2132–2139 CrossRef CAS PubMed.
- D. B. Mcclatchy, M. Dong, C. C. Wu, J. D. Venable and R. John, Proteomes, 2010, 6, 2005–2010 Search PubMed.
- O. Chahrour, D. Cobice and J. Malone, J. Pharm. Biomed. Anal., 2015, 113, 2–20 CrossRef CAS PubMed.
- S.-E. Ong, B. Blagoev, I. Kratchmarova, D. B. Kristensen, H. Steen, A. Pandey and M. Mann, Mol. Cell. Proteomics, 2002, 1.5, 376–386 Search PubMed.
- A. K. Yocum, C. M. Busch, C. A. Felix and I. A. Blair, J. Proteome Res., 2006, 5, 2743–2753 CrossRef CAS PubMed.
- B. J. Xu, W. Yan, B. Jovanovic, A. Q. An, N. Cheng, M. E. Aakre, Y. Yi, J. Eng, A. J. Link and H. L. Moses, Proteomics, 2010, 10, 2458–2470 CrossRef CAS PubMed.
- H. C. Harsha, S. M. Pinto and A. Pandey, Methods Mol. Biol., 2013, 1007, 359–377 CAS.
- W. Yang, Q. Cai, V. W. Y. Lui, P. A. Everley, J. Kim, N. Bhola, K. M. Quesnelle, B. R. Zetter, H. Steen, M. R. Freeman and J. R. Grandis, J. Proteome Res., 2011, 9, 3073–3082 CrossRef PubMed.
- D. López-Ferrer, A. Ramos-Fernández, S. Martínez-Bartolomé, P. García-Ruiz and J. Vázquez, Proteomics, 2006, 6, S4–S11 CrossRef PubMed.
- D. B. Sprinson and D. Rittenberg, Nature, 1951, 167, 484 CrossRef CAS.
- A. J. Patwardhan, E. F. Strittmatter, D. G. Camp, R. D. Smith and M. G. Pallavicini, Proteomics, 2006, 6, 2903–2915 CrossRef CAS PubMed.
- J. Blonder, L. R. Yu, G. Radeva, K. C. Chan, D. A. Lucas, T. J. Waybright, H. J. Issaq, F. J. Sharom and T. D. Veenstra, J. Proteome Res., 2006, 5, 349–360 CrossRef CAS PubMed.
- L. R. Philip, Y. N. Huang, J. N. Marchese, B. Williamson, K. Parker, S. Hattan, N. Khainovski, S. Pillai, S. Dey, S. Daniels, S. Purkayastha, P. Juhasz, S. Martin, M. B. Jones, F. He, A. Jacobson and D. J. Pappin, Mol. Cell. Proteomics, 2004, 3.12, 1154–1169 Search PubMed.
- A. Thompson, J. Schafer, K. Kuhn, S. Kienle, J. Schwarz, G. Schmidt, T. Neumann and C. Hamon, Anal. Chem., 2003, 75, 1895–1904 CrossRef CAS PubMed.
- P. Gromov, J. M. Moreira and I. Gromova, Expert Rev. Proteomics, 2014, 11, 285–302 CrossRef CAS PubMed.
- U. B. Kang, Y. Ahn, J. W. Lee, Y.-H. Kim, J. Kim, M.-H. Yu, D.-Y. Noh and C. Lee, BMC Cancer, 2010, 10, 114 CrossRef PubMed.
- D. C. Frost, T. Greer and L. Li, Anal. Chem., 2015, 87, 1646–1654 CrossRef CAS PubMed.
- R. A. Everley, R. C. Kunz, F. E. McAllister and S. P. Gygi, Anal. Chem., 2013, 85, 5340–5346 CrossRef CAS PubMed.
- Z. Yao, J. Li, Z. Liu, L. Zheng, N. Fan, Y. Zhang, N. Jia, J. Lv, N. Liu, X. Zhu, J. Du, C. Lv, F. Xie, Y. Liu, X. Wang, Z. Fei and C. Gao, Mol. BioSyst., 2016, 12, 729–736 RSC.
- J. Yang, Y. Hou, M. Zhou, S. Wen, J. Zhou, L. Xu, X. Tang, Y. Du, P. Hu and M. Liu, Int. J. Biochem. Cell Biol., 2016, 71, 62–71 CrossRef CAS PubMed.
- N. Pendharkar, A. Gajbhiye, K. Taunk, S. RoyChoudhury, S. Dhali, S. Seal, A. Mane, S. Abhang, M. K. Santra, K. Chaudhury and S. Rapole, J. Proteomics, 2016, 132, 112–130 CrossRef CAS PubMed.
- M. Campone, I. Valo, P. Jézéquel, M. Moreau, A. Boissard, L. Campion, D. Loussouarn, V. Verriele, O. Coqueret and C. Guette, Mol. Cell. Proteomics, 2015, 14, 2936–2946 CAS.
- C. Evans, J. Noirel, S. Y. Ow, M. Salim, A. G. Pereira-Medrano, N. Couto, J. Pandhal, D. Smith, T. K. Pham, E. Karunakaran, X. Zou, C. A. Biggs and P. C. Wright, Anal. Bioanal. Chem., 2012, 404, 1011–1027 CrossRef CAS PubMed.
- J. M. Chick, D. Kolippakkam, D. P. Nusinow, B. Zhai, R. Rad, E. L. Huttlin and S. P. Gygi, Nat. Biotechnol., 2015, 33, 743–749 CrossRef CAS PubMed.
- H. Liu, R. G. Sadygov and J. R. Yates, Anal. Chem., 2004, 76, 4193–4201 CrossRef CAS PubMed.
- B. Zybailov, M. Coleman, L. Florens and M. Washburn, Anal. Chem., 2005, 77, 6218–6224 CrossRef CAS PubMed.
- D. Chelius and P. Bondarenko, J. Proteome Res., 2002, 1, 317–323 CrossRef CAS PubMed.
- N. M. Griffin, J. Yu, F. Long, P. Oh, S. Shore, Y. Li, J. A. Koziol and J. E. Schnitzer, Nat. Biotechnol., 2010, 28, 83–89 CrossRef CAS PubMed.
- B. Zybailov, A. L. Mosley, M. E. Sardiu, M. K. Coleman, L. Florens and M. P. Washburn, J. Proteome Res., 2006, 5, 2339–2347 CrossRef CAS PubMed.
- Y. Zhang, Z. Wen, M. P. Washburn and L. Florens, Anal. Chem., 2010, 82, 2272–2281 CrossRef CAS PubMed.
- J. Cox and M. Mann, Nat. Biotechnol., 2008, 26, 1367–1372 CrossRef CAS PubMed.
- J. D. Egertson, B. MacLean, R. Johnson, Y. Xuan and M. J. MacCoss, Nat. Protoc., 2015, 10, 887–903 CrossRef PubMed.
- H. T. Tan, Y. H. Lee and M. C. M. Chung, Mass Spectrom. Rev., 2012, 31, 583–605 CrossRef CAS PubMed.
- M. Bantscheff, S. Lemeer, M. M. Savitski and B. Kuster, Anal. Bioanal. Chem., 2012, 404, 939–965 CrossRef CAS PubMed.
- N. Q. Liu, L. J. M. Dekker, C. Stingl, C. Guzel, T. De Marchi, J. W. M. Martens, J. A. Foekens, T. M. Luider and A. Umar, J. Proteome Res., 2013, 12, 4627–4641 CrossRef CAS PubMed.
- G. N. Sharma, R. Dave, J. Sanadya, P. Sharma and K. K. Sharma, J. Adv. Pharm. Technol. Res., 2010, 109–126 Search PubMed.
- N. Bhoo-Pathy, S. Subramaniam, N. A. Taib, M. Hartman, Z. Alias, G.-H. Tan, R. I. Ibrahim, C.-H. Yip and H. M. Verkooijen, Br. J. Cancer, 2014, 110, 1–8 CrossRef PubMed.
- C. M. Perou, T. Sørlie, M. B. Eisen, M. van de Rijn, S. S. Jeffrey, C. A. Rees, J. R. Pollack, D. T. Ross, H. Johnsen, L. A. Akslen, O. Fluge, A. Pergamenschikov, C. Williams, S. X. Zhu, P. E. Lønning, A. L. Børresen-Dale, P. O. Brown and D. Botstein, Nature, 2000, 406, 747–752 CrossRef CAS PubMed.
- T. Sorlie, R. Tibshirani, J. Parker, T. Hastie, J. S. Marron, A. Nobel, S. Deng, H. Johnsen, R. Pesich, S. Geisler, J. Demeter, C. M. Perou, P. E. Lønning, P. O. Brown, A.-L. Børresen-Dale and D. Botstein, Proc. Natl. Acad. Sci. U. S. A., 2003, 100, 8418–8423 CrossRef CAS PubMed.
- P. Kumar and R. Aggarwal, Arch. Gynecol. Obstet., 2016, 293, 247–269 CrossRef CAS PubMed.
- C. Curtis, S. P. Shah, S.-F. Chin, G. Turashvili, O. M. Rueda, M. J. Dunning, D. Speed, A. G. Lynch, S. Samarajiwa, Y. Yuan, S. Gräf, G. Ha, G. Haffari, A. Bashashati, R. Russell, S. McKinney, A. Langerød, A. Green, E. Provenzano, G. Wishart, S. Pinder, P. Watson, F. Markowetz, L. Murphy, I. Ellis, A. Purushotham, A.-L. Børresen-Dale, J. D. Brenton, S. Tavaré, C. Caldas and S. Aparicio, Nature, 2012, 486, 346–352 CAS.
- M. A. Munirah, M. A. Siti-Aishah, M. Z. Reena, N. A. Sharifah, M. Rohaizak, A. Norlia, M. K. M. Rafie, A. Asmiati, A. Hisham, I. Fuad, N. S. Shahrun and S. Das, Rom. J. Morphol. Embryol., 2011, 52, 669–677 CAS.
- R. Sabatier, P. Finetti, A. Guille, J. Adelaide, M. Chaffanet, P. Viens, D. Birnbaum and F. Bertucci, Mol. Cancer, 2014, 13, 228 CrossRef PubMed.
- J. H. Taube, J. I. Herschkowitz, K. Komurov, A. Y. Zhou, S. Gupta, J. Yang, K. Hartwell, T. T. Onder, P. B. Gupta, K. W. Evans, B. G. Hollier, P. T. Ram, E. S. Lander, J. M. Rosen, R. A. Weinberg and S. A. Mani, Proc. Natl. Acad. Sci. U. S. A., 2010, 107, 15449–15454 CrossRef CAS PubMed.
- J. Lamb, M. H. Ladha, C. McMahon, R. L. Sutherland and M. E. Ewen, Mol. Cell. Biol., 2000, 20, 8667–8675 CrossRef CAS PubMed.
- O. Yersal and S. Barutca, World J. Clin. Oncol., 2014, 5, 412–424 CrossRef PubMed.
- A. Prat, M. J. Ellis and C. M. Perou, Nat. Rev. Clin. Oncol., 2012, 9, 48–57 CrossRef CAS PubMed.
- A. Prat, E. Pineda, B. Adamo, P. Galvan, A. Fernández, L. Gaba, M. Díez, M. Viladot, A. Arance and M. Muñoz, Breast, 2015, 24, S26–S35 CrossRef PubMed.
- A. Prat, B. Adamo, C. Fan, V. Peg, M. Vidal, P. Galván, A. Vivancos, P. Nuciforo, H. G. Palmer, S. Dawood, J. Rodón, S. R. Cajal, J. M. Del Campo, E. Felip, J. Tabernero and J. Cortés, Sci. Rep., 2013, 3, 3544 Search PubMed.
- L. Malorni, P. B. Shetty, C. De Angelis, S. Hilsenbeck, M. F. Rimawi, R. Elledge, C. K. Osborne, S. De Placido and G. Arpino, Breast Cancer Res. Treat., 2012, 136, 795–804 CrossRef CAS PubMed.
- K. Aysola, A. Desai, C. Welch, J. Xu, Y. Qin, V. Reddy, R. Matthews, C. Owens, J. Okoli, D. J. Beech, C. J. Piyathilake, S. P. Reddy and V. N. Rao, Hered. Genet., 2013, 2013, S2 Search PubMed.
- T. Ovcaricek, S. G. Frkovic, E. Matos, B. Mozina and S. Borstnar, Radiol. Oncol., 2011, 45, 46–52 Search PubMed.
- C. Liedtke, C. Mazouni, K. R. Hess, F. André, A. Tordai, J. A. Mejia, W. F. Symmans, A. M. Gonzalez-Angulo, B. Hennessy, M. Green, M. Cristofanilli, G. N. Hortobagyi and L. Pusztai, J. Clin. Oncol., 2008, 26, 1275–1281 CrossRef PubMed.
- G. Bianchini, J. M. Balko, I. A. Mayer, M. E. Sanders and L. Gianni, Nat. Rev. Clin. Oncol., 2016, 13, 674–690 CrossRef CAS PubMed.
- M. Bonotto, L. Gerratana, E. Poletto, P. Driol, M. Giangreco, S. Russo, A. M. Minisini, C. Andreetta, M. Mansutti, F. E. Pisa, G. Fasola and F. Puglisi, Oncologist, 2014, 19, 608–615 CrossRef PubMed.
- B. D. Lehmann, J. A. Bauer, X. Chen, M. E. Sanders, A. B. Chakravarthy, Y. Shyr and J. A. Pietenpol, J. Clin. Invest., 2011, 121, 2750–2767 CAS.
- A. Prat, B. Adamo, M. C. U. Cheang, C. K. Anders, L. A. Carey and C. M. Perou, Oncologist, 2013, 18, 123–133 CrossRef CAS PubMed.
- Y. R. Liu, Y. Z. Jiang, X. E. Xu, K. Da Yu, X. Jin, X. Hu, W.-J. Zuo, S. Hao, J. Wu, G. Y. Liu, G. H. Di, D. Q. Li, X. H. He, W. G. Hu and Z. M. Shao, Breast Cancer Res., 2016, 18, 33 CrossRef PubMed.
- M. D. Burstein, A. Tsimelzon, G. M. Poage, K. R. Covington, A. Contreras, S. A. W. Fuqua, M. I. Savage, C. K. Osborne, S. G. Hilsenbeck, J. C. Chang, G. B. Mills, C. C. Lau and P. H. Brown, Clin. Cancer Res., 2015, 21, 1688–1698 CrossRef CAS PubMed.
- R. J. Cardnell, Y. Feng, L. Diao, Y. H. Fan, F. Masrorpour, J. Wang, Y. Shen, G. B. Mills, J. D. Minna, J. V. Heymach and L. A. Byers, Clin. Cancer Res., 2013, 19, 6322–6328 CrossRef CAS PubMed.
- P. R. Graves and T. A. J. Haystead, MMBR, Microbiol. Mol. Biol. Rev., 2002, 66, 39–63 CrossRef CAS PubMed.
- I. Ezkurdia, D. Juan, J. M. Rodriguez, A. Frankish, M. Diekhans, J. Harrow, J. Vazquez, A. Valencia and M. L. Tress, bioRxivp, 2014.
- J. J. Kennedy, S. E. Abbatiello, K. Kim, P. Yan, R. Jeffrey, C. Lin, J. S. Kim, Y. Zhang, X. Wang, G. Richard, L. Zhao, H. Min, Y. Lee, M. Yu and E. G. Yang, Nat. Methods, 2014, 11, 149–155 CrossRef CAS PubMed.
- N. Q. Liu, C. Stingl, M. P. Look, M. Smid, R. B. H. Braakman, T. De Marchi, A. M. Sieuwerts, P. N. Span, F. C. G. J. Sweep, B. K. Linderholm, A. Mangia, A. Paradiso, L. Y. Dirix, S. J. Van Laere, T. M. Luider, J. W. M. Martens, J. A. Foekens and A. Umar, J. Natl. Cancer Inst., 2014, 106 DOI:10.1093/jnci/djt376.
- H. J. J. Senn, B. Thürlimann, A. Goldhirsch, W. C. C. Wood, R. D. D. Gelber, A. S. S. Coates and B. Thurlimann, Breast, 2003, 12, 569–582 CrossRef PubMed.
- P. Eifel, J. A. Axelson, J. Costa, J. Crowley, W. J. Curran, A. Deshler, S. Fulton, C. B. Hendricks, M. Kemeny, A. B. Kornblith, T. A. Louis, M. Markman, R. Mayer and D. Roter, JNCI, J. Natl. Cancer Inst., 2001, 93, 979–989 CrossRef CAS PubMed.
- N. Q. Liu, T. De Marchi, A. M. Timmermans, R. Beekhof, A. M. A. C. Trapman-Jansen, R. Foekens, M. P. Look, C. H. M. van Deurzen, P. N. Span, F. C. G. J. Sweep, J. B. Brask, V. Timmermans-Wielenga, R. Debets, J. W. M. Martens, J. A. Foekens and A. Umar, Mol. Cell. Proteomics, 2014, 1814–1827 CAS.
- M. Campone, I. Valo, P. Jézéquel, M. Moreau, A. Boissard, L. Campion, D. Loussouarn, V. Verriele, O. Coqueret and C. Guette, Mol. Cell. Proteomics, 2015, 2936–2946 CAS.
- M. Leclercq and L. Guy, Breast Cancer Res. Treat., 2004, 249–289 Search PubMed.
- S. M. Hyder, Y. Liang and J. Wu, Int. J. Cancer, 2009, 125, 1045–1053 CrossRef CAS PubMed.
- G. Judes, K. Rifaï, M. Daures, L. Dubois, Y.-J. Bignon, F. Penault-Llorca and D. Bernard-Gallon, Cancer Lett., 2016, 1–9 Search PubMed.
- S. Suman, T. Basak, P. Gupta, S. Mishra, V. Kumar, S. Sengupta and Y. Shukla, J. Proteomics, 2016, 148, 183–193 CrossRef CAS PubMed.
- E. Maurizio, J. R. Wiśniewski, Y. Ciani, A. Amato, L. Arnoldo, C. Penzo, S. Pegoraro, V. Giancotti, A. Zambelli, S. Piazza, G. Manfioletti and R. Sgarra, Mol. Cell. Proteomics, 2016, 15, 109–123 CAS.
- T. Sun, N. Aceto, K. L. Meerbrey, J. D. Kessler, C. Zhou, I. Migliaccio, D. X. Nguyen, N. N. Pavlova, M. Botero, J. Huang, R. J. Bernardi, E. Schmitt, G. Hu, M. Z. Li, N. Dephoure, S. P. Gygi, M. Rao, C. J. Creighton, S. G. Hilsenbeck, C. A. Shaw, D. Muzny, R. A. Gibbs, D. A. Wheeler, C. K. Osborne, R. Schiff, M. Bentires-Alj, S. J. Elledge and T. F. Westbrook, Cell, 2011, 144, 703–718 CrossRef CAS PubMed.
- T. Cabezon, I. Gromova, P. Gromov, R. Serizawa, V. Timmermans Wielenga, N. Kroman, J. E. Celis and J. M. A. Moreira, Mol. Cell. Proteomics, 2012, 12, 381–394 Search PubMed.
- S. Corrêa, C. Panis, R. Binato, A. C. Herrera, L. Pizzatti and E. Abdelhay, J. Proteomics, 2016 DOI:10.1016/j.jprot.2016.07.030.
- D. Song, L. Yue, J. Zhang, S. Ma, W. Zhao, F. Guo, Y. Fan, H. Yang, Q. Liu, D. Zhang, Z. Xia, P. Qin, M. Yue, J. Yu, S. Zheng, F. Yang and J. Wang, Cancer Biol. Ther., 2016, 17, 635–647 CrossRef CAS PubMed.
- J. He, S. A. Whelan, M. Lu, D. Shen, D. U. Chung, R. E. Saxton, K. F. Faull, J. P. Whitelegge and H. R. Chang, Int. J. Proteomics, 2011, 2011, 896476 Search PubMed.
- S. M. Semaan, X. Wang, P. A. Stewart, A. G. Marshall and Q. X. A. Sang, Biochem. Biophys. Res. Commun., 2011, 412, 127–131 CrossRef CAS PubMed.
- T. Geiger, J. Cox, P. Ostasiewicz, J. R. Wisniewski and M. Mann, Nat. Methods, 2010, 7, 383–385 CrossRef CAS PubMed.
- D. Vergara, P. Simeone, P. del Boccio, C. Toto, D. Pieragostino, A. Tinelli, R. Acierno, S. Alberti, M. Salzet, G. Giannelli, P. Sacchetta and M. Maffia, Mol. BioSyst., 2013, 9, 1127–1138 RSC.
- X. Wu, M. S. Zahari, B. Ma, R. Liu, S. Renuse, N. A. Sahasrabuddhe, L. Chen, R. Chaerkady, M.-S. Kim, J. Zhong, C. Jelinek, M. A. Barbhuiya, P. Leal-Rojas, Y. Yang, M. K. Kashyap, A. Marimuthu, M. Ling, M. J. Fackler, V. Merino, Z. Zhang, C. A. Zahnow, E. Gabrielson, V. Stearns, J. C. Roa, S. Sukumar, P. S. Gill and A. Pandey, Oncotarget, 2015, 6, 29143–29160 Search PubMed.
- G. Manning, WormBook, 2005, pp. 1–19 Search PubMed.
- J. Rauch, N. Volinsky, D. Romano and W. Kolch, Cell Commun. Signaling, 2011, 9, 23 CrossRef CAS PubMed.
- P. Mertins, D. R. Mani, K. V. Ruggles, M. A. Gillette, K. R. Clauser, P. Wang, X. Wang, S. Cao, F. Petralia, E. Kawaler, F. Mundt, K. Krug, Z. Tu, J. T. Lei, M. L. Gatza, M. Wilkerson, C. M. Perou, V. Yellapantula, K. Huang, C. Lin, M. D. Mclellan, P. Yan, S. R. Davies, R. R. Townsend, S. J. Skates, J. Wang, B. Zhang, C. R. Kinsinger, M. Mesri, H. Rodriguez, L. Ding, A. G. Paulovich, D. Fenyö, M. J. Ellis, S. A. Carr and N. C. I. Cptac, Nature, 2016, 534, 55–62 CrossRef CAS PubMed.
- L. H. Pearl and D. Barford, Curr. Opin. Struct. Biol., 2002, 12, 761–767 CrossRef CAS PubMed.
- G. C. Sun, X. Yang, Y. Yu and D. W. Zhao, Adv. Anticancer Agents Med. Chem., 2015, 15, 869–880 CrossRef CAS.
| This journal is © The Royal Society of Chemistry 2017 |