 Open Access Article
Creative Commons Attribution 3.0 Unported Licence
Predicting the solubility of mixtures of sugars and their replacers using the Flory–Huggins theory
R. G. M.
van der Sman

Wageningen Food Biobased Research, Wageningen University & Research, Netherlands. E-mail: ruud.vandersman@wur.nl
First published on 22nd December 2016
Abstract
In this paper we investigate whether the Flory–Huggins theory can describe the thermodynamics of solutions of simple carbohydrates, like sugars and polyols. In particular, we focus on the description of the solubility of the carbohydrates in water. This is investigated for both binary and ternary mixtures, having two types of these carbohydrates. This research question arises especially in the case of bakery products, where one seeks to replace sucrose with other simple carbohydrates – which are often polyols. Based on the model parameters obtained from fitting the theory to the experimental data of binary solutions, we show that the theory can predict (a) solubility data for ternary mixtures, over a broad range of concentrations and temperatures, and (b) the deliquescence point of binary mixtures of carbohydrate crystals as a function of temperature. The theory can even be applied to carbohydrates, which form hydrate crystals. Together with our earlier theories on the thermodynamics of complex food mixtures, we have now a complete thermodynamic framework to describe the phase and state transitions of food materials as confectionery and bakery products, where the question of sucrose replacement is urgent.
1. Introduction
In this paper we investigate whether the Flory–Huggins theory can predict the solubility of simple sugars and their replacers like polyols. Moreover, we are interested in the solubility of ternary mixtures of simple carbohydrates, being either polyols or sugars. This research is the initial step towards a thermodynamic description of bakery and confectionery products, where (part of) the sugars are replaced with other carbohydrates like polyols. The reformulation of confectionery and bakery products has proven to be difficult, because of the fact that sugars like sucrose have multiple functionality in these food products, apart from providing sweetness.1–3 Sugars have a major impact on the phase transitions of biopolymers such as starch and gluten in bakery products,4,5 the boiling point of water, and the sorption of water.6,7 Often, the crystalline nature of sucrose contributes significantly to the texture of food products like biscuits,2 and confectionery like fondants and creams.8–13 During their dissolution in the biscuit dough mixing stage, the dissolving sugars compete for water with gluten. The degree of gluten hydration will determine the spread and rise of the biscuit.14 During the cooling stage after baking the dissolved sugars can recrystallize, which is said to provide the fractured texture of the biscuit surface.15Research shows that sucrose cannot be simply replaced by a single compound. A mixture of compounds must be used to provide the various functions provided by sucrose in the original formulation.16–18 As part of this mixture of sugar replacers one includes low molecular weight plasticizers like monosaccharides14,19,20 or polyols.21,22
Hence, for reformulation purposes it is important to understand the thermodynamics of complex mixtures including sugars and their replacers. The thermodynamics of complex food systems often helps also to understand food structuring processes.23,24 This is exemplified by the use of the supplemented state diagram in the analysis of cookie baking,25 bread baking,26 and the expansion of starchy snacks.27,28 In the supplemented state diagram one plots the glass transition, and other phase transitions as a function of moisture content. One can obtain a profound understanding of the food structuring process if one plots the processing path in the supplemented state diagram. Hereby, it is important to note that during processing physical systems will follow the phase transition lines like the boiling line.25,27
At this moment little attention has been given to the thermodynamics of complex food matrices, comprising of at least three components: say a biopolymer, water and a carbohydrate. However, they are important food categories. In bakery products there are two biopolymers present: starch and gluten – while in confectionery products a single biopolymer like gelatin is used. In bakery products also oils and fats are used, but they do not influence much the thermodynamics of hydrophilic compounds as biopolymers and carbohydrates. With respect to thermodynamics they can be regarded as inert fillers. In various empirical models predicting water activity from food composition this hypothesis has also been taken.29–32 There it is clearly observed that water activity is determined only by compounds that are soluble in water.
In some of our recent papers we have shown that the free-volume-Flory–Huggins theory is able to describe the thermodynamics of complex food systems, such as (1) mixtures of proteins, salt and water,33 and (2) mixtures of biopolymers, disaccharides and water.7 In this paper we take a first step towards the description of complex mixtures as found in bakery and confectionery products containing sugar replacers. In particular we investigate ternary mixtures of two carbohydrates (either a sugar or a polyol) and water. Because of the important functionality of crystalline sugars, we give emphasis to the prediction of the solubility of these ternary mixtures.
To achieve the above goal, we extend first the Flory–Huggins theory towards polyols. Thereby, an important question we like to resolve is whether the Flory–Huggins interaction parameter for sugars and polyols is temperature dependent or not. Earlier, we have found that for maltodextrins and starch the interaction parameter is temperature independent. This we have assumed to hold also for low molecular weight carbohydrates. However, studies have stated that the water activity of sucrose is temperature dependent.34 The knowledge on the temperature dependency of the Flory–Huggins interaction parameter is important for predicting the solubility of carbohydrates (mixtures) as a function of temperature. Furthermore, with this understanding we can construct the supplemented state diagram for sugars like sucrose, which is stated to be essential for understanding the structuring process of sweet cookie baking.25
Subsequently, we will model the solubility for the binary system first, being aqueous solutions of carbohydrates, with the crystals being anhydrates or monohydrates. Furthermore, with the help of the theory we will construct the supplemented state diagram for sucrose and glucose. The latter forms monohydrate crystals, and thus the construction of the supplemented state diagram is more challenging than the case of sucrose. Only partial state diagrams of glucose are shown in earlier papers.35,36
Finally, the Flory–Huggins theory will be applied to ternary mixtures of water, and two carbohydrates, where one of them may form monohydrate crystals. For the ternary system we can use most of the parameters already determined for binary systems. Only, the interaction parameter between the two carbohydrates has to be estimated.
Like sucrose, sugar replacers are often added to the food formulation in crystalline form (such as sweet biscuits2). In the mixtures of crystals the phenomenon of deliquescence can occur.37 At a defined water activity the crystals dissolve into liquid, which is absorbed from a water vapour phase at or above this defined water activity. In the mixtures of crystals the deliquescence occurs at the eutonic point. For the mixtures of sugars and polyols, these deliquescence or eutonic points have been determined.38,39 These data will serve as an extra validation of our theory.
2. Theory
2.1 Flory–Huggins theory for ternary mixtures
Originally, the Flory–Huggins theory is developed to describe the thermodynamic interaction between the blends of synthetic polymers or synthetic polymer solutions.40 Recently, we have shown in a multitude of papers that the theory also applies to food ingredients like polysaccharides (starch, dextran, and maltodextrins), proteins, and even low molecular weight sugars.7,41,42 To describe these systems in their glassy state a free-volume extension of the Flory–Huggins theory is required, as developed by Vrentas and Vrentas.43 For a detailed description of the application of these theories to food materials we refer the reader to our earlier papers. However, to make this paper more self-contained we have added a small introduction to the basics of the theory. As crystallization and dissolution occurs only if the temperature is above the glass temperature, we will not discuss the free-volume extension.The Flory–Huggins theory is formulated in terms of a free energy function, from which chemical potentials and osmotic pressures can be derived. The free energy function is quite similar to that of regular solution theory. In both theories the free energy function has two contributions: an entropic, ideal mixing part and an enthalpic contribution, which is second order in composition (similar to the virial extension of the osmotic pressure). This second term is proportional with the so-called Flory–Huggins interaction parameter χ.
In the Flory–Huggins theory one calculates with volume fractions instead of molar fractions, because the long polymer molecule has multiple degrees of freedom. For synthetic polymers the interaction parameter accounts for the van der Waals interaction between polymers or the polymer and its solvent. Furthermore, it is assumed that the polymer is a flexible, linear chain.
Biopolymers and carbohydrates interact with their solvent (water) via hydrogen bonds, for which the original Flory–Huggins theory does not account for. For systems with hydrogen bonding fundamental theories do exist, but they are much more involving than the Flory–Huggins theory and the theory has only been applied to a few case studies, like PEG and PEO.6,44,45 Later, it has been shown that these fundamental theories can be approximated by a composition dependent interaction parameter. Hence, in our application of the Flory–Huggins theory to food materials the interaction parameter has lost its fundamental meaning.
The Flory–Huggins theory is best introduced for a polymer solution. The polymer volume fraction is denoted by ϕp = 1 − ϕw, and Np is the ratio of the molar volumes of the polymer monomer and the solvent. The free energy density function is:
 | (1) |
Below, we will state the chemical potentials for ternary mixtures of sugars, polyols and water using the Flory–Huggins theory. Note that crystallization or dissolution can only occur, if the system is not in the glassy state. Below the glass transition temperature the time scales for solute diffusion are so slow that crystallization or dissolution does not occur on practical time scales as that in laboratory experiments or industrial processing. Hence, it is commonly assumed in food science that crystallization practically does not occur.46–48
The free energy density functional for ternary mixtures, according to the Flory–Huggins theory, is as follows:49
 | (2) |
 | (3) |
 , with νi being the molar volume.
The large extent of the free energy functional makes it easy to produce errors in the algebra for deriving the chemical potential. Henceforth, we have used Maple V (Maplesoft) to derive the equations for the chemical potentials. The fact that it is easy to make errors is evident by the inconsistencies between the expressions of various papers.49,51–53 We find that only the expressions in ref. 51 are in agreement with our derivation. Hence, the chemical potentials are:
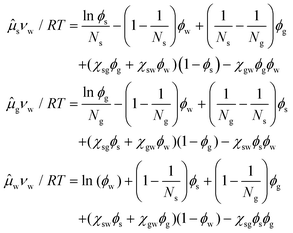 | (4) |
The index i = s indicates the primary carbohydrate (often sucrose), and index i = g indicates the secondary carbohydrate (often the sugar replacer).
The binary case follows for ϕg = 0. The binary interaction parameters can be estimated from the sorption isotherm, rendering the water activity aw:
 | (5) |
2.2 Chemical potential of a crystalline phase
The chemical potential for the crystalline carbohydrate μX follows from the general expression:| μX(T) = −ΔH(T) + TΔS(T) | (6) |
 | (7) |
| ΔCp,x(T) = ΔCp,x0+Δγp,x(T − Tx). | (8) |
Hence, the chemical potential of the crystal phase becomes:36
 | (9) |
2.3 Conditions for equilibrium
First, we use the thermodynamic theory for computing the solubility of simple carbohydrate forming anhydrate crystals. The solubility is governed by the thermodynamic equilibrium between the solution and crystalline phase. This is computed from the equality of the chemical potential of the carbohydrate in the solution and solid phase: μs = μX.For a carbohydrate dissolved in water the chemical potential for sugar follows the binary Flory–Huggins theory:
 | (10) |
For computing the solubility in ternary mixtures, containing water and two carbohydrates – with one of them in the crystalline phase, one still has the condition: μs = μX. However, now the chemical potential of the dissolved carbohydrate is computed using eqn (4).
The aqueous mixtures of two carbohydrates can also form an eutonic mixture, where two crystalline phases are in equilibrium with the solution phase. At a defined temperature the eutectic mixture is only at one specific composition. The thermodynamic condition for the eutonic point is:
 | (11) |
2.4 Hydrate crystals
Various sugars form hydrate crystals, for which the thermodynamics is not yet described in the Flory–Huggins framework. In the framework of the UNIFAC theory the thermodynamics of hydrate crystals has been described,55 taking a similar approach to that for cocrystals, salt hydrate and gas hydrate crystals.56,57 However, these formulations are on a molar basis, instead of a volumetric basis as in the Flory–Huggins theory. We will derive a similar equation using the minimization procedure of the free energy density functional, cf.58The total free energy density functional is:
 | (12) |
For a system of an aqueous carbohydrate solution in equilibrium with a hydrate crystal, we can write it as:
 | (13) |
 | (14) |
Hence, the free energy can be described in terms of ϕX:
 | (15) |
Note that ϕX is the only variable in the above expression of the free energy functional. The system will seek a minimum in the free energy density, which is given by:
 | (16) |
 | (17) |
 | (18) |
We note that an identical expression for the equilibrium has been found for the solid–liquid transition of eye lens proteins, which also form hydrate crystals.59 Hence, we are confident that the above derivation is valid.
3. Sorption isotherms of binary systems
In this section we investigate the water activity of various polyol solutions, as they have not yet been analysed by the Flory–Huggins theory. Furthermore, we revisit the water activity of sugar solutions, mainly because of the question whether the Flory–Huggins interaction parameter is temperature dependent or not.For our analysis we have made use of data sources from the literature, which we have listed in Table 1. First, we have used only data in the range of 20–45 degrees Celsius in order to estimate the interaction parameters. We have fitted the FH-theory to the water activity data, as shown in Fig. 1. Here, the symbols represent the experimental data, and the lines with the corresponding color represent the fitting using the Flory–Huggins theory. The fitted values of the interaction parameter χws are listed in Table 4.
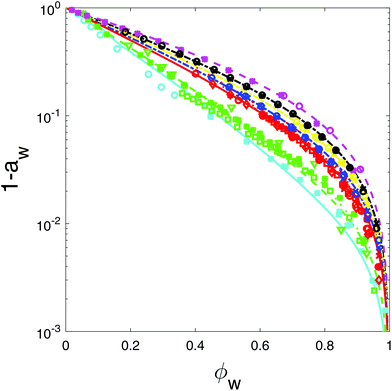 | ||
| Fig. 1 Flory–Huggins theory fitted to the sorption isotherm data of polyols and some simple sugars. For plotting purposes we show 1 − aw against the water volume fraction ϕw. Literature data sources are listed in Table 1. Data of simple sugars are duplicated from ref. 6. From top to bottom: ethyl glycol (magenta), glycerol (black), erythritol (yellow), xylitol (blue), sorbitol, mannitol, glucose, fructose (all red), sucrose, maltose (green), and maltotriose (cyan). Different symbols refer to different data sources. | ||
| Compound | Temperature (°C) | Ref. |
|---|---|---|
| Ethyl glycol | 25 | 60 and 61 |
| Glycerol | 25–35 | 61 and 62 |
| Erythritol | 25–35 | 62 |
| Xylitol | 10–35 | 62 |
| Sorbitol | 10–35 | 62 |
| Mannitol | 0, 25, 35 | 63 and 62 |
| Glucose | 0, 25, 45 | 64 and 65 |
| Sucrose | 0 | 65 |
| Maltose | 25, 45 | 64, 66 and 67 |
| Maltotriose | 45 | 64 |
| Glycerol | 80–180 | 68 |
| Glucose | 25–65 | 69 and 70 |
| Glucose | 100–130 | 71 |
| Fructose | 25, 30, 35 | 69 |
| Fructose | 100–130 | 71 |
| Sucrose | 25, 30, 35 | 69 |
| Sucrose | 0–100 | 72 and 73 |
| Maltose | 25, 30, 35 | 69 |
Furthermore, we show the interaction parameter as a function of the molar weight of the carbohydrate in Fig. 2. As one can observe χws is a smooth function of the molar weight. The sorption of polyols and sugars of similar molecular weights (like sorbitol and glucose) cannot be distinguished, as shown in Fig. 1.
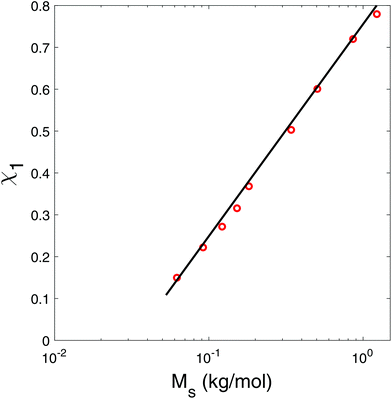 | ||
| Fig. 2 Flory–Huggins interaction parameter χ1 as a function of the molar weight of the carbohydrate. Numerical values are listed in Table 4. | ||
Thus, it appears that with respect to water sorption polyols and sugars can be treated as a single class of compounds, which are only characterized by their molar weight, similar to maltodextrins and dextrans.6 However, the Flory–Huggins interaction parameter is composition dependent for maltodextrins with the degree of polymerization larger than 2:
| χws = χ0 + (χ1 − χ0)ϕs2 | (19) |
The temperature dependence is investigated with extra datasets, spanning a wide range of temperatures. We have analysed the data on the basis of the excess chemical potential:
 | (20) |
The experimental data points are shown in Fig. 3, where we have used a similar color coding as in Fig. 1. We have compared the data with the expression for μex, cf. the Flory–Huggins theory, which is indicated with lines having similar color coding to the experimental datapoints. If water sorption of carbohydrates is independent of temperature, the data would coincide with the theoretical prediction. As one can observe, all experimental data for each compound fall onto a single curve, and follows the FH prediction. Hence, we conclude that the Flory–Huggins interaction parameter is indeed independent of temperature, for polyols, sugars and polysaccharides.
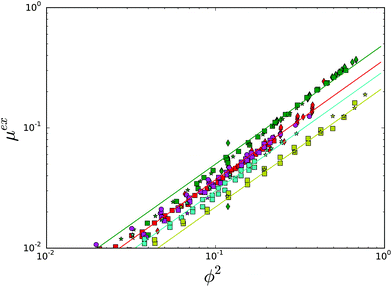 | ||
| Fig. 3 Test of the temperature independence of the Flory Huggins interaction parameter for sugars and polyols, using the excess chemical potential μex, which should be quadratic in ϕ2. Color coding is the same as in Fig. 1. Different symbols refer to different data sources. | ||
4. Solubility of sugars and polyols
4.1 Binary systems
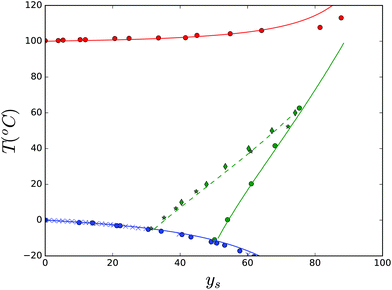
We have investigated the solubility of sucrose in water using the above theory. Because of its importance for understanding food structuring processes in complex food matrices containing sugar replacers, we will present our results in the supplemented state diagram of sucrose, Fig. 4. The phase transition lines are indicated using the available experimental data (symbols) from literature sources,34,55,66,74–76 and predictions made using the Flory–Huggins theory with the temperature independent interaction parameter of χws = 0.52. Earlier, we have modelled the glass transition data,77 which are copied into the figure.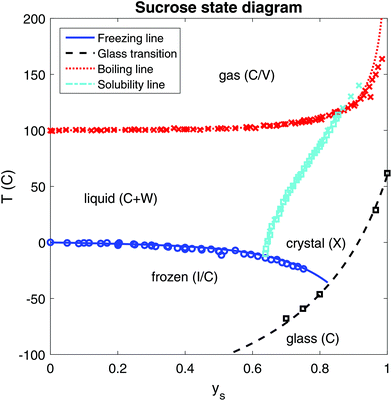 | ||
| Fig. 4 Complete supplemented state diagram of sucrose, indicating freezing, homogeneous nucleation, boiling, melting and glass transition temperatures as a function of mass fraction of sucrose ys. Symbols represent experimental data, and the lines are prediction made with the described Flory–Huggins theory and our earlier theory for the glass transition.77 | ||
The solubility data are fitted using the following parameters: ΔHx = 57 kJ mol−1, Tx = 470 K, ΔCp,x = 260 J mol−1 K, and Δγp,x = 0.008 J mol−1 K2. Their values are in a similar range to those in previous studies,36,55,78 albeit that there is definitely some variation between these sources. Further investigation shows that there are multiple parameter sets that give reasonable fitting to the data. We note that the enthalpy, as defined in eqn (7), decreases very significantly, and approaches zero near the freezing line. Nevertheless, from the figure we observe that the Flory–Huggins theory can accurately predict all thermodynamic behaviour of a binary sucrose–water mixture.
Subsequently, we have focussed on the solubility of various sugar replacers, namely a multitude of polyols and xylose. We note that all investigated carbohydrates form anhydrate crystals. The experimental data from the literature are again compared with the fitted lines using the Flory–Huggins theory. The comparison between experimental data and theory can be observed in Fig. 5. The experimental data for polyols are obtained from ref. 79, while that for xylose are obtained from ref. 80. Most of the parameter values describing μX are available in the literature.79,81,82 Only Γx has to be estimated, and in some cases ΔCp,x. All used values are listed in Table 4. As one can observe the values for all carbohydrates are in a similar range.
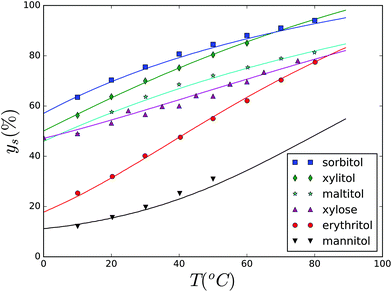 | ||
| Fig. 5 Solubility (given as a weight fraction of the solute ys) of various polyols as a function of temperature. Solubility line for xylose is also given. | ||
Now, we turn the focus on binary systems, with the solute forming hydrate crystals. We will investigate glucose, lactose and maltose, all forming monohydrate crystals. As above, we will also list the estimated parameters in Table 4.
First, we investigate the case of glucose monohydrate crystals. The experimental data are obtained from ref. 35, 36, 55, and 66. This case was investigated earlier using group theory such as UNIFAC.36,55,66 We have fitted the Flory–Huggins theory to solubility data for both glucose anhydrous and monohydrate crystals, with results shown in Fig. 6. Because of the importance of glucose in food formulations, and given the fact that it forms monohydrates, we have presented our results again in the supplemented state diagram. Phase transition lines for boiling and freezing are computed using the Flory–Huggins theory. The experimental data are obtained from ref. 35 and 36 and it can be observed that the solubility line for the monohydrate terminates at the intersection with the anhydrate crystal. At this point the monohydrate is transformed into an anhydrate crystal. In practice, this phase transition can take some time, and a supersaturated solution can form temporarily. Both the solubility lines for monohydrate and anhydrate crystals also terminate at the eutectic points on the freezing line of water. At the eutectic point ice and glucose crystals coexist.
We have two different parameter sets for each crystal type. For anhydrous glucose the fitted parameters are: Tx = 413 K, ΔHx = 38 kJ mol−1, ΔCp,x = 190 J mol−1 K−1, and γx = 0.005 J mol−1 K−2. For glucose monohydrate the fitted parameters are: Tx = 395 K, ΔHx = 40 kJ mol−1, ΔCp,x = 178 J mol−1 K−1, and γx = 0.005 J mol−1 K−2.
Our values are quite comparable to other values in the literature.36,55,66 However, it must be noted that there is a lot of variance in the values of the estimated parameters in these references. Similar to the above case of sucrose, there are multiple sets of parameter values that give similar fitting to the experimental data. This is not very surprising given the fact that there are four parameters involved.
Subsequently, we have tested the theory to the solubility of lactose, in the temperature range where it forms monohydrate crystals. The experimental data are obtained from ref. 78 and 83. The comparison between experimental data and theory is shown in Fig. 7. The fitted parameters are: Tx = 487 K, ΔHx = 80 kJ mol−1, ΔCp,x = 300 J mol−1 K−1, and γx = 0.015 J mol−1 K−2.
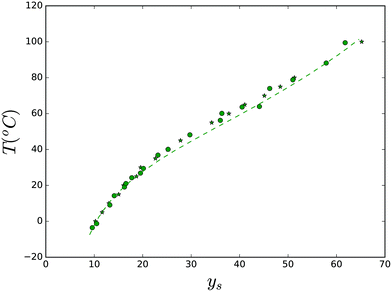 | ||
| Fig. 7 Solubility of the lactose monohydrate crystal. Lines are predictions made with the Flory–Huggins theory. Parameter values are listed in the text. | ||
Also, we have investigated the solubility of maltose in the temperature range, where it forms monohydrates. The experimental data are obtained from ref. 78. The experimental data and theory are compared in Fig. 8. The fitted parameters are: Tx = 425 K, ΔHx = 73 kJ mol−1, ΔCp,x = 400 J mol−1 K−1, and γx = 0.007 J mol−1 K−2.
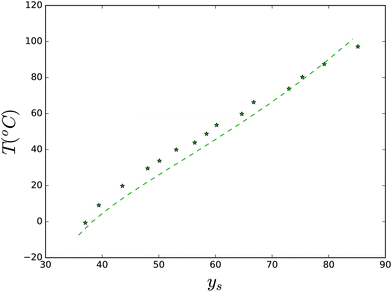 | ||
| Fig. 8 Solubility of the maltose monohydrate crystal. Lines are predictions made with the Flory–Huggins theory. Parameter values are listed in the text. | ||
4.2 Ternary systems
In food materials, where one desires to lower the sucrose content, one often uses a mixture of sucrose and another small molecular weight carbohydrate, being a polyol or other sugar. The addition of a second carbohydrate substantially changes the solubility of sucrose, and the total solubility of all solutes. Here, we like to note that it is a direct consequence of thermodynamics that the total solubility of mixtures is always higher than that of the individual compounds. This follows directly from the Gibbs–Duhem relationship.89,90Here, we investigate whether the Flory–Huggins theory can predict the solubility of both solutes in the ternary mixtures of two carbohydrates and water. Experimental data on such ternary mixtures are quite scarce. The mixtures we investigate are indicated in Table 2, together with references to the experimental data, and the temperature range the measurements are performed. One can observe that the collection of experimental data also comprises of ternary mixtures containing monohydrate crystals. These datasets will provide a good validation of our theory for monohydrate crystals.
| Compound 1 | Compound 2 | Temperature (°C) | Ref. | χ sg |
|---|---|---|---|---|
| Sucrose | Glycerol | 15–35 | 84 | 0.06 |
| Sucrose | Invert sugar | 20–70 | 36, 85 and 86 | 0.0 |
| Sucrose | Sorbitol | 25 | 87 | 0.08 |
| Sucrose | Glucose | 23, 70 | 85 and 88 | 0.0 |
| Sucrose | Maltose | 30 | 78 | −0.22 |
For the comparison of the theory and experiment, we will use most of the parameter values, as determined for binary mixtures, as listed in Table 4. We have to estimate only a single extra parameter, namely the interaction parameter between the two carbohydrates, χsg. We expect the value of χsg to be small,7 and that the prediction is not very sensitive to this value.
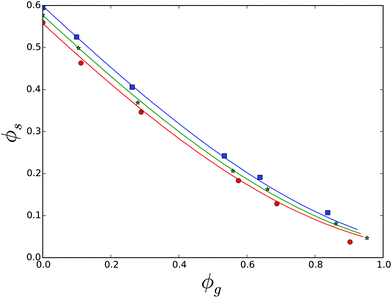
We first investigate the solubility of sucrose in aqueous glycerol solutions. The results are shown in Fig. 9. Using parameters found for the binary systems, we have fitted the ternary Flory–Huggins theory to the data with χ12 = 0.06. It is obvious that the mixture of polyol and water cannot be viewed as an effective solvent for sucrose, as is done in the case of biopolymers.5 That is because sucrose hardly dissolves in pure glycerol, in the temperature range of 15–35.91 At high volume fractions the saturated solution is very viscous, and it is hard to separate crystals from the solution.91 We think that this explains the discrepancy between theory and experiment. Other experimental data points are well explained.
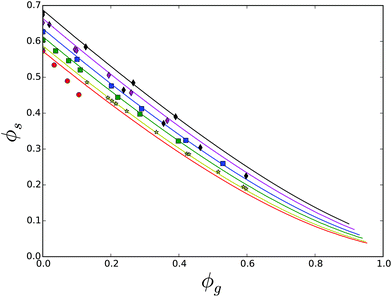
Subsequently, we have investigated the solubility of sucrose in invert sugar, which is an equimolar mixture of glucose and fructose (Fig. 10). Invert sugar does not crystallize. Given the fact that χ1w = 0.35 for both glucose and fructose, one can treat invert sugar as a single non-crystallizing compound. We have fitted the ternary Flory–Huggins theory, resulting in χ12 = 0.0. The experimental data are obtained from multiple literature sources, in the temperature range 20–70, with increments of 10 degree Celsius. The FH-theory predicts the experimental solubility data quite well for almost all temperatures, except for 20 degrees, which is probably due to experimental errors.
Another dataset comprises of solubility in the ternary mixture of sucrose, sorbitol and water.87 Parameters for the crystalline state of sorbitol are obtained from ref. 92. The theory and the experimental data are compared in Fig. 11. They agree quite well using χsg = 0.08. Observe that the figure shows two solubility lines, for sucrose (solid line), as well as for sorbitol (dashed line). The two solubility lines intersect at the eutonic point.
Now, we turn our focus to ternary mixtures, where one of the carbohydrates can form a hydrate crystal. First, we investigate the ternary mixture of sucrose, glucose and water. Note that, as we have fitted χsg already for the ternary mixture of sucrose and invert sugar, the comparison between theory and experiment can be done without any parameter fitting. All required parameter values are obtained above. The results are shown in Fig. 12. One branch of the solubility line at T = 23 °C relates to glucose monohydrate crystals, while this branch for T = 70 °C relates to glucose anhydrate crystals, which are more stable at these temperatures, see the phase diagram of glucose – Fig. 6. One can observe that the theory gives quite good predictions of the solubility lines. Again, the two solubility lines intersect at the eutonic point. We observe that the eutonic point depends on the temperature.
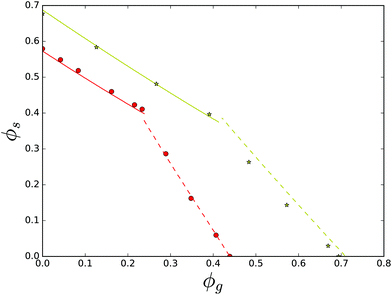 | ||
| Fig. 12 Solubility data for the ternary mixture of sucrose, glucose and water, at T = 23 °C (red symbols) and T = 70 °C (yellow symbols). Lines are predictions based on the Flory–Huggins theory, using parameter sets obtained from fitting theory to the solubility data of the binary glucose/water mixture. Note that at room temperature glucose monohydrate crystals are formed, while at 70 °C glucose anhydrate crystals are formed, as follows from the glucose state diagram, in Fig. 6. | ||
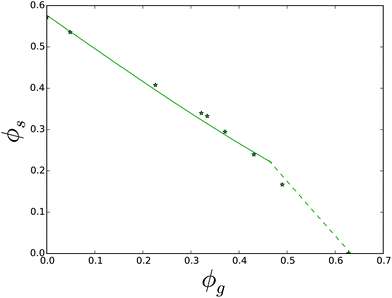
The final dataset we have analysed is that of the ternary mixture of sucrose, maltose and water. Solubility is measured at 30 °C, where maltose monohydrate crystals are formed. We have obtained a good fit of the theory with experiment using χsg = −0.22, as shown in Fig. 13. The non-linearity in the experimental data points in the sucrose branch is probably due to experimental errors. For other ternary mixtures the FH-theory predicts rather well the sucrose branches, which are all quite linear curves.
4.3 Eutonic points from deliquescence
As a final validation of our theory we compute the eutonic point of two carbohydrate crystals in equilibrium with their ternary aqueous solution. For the aqueous liquid that is in equilibrium with the two crystals, we can compute the water activity using the Flory–Huggins theory for ternary solutions, eqn (4). We compare the computed aw values with the experimental data on deliquescence of binary systems, aw,mix, taken from Mauer and coworkers.39 Predictions and experimental values are presented in Table 3. Note that in the investigated temperature range glucose crystals are present in the monohydrate form, as follows from the glucose state diagram, see Fig. 6.| Mixture | 20 °C | 25 °C | 30 °C | 35 °C | 40 °C | |
|---|---|---|---|---|---|---|
| Glucose/sucrose | Observed | 0.779 | 0.728 | 0.710 | 0.678 | 0.664 |
| Predicted | 0.778 | 0.758 | 0.739 | 0.716 | 0.691 | |
| Xylitol/sucrose | Observed | 0.723 | 0.715 | 0.704 | 0.690 | 0.677 |
| Predicted | 0.741 | 0.715 | 0.690 | 0.655 | 0.620 | |
| Xylitol/glucose | Observed | 0.723 | 0.678 | 0.650 | 0.605 | 0.559 |
| Predicted | 0.727 | 0.693 | 0.650 | 0.609 | 0.560 |
| Polyhydroxy | M s g mol−1 | ρ s kg m−3 | χ [] | T x (K) | ΔHx kJ mol−1 | ΔCp,x J mol−1 K−1 | γ p,x J mol−1 K−2 |
|---|---|---|---|---|---|---|---|
| Water | 18 | 1000 | 0.0 | 273 | — | 0 | — |
| Ethylene glycol | 62 | 1113 | 0.15 | — | — | — | |
| Glycerol | 92 | 1261 | 0.22 | — | — | — | |
| Erythritol | 122 | 1450 | 0.27 | 394 | 42.4 | 130 | 0.0075 |
| Xylitol | 152 | 1520 | 0.32 | 367 | 38.6 | 175 | 0.012 |
| Sorbitol | 182 | 1520 | 0.37 | 372 | 31.0 | 30 | 0.02 |
| Mannitol | 182 | 1520 | 0.37 | 440 | 52.9 | 318 | −0.039 |
| Maltitol | 344 | 1550 | 0.51 | 425 | 52.9 | 230 | −0.012 |
| Xylose | 150 | 1520 | 0.32 | 416 | 31.7 | 170 | −0.01 |
| Fructose | 180 | 1540 | 0.35 | 378 | 26 | — | — |
| Glucose | 180 | 1540 | 0.35 | 413 | 38 | 190 | 0.005 |
| Glucose* | 180 | 1540 | 0.35 | 395 | 40 | 178 | 0.005 |
| Sucrose | 342 | 1550 | 0.51 | 463 | 56 | 260 | 0.008 |
| Maltose* | 342 | 1550 | 0.51 | 425 | 73 | 400 | 0.007 |
| Lactose* | 342 | 1550 | 0.51 | 487 | 80 | 300 | 0.015 |
| Maltotriose | 504 | 1550 | 0.60 | — |
We have tuned the interaction parameter between the two carbohydrates in the range |χsg| ≤ 0.1 to match the experimental data. For the predictions we have used the following values: χsg = −0.05 for the sucrose/glucose mixture, χsg = 0.1 for the sucrose/xylitol mixture, and χsg = −0.05 for the xylitol/glucose mixture. One can observe that these values are in a similar range to the values of χsg obtained from solubility data, as presented in Table 2.
For the xylitol/glucose system we have obtained a very good prediction of aw at the eutonic point for all temperatures. For other systems there is a slight difference, but the trend with temperature is captured well. Concerning the experimental data Mauer and coworkers remark that for a dry mixture of binary crystals, poor contact between crystal types leads to deviations of the experimental observed values aw,mix, compared to the theoretical value. Another indication of the experimental error is obtained by comparing the value of aw,mix for sucrose and glucose at 25 degree Celsius from two different studies,38,39 which are respectively 0.78 and 0.728. Hence, one may expect an experimental error of 0.05 in aw,mix.
Mauer and coworkers have predicted aw,mix using the deliquescence data of single components, and the Ross equation and Clausius–Clapeyron equation. The deviations of our predictions and experimental values are always less than or equal to 0.05. The majority of the predictions of Mauer and coworkers deviate more than the experimental error of 0.05 from the experimental observations. This is due to the fact that no interactions between solutes are assumed (i.e. χsg = 0 is assumed), and the temperature dependence of their parameters is obtained from a limited temperature range 20 ≤ T ≤ 40 °C, while the solubility data we have used are in the range 10 ≤ T ≤ 80 °C.
5. Conclusions
In this paper we have investigated the solubility of various binary and ternary carbohydrate solutions with the Flory–Huggins theory. This investigation has been performed with the aim to be able to predict the solubility of sucrose in food matrices, where sucrose is partly replaced by another low molecular weight carbohydrate like polyols. In various sugar-rich food products the crystallinity of sucrose is an important functionality. Hence, it is advantageous if the solubility can be predicted from theory. In this paper we have shown that the Flory–Huggins theory is capable of doing that. If all parameters are obtained independently via analysis of binary mixtures, the Flory–Huggins theory can predict accurately the solubility of ternary mixtures containing sucrose. With the same theory one can also predict the deliquescence of binary mixtures of carbohydrate crystals, as we have shown above.We note that the enthalpy of carbohydrate crystals is strongly dependent on temperature, requiring three parameters to describe it (ΔHx, ΔCp,x and γp,x). These three parameters together with the melting temperature determine the chemical potential of crystals. Due to this number of parameters required to describe the crystalline system, and the variability in the experimental data, there are often multiple parameter sets that show comparable good fitting to the data. This is evident also in the variance of these parameters in the literature, where the theory is fitted to the same system. However, having obtained a parameter set that shows a reasonable fit with binary solutions, one can use this parameter set equally well for the application of the theory to ternary mixtures.
In this paper we have also resolved two additional research questions: (1) whether the Flory–Huggins interaction parameter is temperature dependent or not, and (2) whether the theory can also describe the solubility of sugars forming hydrate crystals. Our analysis shows that the interaction parameter between carbohydrates and water is indeed temperature independent. After minimization of the free energy density functional for the system with a hydrate crystal, we have obtained the condition for equilibrium described in terms of the chemical potentials on a volumetric basis  . With this condition we have been able to predict the solubility of sugars forming monohydrate crystals in both binary and ternary aqueous mixtures.
From the findings in this paper we can conclude that the Flory–Huggins theory is a highly valuable tool for the description of the thermodynamics of complex mixtures of carbohydrates. Such mixtures one encounters often in sweet food products, where sucrose is (partially) replaced by alternative sweeteners like polyols or oligosaccharides. In these products other phase transitions like boiling and biopolymer melting are important,4,93 which can also be described by the Flory–Huggins theory, as we have shown earlier.5,6 Hence, the Flory–Huggins theory can describe much of the thermodynamics occurring during the manufacturing of sweet food products with reduced sucrose levels, such as confectionery and bakery products. Understanding of the thermodynamics of these complex food systems is often improved by the use of the supplemented state diagram.25 As we have shown above for the case of sucrose and glucose, the Flory–Huggins theory can be used to predict all relevant phase transitions.
Acknowledgements
This research is part of the Strategic Innovation Programme Customized Processed Foods co-financed by the Topsector Agri & Food (BO-32.02-006-005).References
- E. A. Davis, Am. J. Clin. Nutr., 1995, 62, 170S–177S CAS.
- B. Pareyt and J. A. Delcour, Crit. Rev. Food Sci. Nutr., 2008, 48, 824–839 CrossRef CAS PubMed.
- M. Mariotti and M. Lucisano, Bakery Products Science and Technology, 2nd edn, 2014, pp. 199–221 Search PubMed.
- K. Kawai, K. Hando, R. Thuwapanichayanan and Y. Hagura, LWT-Food Sci. Technol., 2016, 66, 384–389 CrossRef CAS.
- R. van der Sman, Food Hydrocolloids, 2016, 56, 144–149 CrossRef CAS.
- R. van der Sman and M. Meinders, Soft Matter, 2011, 7, 429–442 RSC.
- R. van der Sman, Food Hydrocolloids, 2013, 32, 186–194 CrossRef CAS.
- A. Dodson and T. Pepper, Food Chem., 1985, 16, 271–280 CrossRef CAS.
- R. W. Hartel and A. V. Shastry, Crit. Rev. Food Sci. Nutr., 1991, 30, 49–112 CrossRef CAS PubMed.
- E. Ben-Yoseph and R. W. Hartel, Innovative Food Sci. Emerging Technol., 2006, 7, 225–232 CrossRef CAS.
- C. K. Lau and E. Dickinson, Colloids Surf., A, 2007, 301, 289–300 CrossRef CAS.
- R. W. Hartel, R. Ergun and S. Vogel, Compr. Rev. Food Sci. Food Saf., 2011, 10, 17–32 CrossRef CAS.
- E. Miller and R. W. Hartel, J. Food Eng., 2015, 153, 28–38 CrossRef CAS.
- M. Kweon, L. Slade, H. Levine, R. Martin and E. Souza, Cereal Chem., 2009, 86, 425–433 CrossRef CAS.
- B. Pareyt, F. Talhaoui, G. Kerckhofs, K. Brijs, H. Goesaert, M. Wevers and J. A. Delcour, J. Food Eng., 2009, 90, 400–408 CrossRef CAS.
- E. I. Zoulias, V. Oreopoulou and E. Kounalaki, J. Sci. Food Agric., 2002, 82, 1637–1644 CrossRef CAS.
- S. Struck, D. Jaros, C. S. Brennan and H. Rohm, Int. J. Food Sci. Technol., 2014, 49, 1963–1976 CrossRef CAS.
- R. Riedel, B. Böhme and H. Rohm, Int. J. Food Sci. Technol., 2015, 50, 1338–1344 CrossRef CAS.
- L. Doescher and R. Hoseney, Cereal Chem., 1985, 62, 263–266 Search PubMed.
- T. Taylor, O. Fasina and L. Bell, J. Food Sci., 2008, 73, S145–S151 CrossRef CAS PubMed.
- L. Laguna, K. J. Vallons, A. Jurgens and T. Sanz, Food Bioprocess Technol., 2013, 6, 3143–3154 CrossRef CAS.
- L. Laguna, C. Primo-Martín, A. Salvador and T. Sanz, J. Food Sci., 2013, 78, S777–S784 CrossRef CAS PubMed.
- R. van der Sman and A. van der Goot, Soft Matter, 2009, 5, 501–510 RSC.
- R. Van der Sman, Adv. Colloid Interface Sci., 2012, 176, 18–30 CrossRef PubMed.
- L. Slade, H. Levine, J. Ievolella and M. Wang, J. Sci. Food Agric., 1993, 63, 133–176 CrossRef CAS.
- B. Cuq, J. Abecassis and S. Guilbert, Int. J. Food Sci. Technol., 2003, 38, 759–766 CrossRef CAS.
- R. van der Sman and J. Broeze, J. Phys.: Condens. Matter, 2014, 26, 464103 CrossRef CAS PubMed.
- R. van der Sman and J. Broeze, Food Funct., 2014, 5, 3076–3082 CAS.
- R. Gómez and J. Fernandez-Salguero, Food Chem., 1992, 45, 91–93 CrossRef.
- R. Van der Sman and E. Boer, J. Food Eng., 2005, 66, 469–475 CrossRef.
- T. P. Labuza and B. Altunakar, Water activity in foods: fundamentals and applications, 2007, vol. 1 Search PubMed.
- G. G. Ribero, A. C. Rubiolo and S. E. Zorrilla, J. Food Eng., 2007, 81, 157–161 CrossRef.
- R. van der Sman, Food Hydrocolloids, 2012, 27, 529–535 CrossRef CAS.
- M. Starzak and M. Mathlouthi, Food Chem., 2006, 96, 346–370 CrossRef CAS.
- F. E. Young, J. Phys. Chem., 1957, 61, 616–619 CrossRef CAS.
- A. M. Peres and E. A. Macedo, Fluid Phase Equilib., 1996, 123, 71–95 CrossRef CAS.
- L. J. Mauer and L. S. Taylor, Annu. Rev. Food Sci. Technol., 2010, 1, 41–63 CrossRef CAS PubMed.
- A. K. Salameh, L. J. Mauer and L. S. Taylor, J. Food Sci., 2006, 71, E10–E16 CrossRef CAS.
- R. A. Lipasek, N. Li, S. J. Schmidt, L. S. Taylor and L. J. Mauer, J. Agric. Food Chem., 2013, 61, 9241–9250 CrossRef CAS PubMed.
- P. J. Flory, J. Chem. Phys., 1942, 10, 51–61 CrossRef CAS.
- R. G. M. van der Sman and M. B. J. Meinders, Soft Matter, 2011, 7, 429–442 RSC.
- R. van der Sman, Food Hydrocolloids, 2012, 27, 529–535 CrossRef CAS.
- J. Vrentas and C. Vrentas, Macromolecules, 1991, 24, 2404–2412 CrossRef CAS.
- S. Bekiranov, R. Bruinsma and P. Pincus, Phys. Rev. E: Stat. Phys., Plasmas, Fluids, Relat. Interdiscip. Top., 1997, 55, 577 CrossRef CAS.
- A. Halperin, Eur. Phys. J. B, 1998, 3, 359–364 CrossRef.
- Y. Roos, J. Food Eng., 1995, 24, 339–360 CrossRef.
- P. Buera, C. Schebor and B. Elizalde, J. Food Eng., 2005, 67, 157–165 CrossRef.
- Y. H. Roos, M. Karel, T. P. Labuza, H. Levine, M. Mathlouthi, D. Reid, E. Shalaev and L. Slade, J. Agric. Food Chem., 2013, 61, 3167–3178 CrossRef CAS PubMed.
- C. Huang, M. O. de La Cruz and B. Swift, Macromolecules, 1995, 28, 7996–8005 CrossRef CAS.
- S. Emmanuel, A. Cortis and B. Berkowitz, Chem. Phys., 2004, 302, 21–30 CrossRef CAS.
- C. Hsu and J. Prausnitz, Macromolecules, 1974, 7, 320–324 CrossRef CAS.
- F. W. Altena and C. Smolders, Macromolecules, 1982, 15, 1491–1497 CrossRef CAS.
- L. Yilmaz and A. McHugh, J. Appl. Polym. Sci., 1986, 31, 997–1018 CrossRef CAS.
- J. Prausnitz, Fluid Phase Equilib., 1999, 158, 95–111 CrossRef.
- M. Catte, C.-G. Dussap, C. Achard and J.-B. Gros, Fluid Phase Equilib., 1994, 96, 33–50 CrossRef CAS.
- D. Kashchiev and A. Firoozabadi, J. Cryst. Growth, 2002, 241, 220–230 CrossRef CAS.
- R. Masoudi, B. Tohidi, A. Danesh, A. C. Todd, R. Anderson, R. W. Burgass and J. Yang, Chem. Eng. Sci., 2005, 60, 4213–4224 CrossRef CAS.
- P. Paricaud, J. Phys. Chem. B, 2010, 115, 288–299 CrossRef PubMed.
- C. R. Berland, G. M. Thurston, M. Kondo, M. L. Broide, J. Pande, O. Ogun and G. B. Benedek, Proc. Natl. Acad. Sci. U. S. A., 1992, 89, 1214–1218 CrossRef CAS.
- C. Fontan and J. Chirife, Int. J. Food Sci. Technol., 1981, 16, 21–30 CrossRef.
- C. Marcolli and T. Peter, Atmos. Chem. Phys, 2005, 5, 1545–1555 CrossRef CAS.
- L. Ninni, M. Camargo and A. Meirelles, J. Chem. Eng. Data, 2000, 45, 654–660 CrossRef CAS.
- J. Spitzer, I. Tasker and R. Wood, J. Solution Chem., 1984, 13, 221–232 CrossRef CAS.
- S. A. Cooke, S. Ó. Jónsdóttir and P. Westh, J. Chem. Eng. Data, 2002, 47, 1185–1192 CrossRef CAS.
- C. Chen and S. Nagy, Trans. ASAE, 1987, 30, 1176–1180 CrossRef CAS.
- L. B. Gaïda, C. Dussap and J. Gros, Food Chem., 2006, 96, 387–401 CrossRef.
- J. Ubbink, M. Giardiello and H. Limbach, Biomacromolecules, 2007, 8, 2862–2873 CrossRef CAS PubMed.
- I. Mokbel, T. Sawaya, M.-L. Zanota, R. A. Naccoul, J. Jose and C. De Bellefon, J. Chem. Eng. Data, 2012, 57, 284–289 CrossRef CAS.
- C. E. Velezmoro, A. L. Oliveira, F. A. Cabral and A. J. Meirelles, J. Chem. Eng. Jpn., 2000, 33, 645–653 CrossRef CAS.
- J. Taylor and J. Rowlinson, Trans. Faraday Soc., 1955, 51, 1183–1192 RSC.
- G. J. Maximo, A. J. Meirelles and E. A. Batista, Fluid Phase Equilib., 2010, 299, 32–41 CrossRef CAS.
- W. Dunning, H. Evans and M. Taylor, J. Chem. Soc. (Resumed), 1951, 2363–2372 RSC.
- G. Ganbavale, C. Marcolli, U. Krieger, A. Zuend, G. Stratmann and T. Peter, Atmos. Chem. Phys., 2014, 14, 9993–10012 CrossRef.
- Y. Roos and M. Karel, Int. J. Food Sci. Technol., 1991, 26, 553–566 CrossRef.
- C. Lerici, M. Piva and M. D. Rosa, J. Food Sci., 1983, 48, 1667–1669 CrossRef CAS.
- G. Blond, D. Simatos, M. Catté, C. G. Dussap and J. B. Gros, Carbohydr. Res., 1997, 298, 139–145 CrossRef CAS.
- R. Van Der Sman, J. Phys. Chem. B, 2013, 117, 16303–16313 CrossRef CAS PubMed.
- O. Ferreira, E. A. Brignole and E. A. Macedo, Ind. Eng. Chem. Res., 2003, 42, 6212–6222 CrossRef CAS.
- K. O'Donnell and M. Kearsley, Sweeteners and sugar alternatives in food technology, John Wiley & Sons, 2012 Search PubMed.
- E. A. Martínez, M. Giulietti, M. Uematsu, S. Derenzo and J. B. Almeida e Silva, Chemical Product and Process Modeling, 2011, vol. 6 Search PubMed.
- Y. Roos, Carbohydr. Res., 1993, 238, 39–48 CrossRef CAS.
- G. Diarce, I. Gandarias, A. Campos-Celador, A. García-Romero and U. Griesser, Sol. Energy Mater. Sol. Cells, 2015, 134, 215–226 CrossRef CAS.
- G. Vuataz, Lait, 2002, 82, 485–500 CAS.
- M. W. Fey, C. Weil and J. Segur, Ind. Eng. Chem., 1951, 43, 1435–1436 CrossRef CAS.
- R. F. Jackson and C. G. Silsbee, J. Franklin Inst., 1924, 198, 546–547 CrossRef.
- B. Smythe, Aust. J. Chem., 1967, 20, 1097–1114 CrossRef CAS.
- E. S. Arnista, L. F. Greenberg, M. Barr and L. F. Tice, J. Am. Pharm. Assoc., 1956, 45, 45–47 CrossRef CAS.
- Y. Abed, N. Gabas, M. Delia and T. Bounahmidi, Fluid Phase Equilib., 1992, 73, 175–184 CrossRef CAS.
- A. S. Wexler and J. H. Seinfeld, Atmos. Environ., Part A, 1991, 25, 2731–2748 CrossRef.
- L. J. Mauer and L. S. Taylor, Pharm. Dev. Technol., 2010, 15, 582–594 CrossRef CAS PubMed.
- J. Segur and C. Miner, J. Agric. Food Chem., 1953, 1, 567–569 CrossRef CAS.
- A. P. Carneiro, C. Held, O. Rodríguez, G. Sadowski and E. A. Macedo, J. Phys. Chem. B, 2013, 117, 9980–9995 CrossRef CAS PubMed.
- M. Kweon, L. Slade, H. Levine and D. Gannon, Crit. Rev. Food Sci. Nutr., 2014, 54, 115–138 CrossRef CAS PubMed.
| This journal is © The Royal Society of Chemistry 2017 |

