
The role of chloride ions in plasma-activated water treatment processes†
Ghazaleh
Haghighat
,
Amirreza
Sohrabi
 *,
Parmiss Mojir
Shaibani
,
C. W.
Van Neste
,
Selvaraj
Naicker
and
Thomas
Thundat
*,
Parmiss Mojir
Shaibani
,
C. W.
Van Neste
,
Selvaraj
Naicker
and
Thomas
Thundat
Department of Chemical and Materials Engineering, University of Alberta, Edmonton, AB T6G 1H9, Canada. E-mail: sohrabi@ualberta.ca; Tel: +1 780 667 7914
First published on 21st November 2016
Abstract
The effect of chloride ions (Cl−) on the efficiency of hydroxyl-based (OH˙) water treatment processes, especially plasma treatment systems, remains controversial with conflicting reports of enhanced and deteriorating roles. In this study, we show that during the plasma treatment stage, the scavenging nature of Cl− towards OH˙ decreases the percentage of contaminant removal. On the other hand, the percentage of contaminant removal increases during the post-treatment phase due to the formation of singlet oxygen (1O2) from the reaction of hypochlorous acid (HOCl) and hydrogen peroxide (H2O2). Our results show that there exists an optimum Cl− concentration at which the removal percentage is at its maximum. We also investigated the effect of pH on the role of Cl−. We present possible solution characteristic-dependent reaction pathways and their effect on the treatment process.
Water impactChlorine ions can be present in wastewater at various concentrations. The effect of these ions on the performance of advanced oxidation processes, especially plasma-based methods, has been controversial. This study examines the role of chlorine ions and outlines the chemical mechanisms involved in the treatment and post treatment stages of non-thermal plasma treatment of water. |
1. Introduction
The pollution of water by various dye compounds has been regarded as a severe environmental problem for decades. Based on a recent statistical study, approximately 10–15% of dye compounds used in various industries (textile, paper, pharmaceutical, oil and gas, etc.) are discharged into the wastewater every year.1,2 The untreated dye compounds can disrupt the reoxygenation capacity of the water body and partially absorb the sunlight. As a result, biological activities can be disturbed. Moreover, studies showed that some of the dye molecules and their by-products are highly carcinogenic. The problem becomes more acute considering the fact that the conventional water treatment processes are not effective against many dye molecules. This is due to the stable structure of these molecules in water.3–7 As a result, many researchers have studied different water treatment approaches to identify the best candidates for replacement of orthodox methods.Amongst the various studied approaches, advanced oxidation processes (AOPs) are regarded as the most suitable treatments for destruction of contaminations with a persistent nature. In general, AOPs are based on the in situ generation of highly reactive transient oxidizing agents, such as hydroxyl radicals (OH˙).8 These oxidizing agents are able to breakdown contaminants within the liquid and are very effective in water remediation.9,10 Production of these oxidizing agents can be achieved through various means including ultraviolet (UV) irradiation,11 photocatalysis,12 Fenton processes,13 electrochemistry and electrolytic mineralization14 to name a few. Amongst all of the proposed AOPs, the application of non-thermal plasma (NTP) for decontamination purposes has gained the attention of many researchers. This is due to the synergistic production of various chemical agents such as hydroxyl radicals, atomic oxygen and hydrogen, hydrogen peroxide (H2O2), etc.15–19 The presence of a variety of active agents makes plasma-based decontamination methods very effective. Moreover, in most of the above-mentioned AOPs, the addition of one or more constituents of the process is required. The necessity of adding H2O2 in UV/H2O2 and Fenton processes and the need for addition and subsequent removal of the photocatalyst in the photocatalysis process make these treatment methods less practical. On the other hand, in a plasma-based treatment process, UV light, H2O2 and ozone are produced simultaneously in the process by virtue of the plasma. This fact alongside the variety of oxidizing agents created by plasma make plasma-driven water treatment processes more advantageous compared to other AOPs. Removal of several dyes such as methylene blue (MB),1 DO39 and RR45,2 Chicago sky blue,4 Polar Brilliant B (PBB),6 Direct red 79 and Direct blue 106 (ref. 20) and Sunset yellow21 has been investigated.
One essential aspect of any AOP treatment system, especially plasma-based approaches, is the characteristics of the solution under treatment. The nature of the contaminant and its concentration, the electrolyte constituents, and the pH of the solution are amongst the most important solution properties studied. Methylene blue (MB) is a dye frequently used in the textile industry. In this industry, during the dyeing of textiles, salts such as sodium chloride are added to the bath to aid the process.22 As a result, the effluent of the textile industry can contain various concentrations (in the range of 100–5000 mg l−1 (ref. 23 and 24)) of chloride.25 The effect of chloride (Cl−) on the removal efficiency of various AOP treatment systems, including plasma-based methods6,26–30 and UV and UV/H2O2 based treatments,31,32 has been investigated previously. In general, the scavenging properties of Cl− towards OH˙ are well accepted.3,31–35 However, conflicting results regarding the effect of Cl− on the contamination removal efficiency have been reported. Researchers such as Pignatello et al. and Kiwi et al. point towards the inhibitory role of Cl−.13,36–38 In other words, the presence of Cl− reduces the degradation capability of the AOP system studied. This phenomenon is attributed to the scavenging properties of Cl− towards OH˙. As a result, various chlorine-based active species including chlorine radical anions (Cl2˙−) are formed. These newly formed species are less active and are not as powerful as OH˙. On the other hand, Liang et al. observed that the presence of Cl− in the solution can promote the degradation of contaminants.39 This discrepancy can be associated with the nature of the contaminations and the concentration of Cl−. As described by Yang et al., halogen radicals such as Cl2˙− are more selective than OH˙ in reacting with electron-rich organic molecules. Moreover, during the degradation of a textile azo dyestuff (R3BS), Ramjaun et al. observed that the removal efficiency depends on the concentration of Cl−. For [Cl−] < 0.01 M, the removal efficiency of the dye decreased; however, higher concentrations of Cl− helped in the decontamination process.28 Another solution characteristic that can significantly influence the removal efficiency is the pH of the solution. The effect of pH on the contamination degradation is also dependent on the nature of the contamination.40 While the removal of contaminants such as methylene blue is promoted under acidic conditions,1 the removal of phenol is faster under alkaline conditions.40,41 Various lines of reasoning have been used to justify the effect of the pH of the solution including the acid–base equilibrium of dye molecules,40,41 the effect of alkaline conditions on OH˙, etc.5,28,40,42
In this work, by using methylene blue (MB) as a model contaminant, we will attempt to:
1) show that the role of Cl− in the treatment stage (in the presence of plasma) and post treatment stage (in the absence of plasma) is different;
2) propose and prove a chemical mechanism that relates the obtained results to the possible chemical mechanisms;
3) study and explain the role of the initial pH of the solution based on the proposed mechanism.
2. Experimental
2.1. Materials
Methylene blue (MB) (obtained from Sigma Aldrich, Ontario, Canada) was the target contaminant used throughout this study due to its ease of quantification through optical methods. In order to study the effect of Cl− concentration, sodium chloride (NaCl, certified ACS crystalline supplied by Fisher Scientific, Ontario, Canada) was added to MilliQ water. Various concentrations of Cl− used in this study include 0, 10, 50, 100, 150 and 250 mg l−1. The above-mentioned chemicals were used without further purification. The water samples created for treatment were prepared by dissolving the above-mentioned concentrations of NaCl and 0.75 mg l−1 MB in MilliQ water. In order to investigate the effect of the initial pH of the solution, the concentrations of NaCl and MB were fixed at 50 mg l−1 and 0.75 mg l−1, respectively. The initial pH of the solution was adjusted by adding a sufficient amount of HCl or NaOH (0.1 M). Three initial pH values of 2.8, 6.4 and 10.12 were used in this study, representing the initial acidic, near neutral and alkaline conditions, respectively. Finally, to investigate the effect of the initial MB concentration, five concentrations of 0.75, 1.25, 2, 3 and 3.75 mg l−1 were tested; the concentration of NaCl and the initial pH of the solution were fixed at 50 mg l−1 and 6.4, respectively. It has to be mentioned that higher concentrations of MB create highly opaque solutions where accurate in situ optical measurement (see section 2.2) of the concentration is not possible.2.2. Experimental setup
Fig. 1 shows the schematic illustration of the experimental setup. To generate plasma from a single electrode, a sinusoidal wave at the resonance frequency of the helical resonator (1.7 MHz) is supplied by a function generator (Agilent 33522A, CA, USA) and fed to a power amplifier (2100 L RF power amplifier, E&I Inc., NY, USA). More information on the working principles of the helical resonator is available in our previous publication.43 The output of the power amplifier is used as the input for the helical resonator. The input voltage and current to the helical resonator are measured by means of an oscilloscope (TDS 2024C, Tektronix, OR, USA) and a current probe (CT2, Tektronix, OR, USA) connected to the oscilloscope, respectively (as shown in Fig. 1). The power input to the helical resonator was calculated by multiplying Vrms and Irms (rms values of the input voltage and current) with their corresponding phase angle (which was zero degrees when tuned to resonance43 and producing plasma). 45 ± 1 ml of the solution was poured into a glass beaker (50 ml, Fisher Scientific, Ontario, Canada) in each test. All the experiments were performed with 15 min of treatment stage (in the presence of plasma, t = 0 to t = 15 min) and 45 min of post treatment stage (in the absence of plasma, t = 15 to t = 60 min).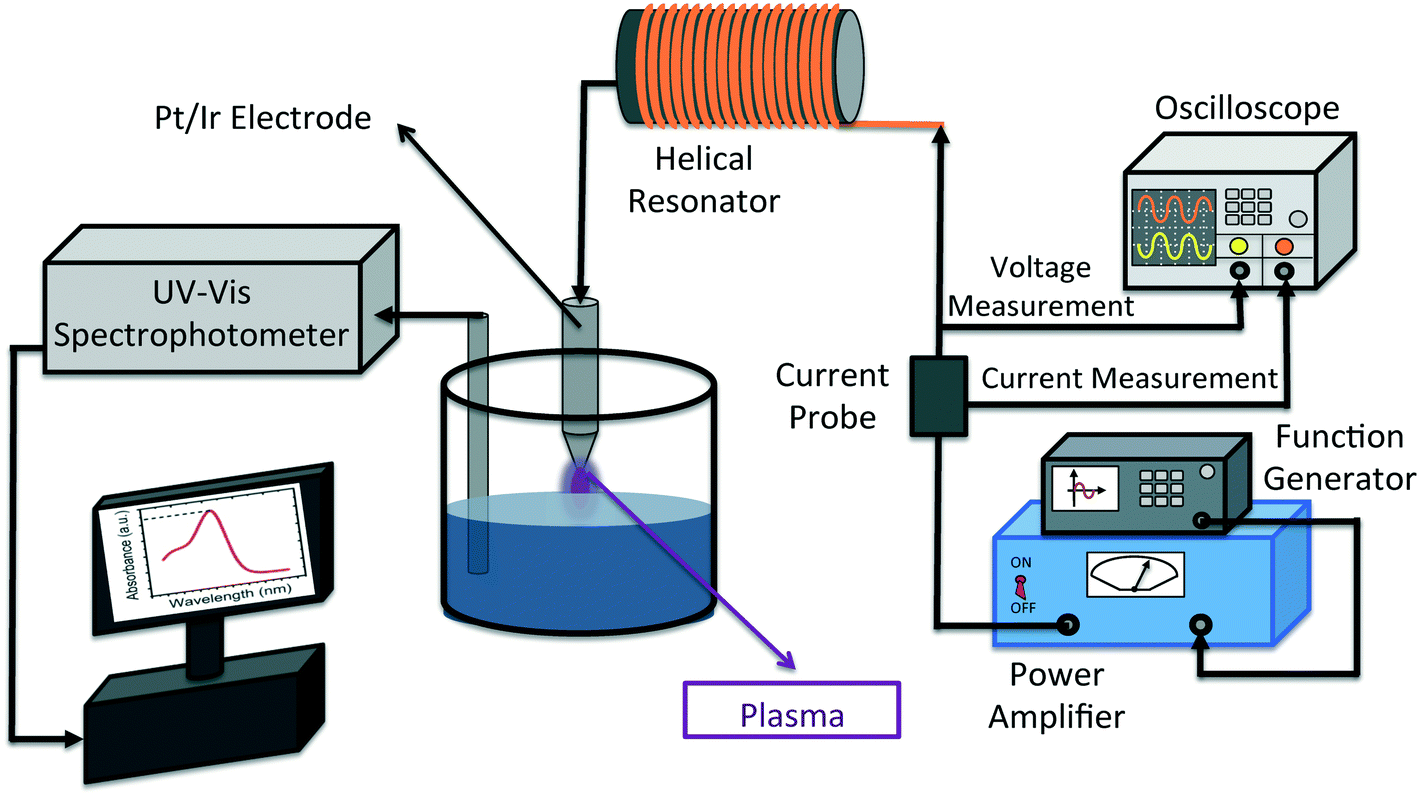 | ||
| Fig. 1 The schematic of the experimental setup used in this study is illustrated. A sinusoidal wave is supplied to the power amplifier by the function generator. The output of the power amplifier is directly connected to the helical resonator. The input voltage and current to the resonator are monitored using an oscilloscope. The concentration of MB in the solution is measured using a UV-vis spectrophotometer equipped with an optic fiber probe for in situ measurements. Magnetic stirring of the solution is used to ensure the homogeneity of the concentration during all experiments. | ||
The distance between the electrode tip and water surface (air gap distance) and the input voltage to the resonator were kept constant at 2 mm and 70 V, respectively. In order to monitor the concentration of MB in the solution during the treatment stage and also the post treatment stage, a UV-vis spectrophotometer, equipped with fiber optics for in situ measurement, was utilized (Varian Carey 50, Agilent, USA). Removal% of MB is calculated by means of eqn (1):
 | (1) |
In eqn (1), C and C0 represent the concentration of MB at any point in time during the experiment and the initial concentration of MB, respectively. It has to be mentioned that the concentration of MB was calculated from the maximum absorption at 667 nm, considering the previously obtained calibration curve (data are not shown). The energy yield of the process can be calculated by means of eqn (2), as follows:44
 | (2) |
In eqn (2), C0 is the initial concentration of MB in g l−1, V is the volume of the treated sample, R is the final removal% at t = 60 min, P is the power input to the helical resonator in kW and t is the duration in which power is consumed (in h). Pt/Ir electrodes (conical shaped with the tip diameter of approximately 0.5 mm) were used for the generation of plasma, due to their stability at high temperatures. Magnetic stirring of the solution was employed to assure the homogeneity of the solution and correct measurement of the optical spectrum. Each experiment was performed in triplicate to ensure the repeatability of the treatment process. The treatment chamber was semi-sealed during each experiment. In other words, although the top of the chamber was capped with a lid, the opening for the insertion of the UV-vis spectrophotometer probe was not sealed. Complete sealing of the chamber by closing the probe opening and wrapping the lid with multiple layers of Parafilm® proved to be insignificant in the final removal percentage of the process (data are not shown). Conductivity and pH values of the solutions were measured using a Fisher Scientific Accumet® Excel conductivity meter (XL60, Ontario, Canada) and a Metller Toledo FiveEasy® pH meter equipped with an InLab® Expert Pro-ISM probe (Ohio, USA), respectively.
2.3. Characterization
In order to characterize the treated and untreated solutions in terms of their inorganic and organic constituents, ion chromatography (IC) and mass spectrometry (MS) analyses were carried out, respectively. In each analysis, two sets of samples were prepared. In the first set, MilliQ water was used as the water matrix. The second set of samples were prepared by adding NaCl (50 mg l−1) to MilliQ water as the water matrix. In both sets, the concentration of MB was fixed at 0.75 mg l−1. IC analysis was performed using a Dionex ion chromatography (DX 600, CA, USA) instrument with an injection loop volume of 25 μl. Sodium carbonate (Na2CO3) solution with a concentration of 9 mM was used as the eluent. Calibration standards were prepared in-house, and the calibration was verified using an external reference solution purchased from SCP Science (Quebec, Canada).RP-HPLC–MS was performed using an Agilent 1200 SL HPLC system. Chromatographic separation was performed using a Kinetex EVO C18 column with guard (Phenomenex, 2.1 mm internal diameter, 50 mm length, 1.6 μm particle size) at 40 °C. The buffer gradient system was composed of 0.1% formic acid in water as mobile phase A and 0.1% formic acid in acetonitrile (ACN) as mobile phase B. Samples were loaded onto the column at a flow rate of 0.5 ml min−1 and an initial buffer composition of 98% mobile phase A and 2% mobile phase B. After injection, the column was washed under the initial loading conditions for 1 min followed by elution of the analytes by using a linear gradient in the form of 2% to 40% mobile phase B over a period of 6 min, 40% to 98% mobile phase B over a period of 3 min, held at 98% mobile phase B for 4 min to remove all analytes from the column and back to 2% mobile phase B over 1 min. Mass spectra were acquired in positive mode of ionization using an Agilent 6220 Accurate-Mass TOF HPLC-MS system (Santa Clara, CA, USA) equipped with a dual sprayer electrospray ionization source with the second sprayer providing a reference mass solution. Mass spectrometry conditions were as follows: drying gas 9 l min−1 at 300 °C, nebulizer pressure of 20 psi, mass range of 100–1000 Da, acquisition rate of ∼1.03 spectra s−1, fragmentor voltage of 175 V, skimmer voltage of 65 V and capillary voltage of 3500 V. Mass correction was performed for every individual spectrum using peaks at m/z 121.0509 and 922.0098 from the reference solution. Data acquisition was performed using the Mass Hunter software package (ver. B.04.00.). Analysis of the HPLC–MS data was carried out using Agilent Mass Hunter Qualitative Analysis software (ver. B.07.00).
3. Results and discussion
3.1. Effect of Cl− concentration
The effect of variation in the electrolyte concentration (NaCl) on methylene blue removal efficiency is investigated. In all experiments, the duration of the treatment stage (when plasma is present) and that of the post treatment stage (in the absence of plasma) are 15 min and 45 min, respectively (t = 0 min to t = 15 min for the treatment stage and t = 15 min to t = 60 min for the post treatment stage). The initial pH of the solutions was set to be near neutral (6.4–6.7). Fig. 2(a) illustrates the overall removal% and changes in the conductivity of the solution as a function of NaCl concentration. A local maximum in removal% at the NaCl concentration range of 10–50 mg l−1 could be observed. Moreover, in the absence of NaCl (0 mg l−1), the overall removal% is significantly lower. Removal of MB in the treatment stage and in the absence of NaCl (about 50% removal) can be attributed to the action of hydroxyl radicals (OH˙) on the MB molecules. In order to understand the obtained results, a description of possible chemical reactions should be considered.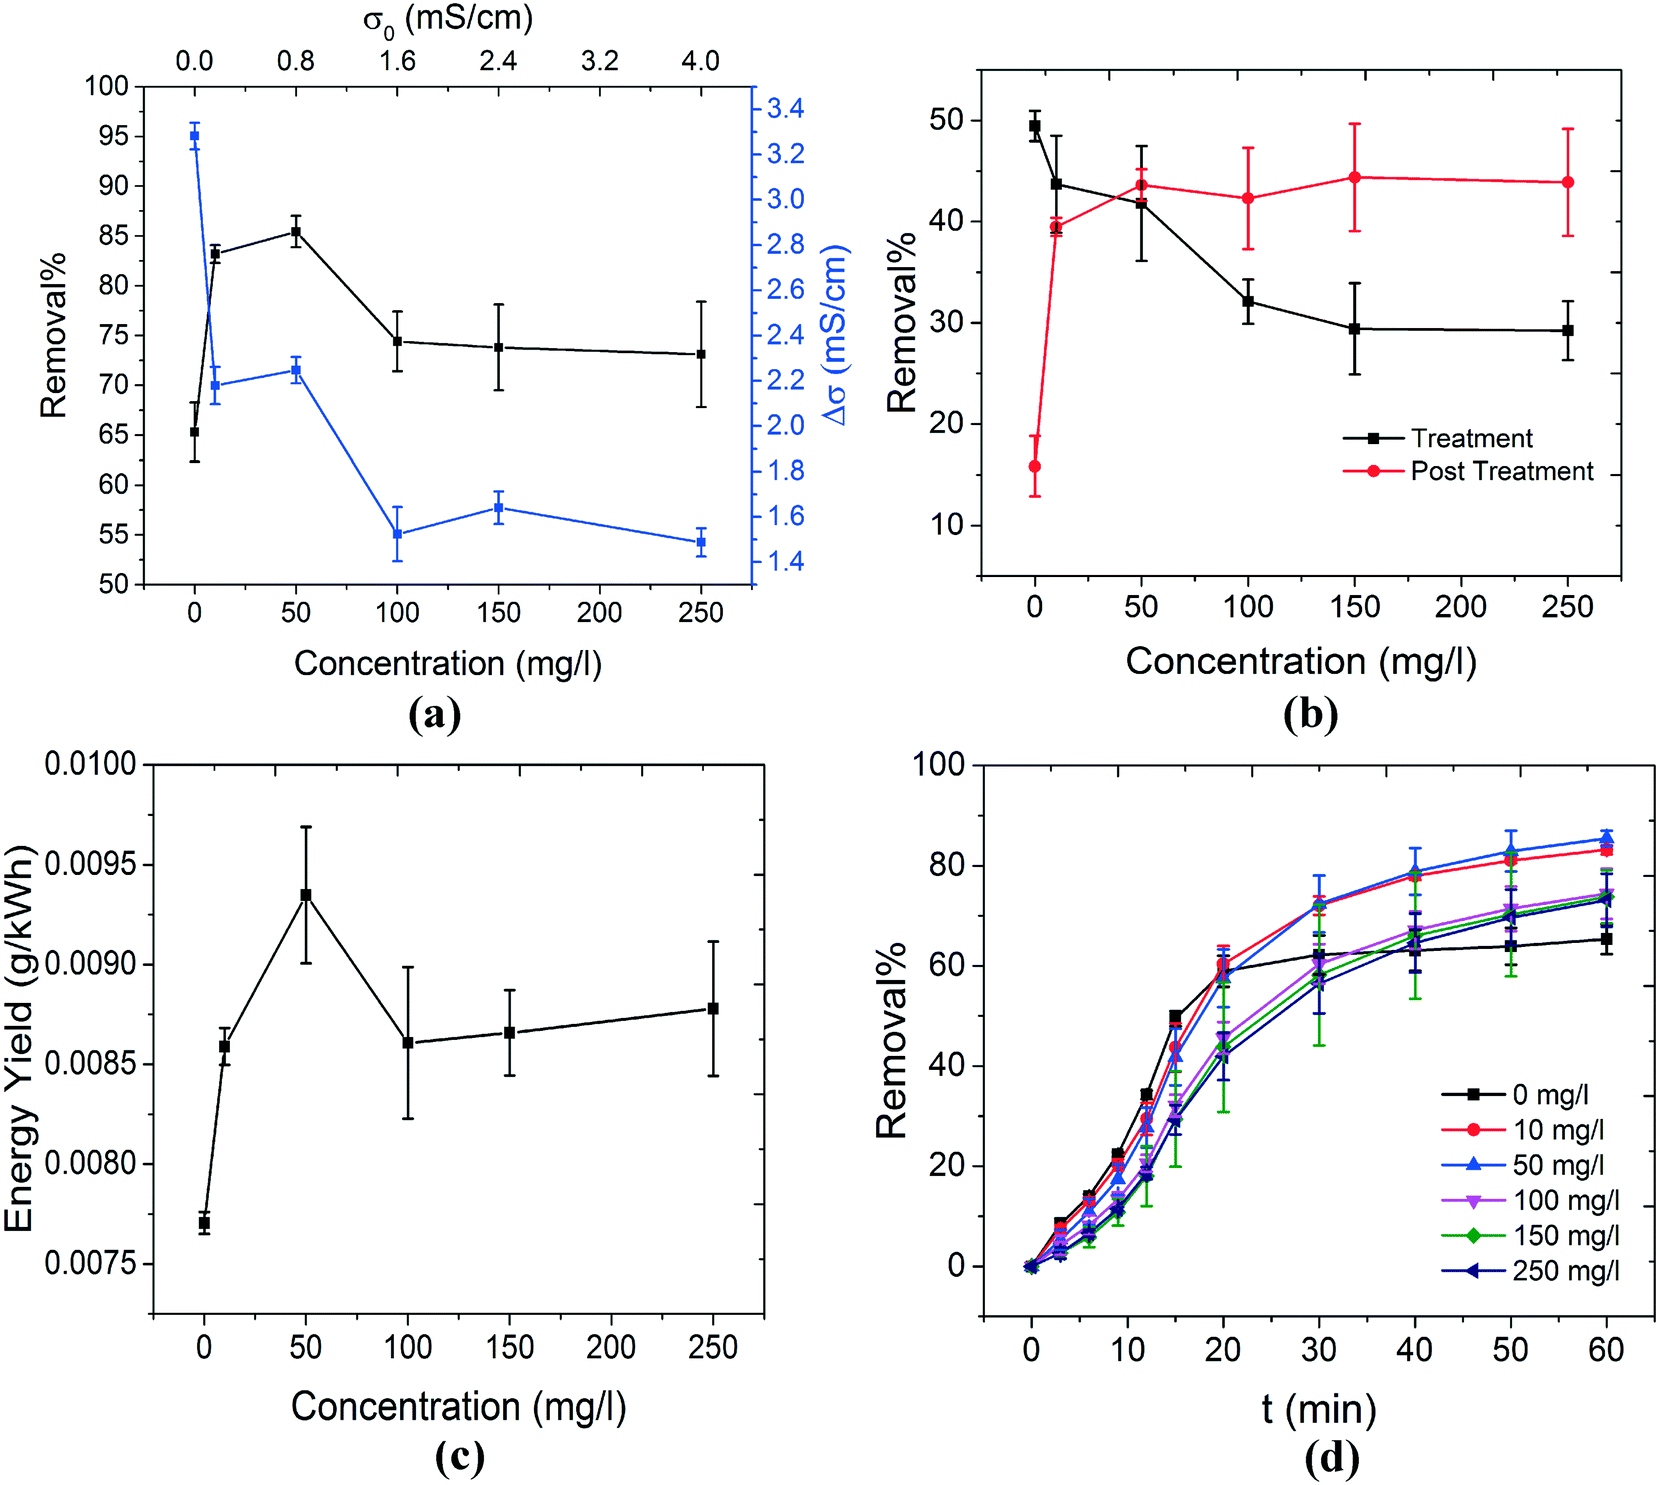 | ||
| Fig. 2 The effect of NaCl concentration on the decontamination of MB is studied. (a) The change in the overall removal% and conductivity of the solution as a function of NaCl concentration is shown. The overall removal% has a maximum in the NaCl concentration range of 10–50 mg l−1. In order to understand this behavior, removal% values during the treatment and post treatment stages as a function of NaCl concentration were compared separately, as shown in (b). The removal% during the treatment stage is maximum when no NaCl is added to the solution. The addition of the salt to the solution reduced the removal% during this stage. This can be explained by the scavenging behavior of Cl− towards OH˙. It has been shown that when Cl− scavenges OH˙, amongst various Cl-based by-products, Cl2˙− is dominant.33 Although Cl2˙− can oxidize MB, its oxidation potential is much lower than that of OH˙. As a result, removal% during the treatment stage decreases when NaCl concentration increases. On the other hand, removal% during the post treatment stage was enhanced significantly when NaCl was introduced to the solution. This can be explained by the formation of singlet oxygen (1O2) from the reaction of HOCl and H2O2; both of which are produced due to the action of plasma and are stable enough to induce MB degradation after the plasma is extinguished. It can be hypothesized that upon the addition of NaCl, an optimum NaCl concentration (around 50 mg l−1) exists where the negative effect of Cl− (scavenging properties) and its positive role (production of 1O2) are balanced. This is reflected in the energy yield of the system, as shown in (c). Finally, the change in overall removal% as a function of time is shown in (d). The significant continuation of MB removal during the post treatment stage only exists when NaCl is present in the solution. | ||
The most important reaction during the plasma treatment of aqueous solutions is the interaction between the energetic electrons and water molecules. This interaction can proceed in various ways, depending on the energy of the electron. A list of possible interactions is given by Joshi et al.40 It has to be mentioned that electrons obtain a range of energy values in the form of a Gaussian distribution. Further discussions on these physical phenomena are not the scope of this work. At lower electron energy (<1 eV), momentum transfer to the water molecules and rotational and vibrational excitation of water molecules (H2O*) occur. At higher electron energy (>7 eV), water molecules dissociate. This process is shown in reaction (3). The direct result of this reaction is the formation of hydroxyl radicals. These radicals are the most powerful oxidizing agents and they are formed due to the collision of energetic electrons and water molecules.40
| H2O → OH˙ + H˙ | (3) |
It has to be mentioned that the formation of hydroxyl radicals from excited states of water molecules is also possible through collisional relaxation.40 Finally, the collision of energetic electrons and water molecules can happen either in the gas phase (with moisture in the air) or at the air/water interface. Since the lifetime of these radicals is very short (a few microseconds45), effective introduction of hydroxyl radicals created in the bulk of the gas to the water is nearly impossible. However, hydroxyl radicals produced in a thin air layer close to the air/water interface alongside the radicals created by the collision of electrons and the water interface can diffuse to the surface of the water. These radicals can effectively degrade contaminants that come to the surface. Moreover, hydroxyl radicals can participate in a series of side reactions to produce other oxidizing agents. One of the by-products of reaction (3) is the formation of hydrogen peroxide (H2O2):40
| OH˙ + OH˙ → H2O2 | (4) |
Hydrogen peroxide is also an oxidizing agent (oxidation potential of 1.78 V); however, our results show that even at very high concentrations of H2O2 (120 mM), MB shows small discoloration (about 5%) (Fig. S1(a) in the ESI†). These high concentrations of H2O2 significantly exceed the values we measured in our experiments (approximately 1.2 mM), as shown in Fig. S1(b).† The concentration of H2O2 was measured using previously published methods based on the application of the fluorescence probe, Amplex Red.46,47
The removal of MB during the post treatment stage in the absence of NaCl can be explained by the introduction of nitrogen-based compounds to the solution from plasma. The overall chemical reactions involved have been studied by Lukes et al., Brisset et al., Fridman et al., etc.48–52 The reactions can be expressed as follows:
| NO2(aq) + NO2(aq) + H2O(l) ↔ NO2− + NO3− + 2H+ | (5) |
| NO(aq) + NO2(aq) + H2O(l) ↔ 2NO2− + 2H+ | (6) |
In reactions (5) and (6), NO(aq) and NO2(aq) are introduced after the dissociation of N2 and O2 in air by collisions with electrons in plasma. The direct consequence of these phenomena is the introduction of nitrite and nitrate ions to the solution as shown in reactions (5) and (6). In addition, formation of H+ in the solution means that the conductivity of the solution exposed to air plasma increases and its pH decreases, as shown in Fig. 1(a) and 2(d), respectively. Amongst the various suggested reaction pathways that nitrite and nitrate ions can follow, the most important one is the formation of peroxynitrite (ONOOH) in the following manner:
| NO2− + H2O2 + H+ → ONOOH + H2O | (7) |
Various studies have concluded that the oxidizing properties of water treated with air plasma in the post treatment stage (towards various organic and biological contaminations) can be attributed to the action of peroxynitrite in the solution.48–50,52 The results presented in Fig. 2(b) clearly show that in the absence of NaCl in the solution, 15% of MB removal occurs during the post treatment stage which can possibly be due to the action of peroxynitrite. However, it has to be mentioned that under acidic conditions (pH < 6.8), H+-catalyzed decomposition of peroxynitrite can happen,48 according to reaction (8).
| ONOOH ↔ OH˙ + NO2˙ | (8) |
This can limit the effect of peroxynitrite in the post treatment stage considering the fact that the pH of the solution decreases quickly as it is treated with air plasma (see section 3.2 for further discussion). On the other hand, decomposition products of peroxynitrite under acidic conditions (as shown in reaction (8)) are powerful oxidizing agents, but with a short lifetime, that can help in the MB removal process (possibly during the treatment stage).
As shown in Fig. 2(b), an increase in the concentration of NaCl in the solution resulted in a gradual decrease in the removal% during the treatment stage. However, a significant increase in the removal% during the post treatment stage occurred. The gradual decline of removal% during the treatment stage can be explained by the scavenging properties of Cl− towards OH˙.30,33 According to the kinetic modeling performed by Yuan et al., chlorine radical anions (Cl2˙−) are the most dominant in terms of concentration amongst many possible chlorine-based by-products.33 The role of Cl2˙− in degradation of organic pollutants has also been suggested.30
| OH˙ + Cl− ↔ ClOH˙− | (9) |
| ClOH˙− + Cl− ↔ Cl2˙− + OH− | (10) |
As shown in reaction (9), Cl− can scavenge OH˙ to form ClOH˙−. This compound is unstable and can dissociate to form chloride and hydroxyl radicals again. However, the acidic conditions of the solutions can favor the formation of Cl2˙− and Cl˙− from ClOH˙−. These conditions are normally met during the plasma treatment of aqueous solutions where the pH of the solution decreases significantly. This is shown in Fig. 3(d). The extensive kinetic modeling performed by Yuan et al.33 on the reactions involving chloride and its by-products concluded that under acidic conditions, Cl2˙− is eventually formed in the solution. The chlorine radical anion is an oxidizing agent; however, its oxidation potential is lower than the oxidation potential of hydroxyl radicals (1.57 V for Cl2˙−versus 2.8 V for OH˙).53 This means that the presence of Cl− in the solution can reduce the decontamination ability of the plasma treatment process, especially in the treatment stage. This is due to the fact that during the treatment stage the action of OH˙ on MB molecules is the most important decontamination pathway (see section 3.5 for further discussion). This is in accordance with the trend observed for removal% in the treatment stage illustrated in Fig. 2(b). On the other hand, for Cl− to be able to contribute to the increase in the removal% during the post treatment stage, stable chemicals should be produced in the solution. Only then the prolonged decontamination in the post treatment stage can be expected, as shown in Fig. 2(d) for Cl-containing solutions. One pathway (reactions (11) and (12)) that can justify the role of Cl− in the post treatment stage is the production of singlet oxygen (1O2).6,27–29
| Cl2˙− + OH˙ → HOCl + Cl− | (11) |
| HOCl + H2O2 ↔ 2Cl− + 1O2 + 2H+ | (12) |
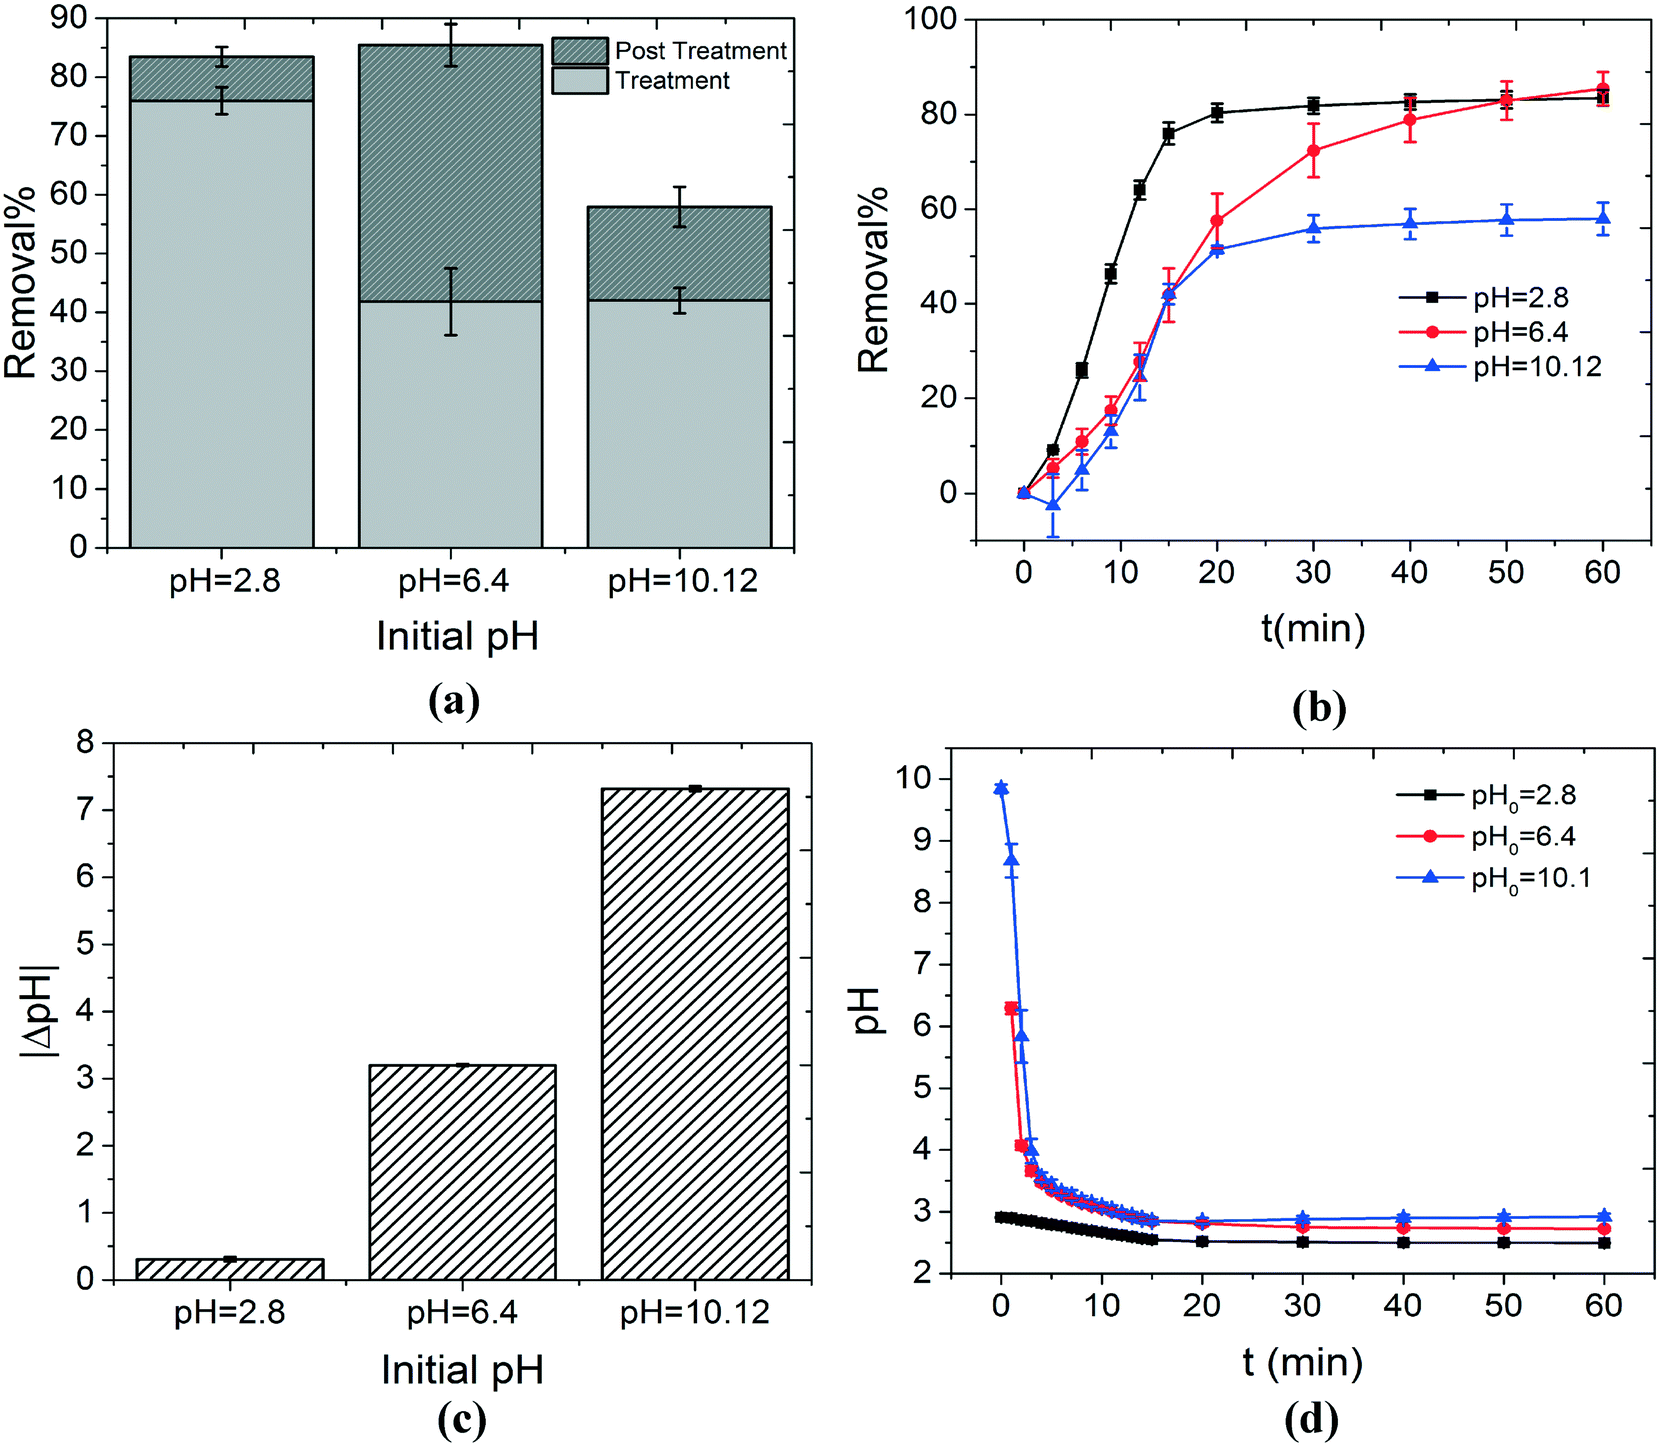 | ||
| Fig. 3 The effect of the initial pH of the solution on the decontamination of MB is investigated. (a) Overall removal%, removal% during the treatment stage (light gray) and removal% during the post treatment stage (dark gray) are shown as a function of the initial pH of the solution. The highest removal% during the treatment stage was achieved by using solutions with initial acidic pH values. This can be explained by various phenomena including the pH dependency of the oxidation potential of OH˙, the acid–base equilibrium of the dye molecules, etc. The removal% during the post treatment stage is insignificant for solutions under either initial acidic or alkaline conditions (pH values of 2.8 and 10.12). This can be justified by considering the pH dependency of the Cl-based reactions involved in the production of 1O2 (reactions (8) and (10)). As discussed in section 3.1, when Cl− is present in the solution, it can possibly scavenge OH˙. This reaction pathway eventually produces 1O2 from two stable compounds, i.e. HOCl and H2O2, that can degrade MB in the post treatment stage. Significantly high concentrations of OH− or H+, when initial alkaline or acidic conditions are used respectively, can cause reaction (8) or (10) to occur with a faster rate in the reverse direction. As a result, a lower concentration of 1O2 is achieved and the removal% in the post treatment stage decreases. This can be seen in (b) which illustrates the change in the removal% as a function of time for three different initial pH values. The initial near neutral pH values represent the most balanced conditions for production of 1O2. As a result, removal of MB continues significantly after the plasma is extinguished. The overall change in the pH of the solutions with various initial pH values is shown in (c) (pH of the solution decreases). The acidification of the solutions is a direct consequence of the formation of nitrite and nitrate ions in the solution, as discussed in section 3.1. The highest acidification happens for the solutions under initial alkaline conditions. This is understandable since these solutions are depleted from H+. Finally, the pH change as a function of time is shown in (d). | ||
According to reaction (12), the formation of the singlet oxygen depends on the presence of hydrogen peroxide (H2O2) and hypochlorous acid (HOCl) in the solution formed by reactions (4) and (11), respectively. These chemicals are stable in the solution (as shown in Fig. S1(b) in the ESI† for H2O2) to induce prolonged decontamination in the post treatment stage. It is worth mentioning that we attempted to detect 1O2 in the solution using a fluorescence probe, 9,10-dimethylanthracene (DMA), as described in the literature.46,54 DMA is a fluorescent molecule by nature and it loses its fluorescence properties when it reacts with 1O2. However, DMA is not soluble in water and our experiments show that upon dissolution in acetonitrile and subsequent mixture with the untreated aqueous phase, it loses its fluorescence properties. As a result, distinguishing between the effects of 1O2 and mixing with an aqueous phase on the fluorescence properties of DMA proved to be a challenge.
Finally, the calculated energy yield of the process for various concentrations of NaCl is shown in Fig. 2(c). A local maximum at 50 mg l−1 is due to the higher removal% at this concentration. This local maximum in the overall removal% is probably due to the balanced role of OH˙ during the treatment stage and 1O2 during the post treatment stage. The variation of the overall removal% as a function of time is shown in Fig. 2(d) for various concentrations of NaCl. It clearly shows the role of Cl− ions in the solution for continuation of decontamination in the post treatment stage (from t = 15 min to t = 60 min).
3.2. Effect of initial pH
One of the parameters that can affect the decontamination ability of any AOP is the initial pH of the solution. In this study, the concentrations of MB and NaCl were fixed at 0.75 mg l−1 and 50 mg l−1, respectively. The initial pH of the solutions was adjusted by adding a sufficient amount of 0.1 M solution of HCl or NaOH to create acidic or alkaline conditions, respectively. Fig. 3(a) shows the effect of the initial pH of the solution on the removal% during the treatment and post treatment stages. Maximum overall removal% can be achieved in either acidic or near neutral pH values (82–85%). However, the decontamination process at pH = 2.8 mostly occurred in the treatment stage (75%) and the role of the post treatment stage was insignificant (10%). On the other hand, when the initial pH was set to 6.4, the contribution of the treatment (40%) and post treatment stages (45%) to the overall decontamination was almost equal.As discussed in section 3.1, the most important oxidizing agent during the treatment stage is OH˙. In acidic solutions (initial pH of 2.8), significant removal% during the treatment stage, compared to initial pH values of 6.4 and 10.12, can be explained by multiple reasons. These reasons are given as follows:
1) Oxidation potential of OH˙ (as the most powerful oxidizing agent) is known to be 2.8 V; however, this value only holds in acidic solutions. Previous studies show that under non-acidic conditions, the oxidation potential of OH˙ is reduced to 1.8 V.32,55 This significantly diminishes the oxidation ability of OH˙ towards organic contaminations.
2) Previous studies suggest that for dye molecules and in general organic compounds, the acid–base equilibrium of the molecule can play a significant role in its decomposition at different pH values.40 This rationale was used to explain the higher degradation rate of phenol molecules under alkaline conditions.41 Moreover, the higher removal% (during the treatment stage) of MB in solutions under initial acidic conditions is in accordance with previous studies.1 However, the effect of the initial pH on removal% during the post treatment stage was not considered previously.
3) It has been suggested that under alkaline conditions (pH > 7), OH˙ reacts selectively with carbonate ions which are the by-products of organic molecule degradation.4,5,40,42 This competition between MB molecules and carbonate ions to react with OH˙ can possibly reduce the removal% of MB during the treatment stage, at an initial pH value of 10.12.
4) In highly alkaline solutions, since the concentration of hydroxyl ions (OH−) significantly exceeds the concentration of MB, OH˙ can participate in a side reaction (reaction (13)) which transforms OH˙ to its less reactive conjugate base, O˙−.21,28,40,56
| OH˙ + OH− ↔ O˙− + H2O | (13) |
This transformation of OH˙ to a less reactive species can possibly decrease the removal% during the treatment stage for highly alkaline solutions.
We have established in section 3.1 that Cl− plays an important role in the removal of MB, especially during the post treatment stage. As a result, it is plausible that the pH dependency of the reactions involving Cl− and its derivatives can explain the pH dependency of the removal% at this stage, as shown in Fig. 3(a) and (b). A quick investigation into the reactions proposed in this study for the effect of Cl− (reactions (9)–(12)) shows that reactions (10) and (12) are highly pH dependent. When alkaline solutions are used (initial pH of 10.12), the concentration of OH− is high. As a result, reaction (10) occurs in the reverse direction at a faster rate. This becomes more crucial considering the rate constants of the forward and reverse reactions (kFor = 105 M−1 S−1 and kRev = 4.5 × 10⁷ M−1 S−1 (ref. 33)). This means that lower concentrations of Cl2˙− are available to produce HOCl and as a result 1O2. Therefore, the removal% during the post treatment stage for alkaline solutions is small, as shown in Fig. 3(a). On the other hand, for solutions under initial acidic conditions (initial pH of 2.8), the post treatment removal% is also insignificant. This can be explained based on the pH dependency of reaction (12). In a similar manner discussed above, in highly acidic solutions, the concentration of H+ is high. As a result, reaction (12) happens at a faster rate in the reverse direction. This means that lower concentrations of 1O2 would be available for reaction with MB during the post treatment stage. Based on the above-mentioned rationale, it can be hypothesized that the near neutral condition (pH = 6.4) represents the most balanced condition for reactions (10) and (12). As a result, the highest concentration of 1O2 can possibly be achieved for solutions with initial pH values in the neutral region. Therefore, the highest removal% for the post treatment stage was obtained for an initial pH value of 6.4.
Fig. 3(c) and (d) show the overall change in the solution pH as a function of the initial pH and pH variation as a function of the treatment time, respectively. The highest pH change occurred for the solutions with the initial pH of 10.12. This is understandable since alkaline solutions are inherently depleted of H+. This facilitates the production of H+ by reactions (5) and (6). It is worth mentioning that based on the results presented in Fig. 3, the initial pH of the solution is crucial in determining the decomposition ability of the system. However, solutions treated with air plasma become acidic quickly. In other words, all the treated solutions share almost the same pH value for most of the treatment time, regardless of the initial pH value (Fig. 3(d)). This means that the initial pH has negative or positive effects on one or some of the components of the system at the beginning of the process. However, the chemistry of the water treated with plasma is quite complex and further analysis and kinetic modeling are required to understand this phenomenon completely.
3.3. Effect of initial MB concentration
The decontamination capability of the technique against increasing concentrations of MB is investigated. The electrolyte consists of NaCl (50 mg l−1) dissolved in MilliQ water. The initial pH of the solutions was set to near neutral values (pH = 6.4–6.7).Although removal% decreased slightly at higher concentrations of MB, the energy yield of the system increased significantly (Fig. 4(a)) due to the higher concentration of MB degraded (the average power consumption used for energy yield calculations in eqn (2) is 13.7 ± 0.2 W). This can possibly be explained by means of the collision theory of molecules. When plasma is injected into the surface of water, primary oxidizing agents such as OH˙ and secondary species such as 1O2 are formed in the solution. When the number of MB molecules present in the solution is higher, the collision frequency between active species and MB is significantly higher. This has a crucial impact on the process, especially in the case of OH˙ where the lifetime is very short. Therefore, the collision between MB molecules and active species can occur more efficiently. This is also reflected in the reaction rate of the process, as shown in Fig. 4(b). k1 and k2 show the decontamination reaction rates during the treatment stage (with plasma present) and post treatment stage (without plasma), respectively. These rates were obtained by fitting the data by the pseudo-first-order kinetics equation, separately for each stage. As shown in Fig. 4(b), the reaction rate during the treatment stage is always higher than that during the post treatment stage, possibly due to the presence of stronger oxidizing agents such as OH˙ in this stage. Moreover, higher concentrations of MB resulted in higher reduction rates during the treatment stage. This can be explained by higher frequency of collisions between MB molecules and oxidizing agents, as discussed earlier. Finally, the reaction rate during the post treatment stage is almost constant, regardless of the concentration of MB. This indicates that the decontamination process during the post treatment stage mainly occurs by secondary active species, i.e.1O2. In the case of these secondary oxidizing species, the reaction rate with MB is not only dependent on the MB concentration but also depends on the rate constants of reactions that produce 1O2 (reactions (7)–(10)). This rationale can possibly explain the lower sensitivity of k2 to MB concentration.
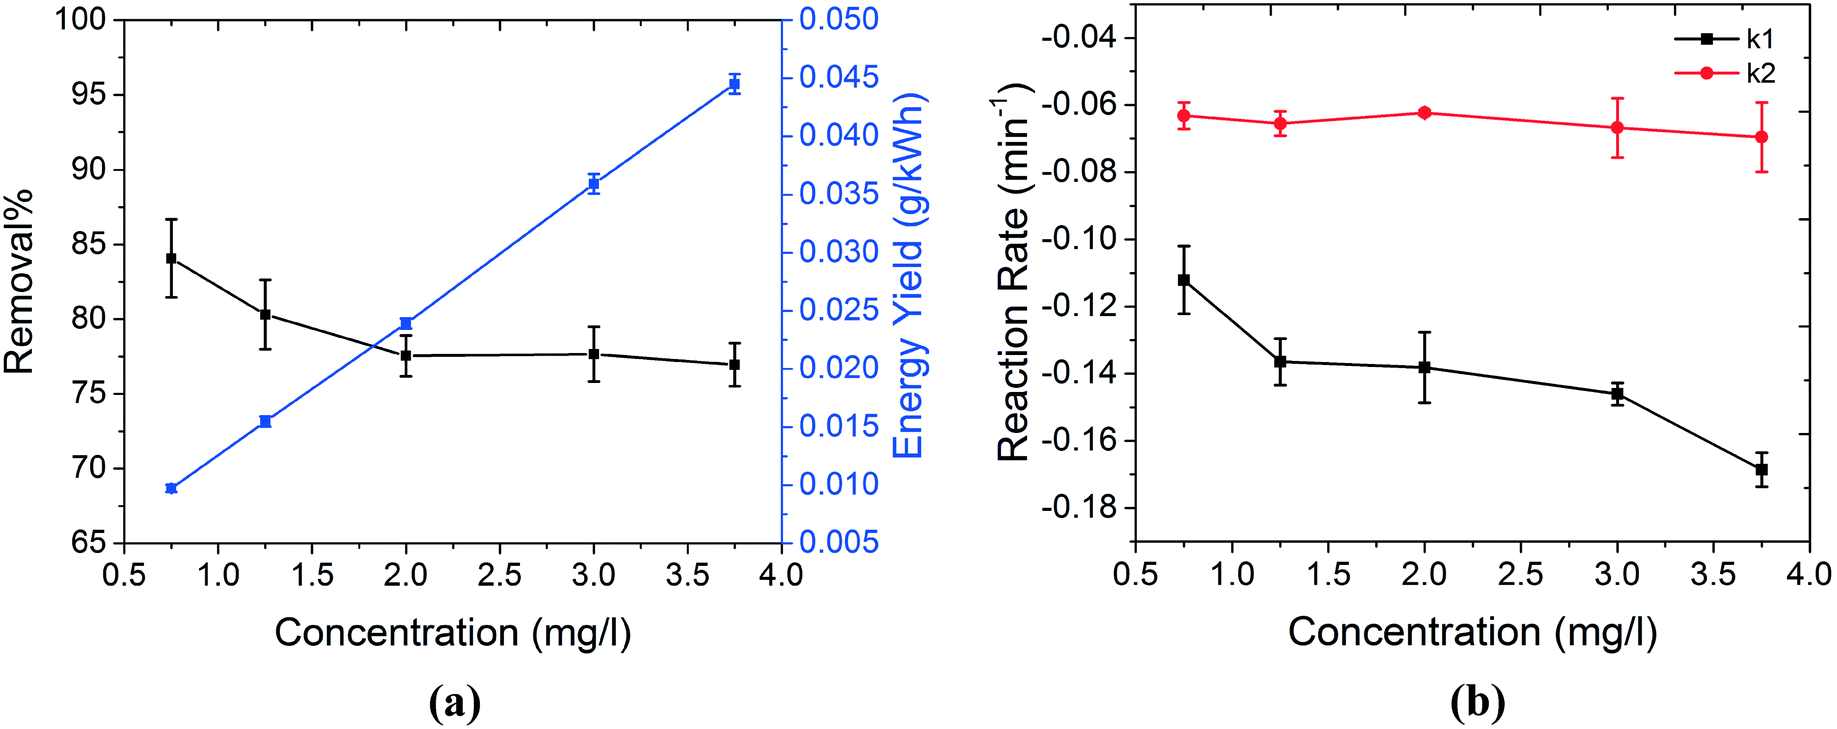 | ||
| Fig. 4 The efficiency of the plasma treatment system is evaluated against the increasing concentration of MB. (a) Shows the change in the removal% and energy yield of the system as a function of MB concentration. Although removal% shows a slight decrease, the energy yield increases significantly as MB concentration increases. This is due to the fact that when higher concentrations of MB are present in the solution, the collision frequency between MB molecules and oxidizing agents is higher. For OH˙, this is very critical since their lifetime is very short. This is also reflected in the reaction rate of the MB degradation during both treatment and post treatment stages, as shown in (b). In (b), k1 and k2 represent the reaction rates of MB degradation during the treatment and post treatment stages, respectively. These rates were obtained by fitting the data by a pseudo-first-order kinetics equation, separately for each stage. As shown in (b), regardless of the MB concentration, k1 (reaction rate during the treatment stage) is always higher. This is due to the action of more powerful oxidizing agents (such as OH˙) on MB molecules during the treatment stage. Moreover, higher reaction rates during the treatment stage can be achieved if higher concentrations of MB are present in the solution. This reflects the importance of the collision frequency between MB molecules and OH˙ during this stage. On the other hand, the reaction rate during the post treatment stage (k2) is significantly less sensitive to the concentration of MB. This is probably due to the fact that removal of MB during this stage is not only dependent on the collision frequency between MB molecules and oxidizing agents (such as 1O2), but it is also limited by reactions that create 1O2. The negative sign of the reaction rates only shows the decrease in the concentration of MB during the degradation process. | ||
3.4. Ion chromatography (IC) analysis
IC analysis was used to measure the concentration of inorganic species in water, both before and after treatment. Table 1 summarizes the results obtained from IC analysis.| Sample | Treatment stage | Concentration (mg l−1) | ||
|---|---|---|---|---|
| Cl− | NO3− | NO2− | ||
| MilliQ water | Before | — | — | — |
| After | — | 14.4 ± 0.026 | 5.1 ± 0.036 | |
| MilliQ water + NaCl | Before | 50 ± 0.09 | — | — |
| After | 50.36 ± 0.35 | 11.08 ± 0.07 | 4.1 ± 0.032 | |
The results indicate that regardless of the nature of the water matrix, nitrate (NO3−) and nitrite (NO2−) ions are formed in the solution. This is due to the direct action of plasma on water, as discussed in section 3.1 (reactions (5) and (6)). The results in Table 1 also show that for solutions containing NaCl, the concentration of Cl− is similar before and after the plasma treatment. This can be explained based on reactions (9)–(12), mentioned in section 3.1. These reactions describe a chemical pathway in which Cl− is a reactant in reaction (9) and a product in reaction (12). In other words, Cl− acts as a catalyst in the formation of 1O2. As a result, the concentration of Cl− before and after the plasma treatment is the same.
3.5. Liquid chromatography–mass spectrometry (LC–MS) analysis
LC–MS was used to determine the degradation by-products of MB and to suggest a pathway in which plasma affects the MB structure. The analysis was performed on both water matrices, i.e. only MilliQ water and MilliQ water with NaCl (50 mg l−1). As discussed in section 3.1, the nature of MB degradation (especially in the post treatment stage) can be different in the presence and absence of Cl−. While in the absence of Cl−, peroxynitrite is possibly the main contributor to the degradation of MB during the post treatment stage, in the presence of Cl−, the enhanced removal% can be attributed to the formation of 1O2. Table 2 summarizes the compounds detected by LC–MS for each sample.| Sample | Detected m/z | Identification |
|---|---|---|
| MilliQ-before | 284.12 | Methylene blue |
| MilliQ-after | 166.06 | P7 |
| 101.02 | P10 | |
| 107.07 | P9 | |
| 180.07 | P6 | |
| 256.09 | P2 | |
| 270.11 | P1 | |
| 284.12 | Methylene blue | |
| 244.07 | P3 | |
| 228.06 | P4 | |
| NaCl-before | 284.12 | Methylene blue |
| NaCl-after | 107.07 | P9 |
| 180.07 | P6 | |
| 101.02 | P10 | |
| 270.11 | P1 | |
| 187.07 | P5 | |
| 244.07 | P3 | |
| 231.04 | P11 | |
| 228.06 | P4 | |
| 158.02 | P8 |
In Table 2, terms “before” and “after” indicate the stage of the samples during the process, i.e. before and after treatment. On the other hand, “MilliQ” and “NaCl” under the column “Sample” represent only MilliQ water and MilliQ water with NaCl, respectively. The bold italic formatting in the table indicates the compounds detected in only one of the water matrices. Two conclusions can be readily made from the results summarized in Table 2 regarding the by-products formed by plasma treatment.
1) After treatment by plasma, residues of the parent compound (MB) are only present in the samples with a MilliQ water matrix. However, LC–MS could not detect any MB in the treated samples where NaCl was added to MilliQ water (NaCl-after). This is understandable considering the higher removal% obtained when 50 mg l−1 of NaCl was added to MilliQ water (85% versus 65%), as shown in Fig. 2.
2) Although most of the degradation by-products are similar in both treated samples, there are a few organic species formed only in one or another water matrix after plasma treatment. As shown in Table 2, besides MB, products P2 and P7 only formed when only MilliQ water used as the water matrix. More importantly, products P5, P8 and P11 were only detected in treated samples with NaCl added to the water matrix. This possibly points to the hypothesis that the degradation mechanism is at least partially different in the two water matrices, as discussed in section 3.1.
Based on the species summarized in Table 2, a degradation pathway was suggested for MB, as shown in Fig. 5. The identified by-products can be categorized into three groups based on their appearance in a specific water matrix. These include by-products only in MilliQ water (P2 and P7), common by-products (P1, P3, P4, P6, P9 and P10) and by-products only in NaCl added to MilliQ water (P5, P8, P11).
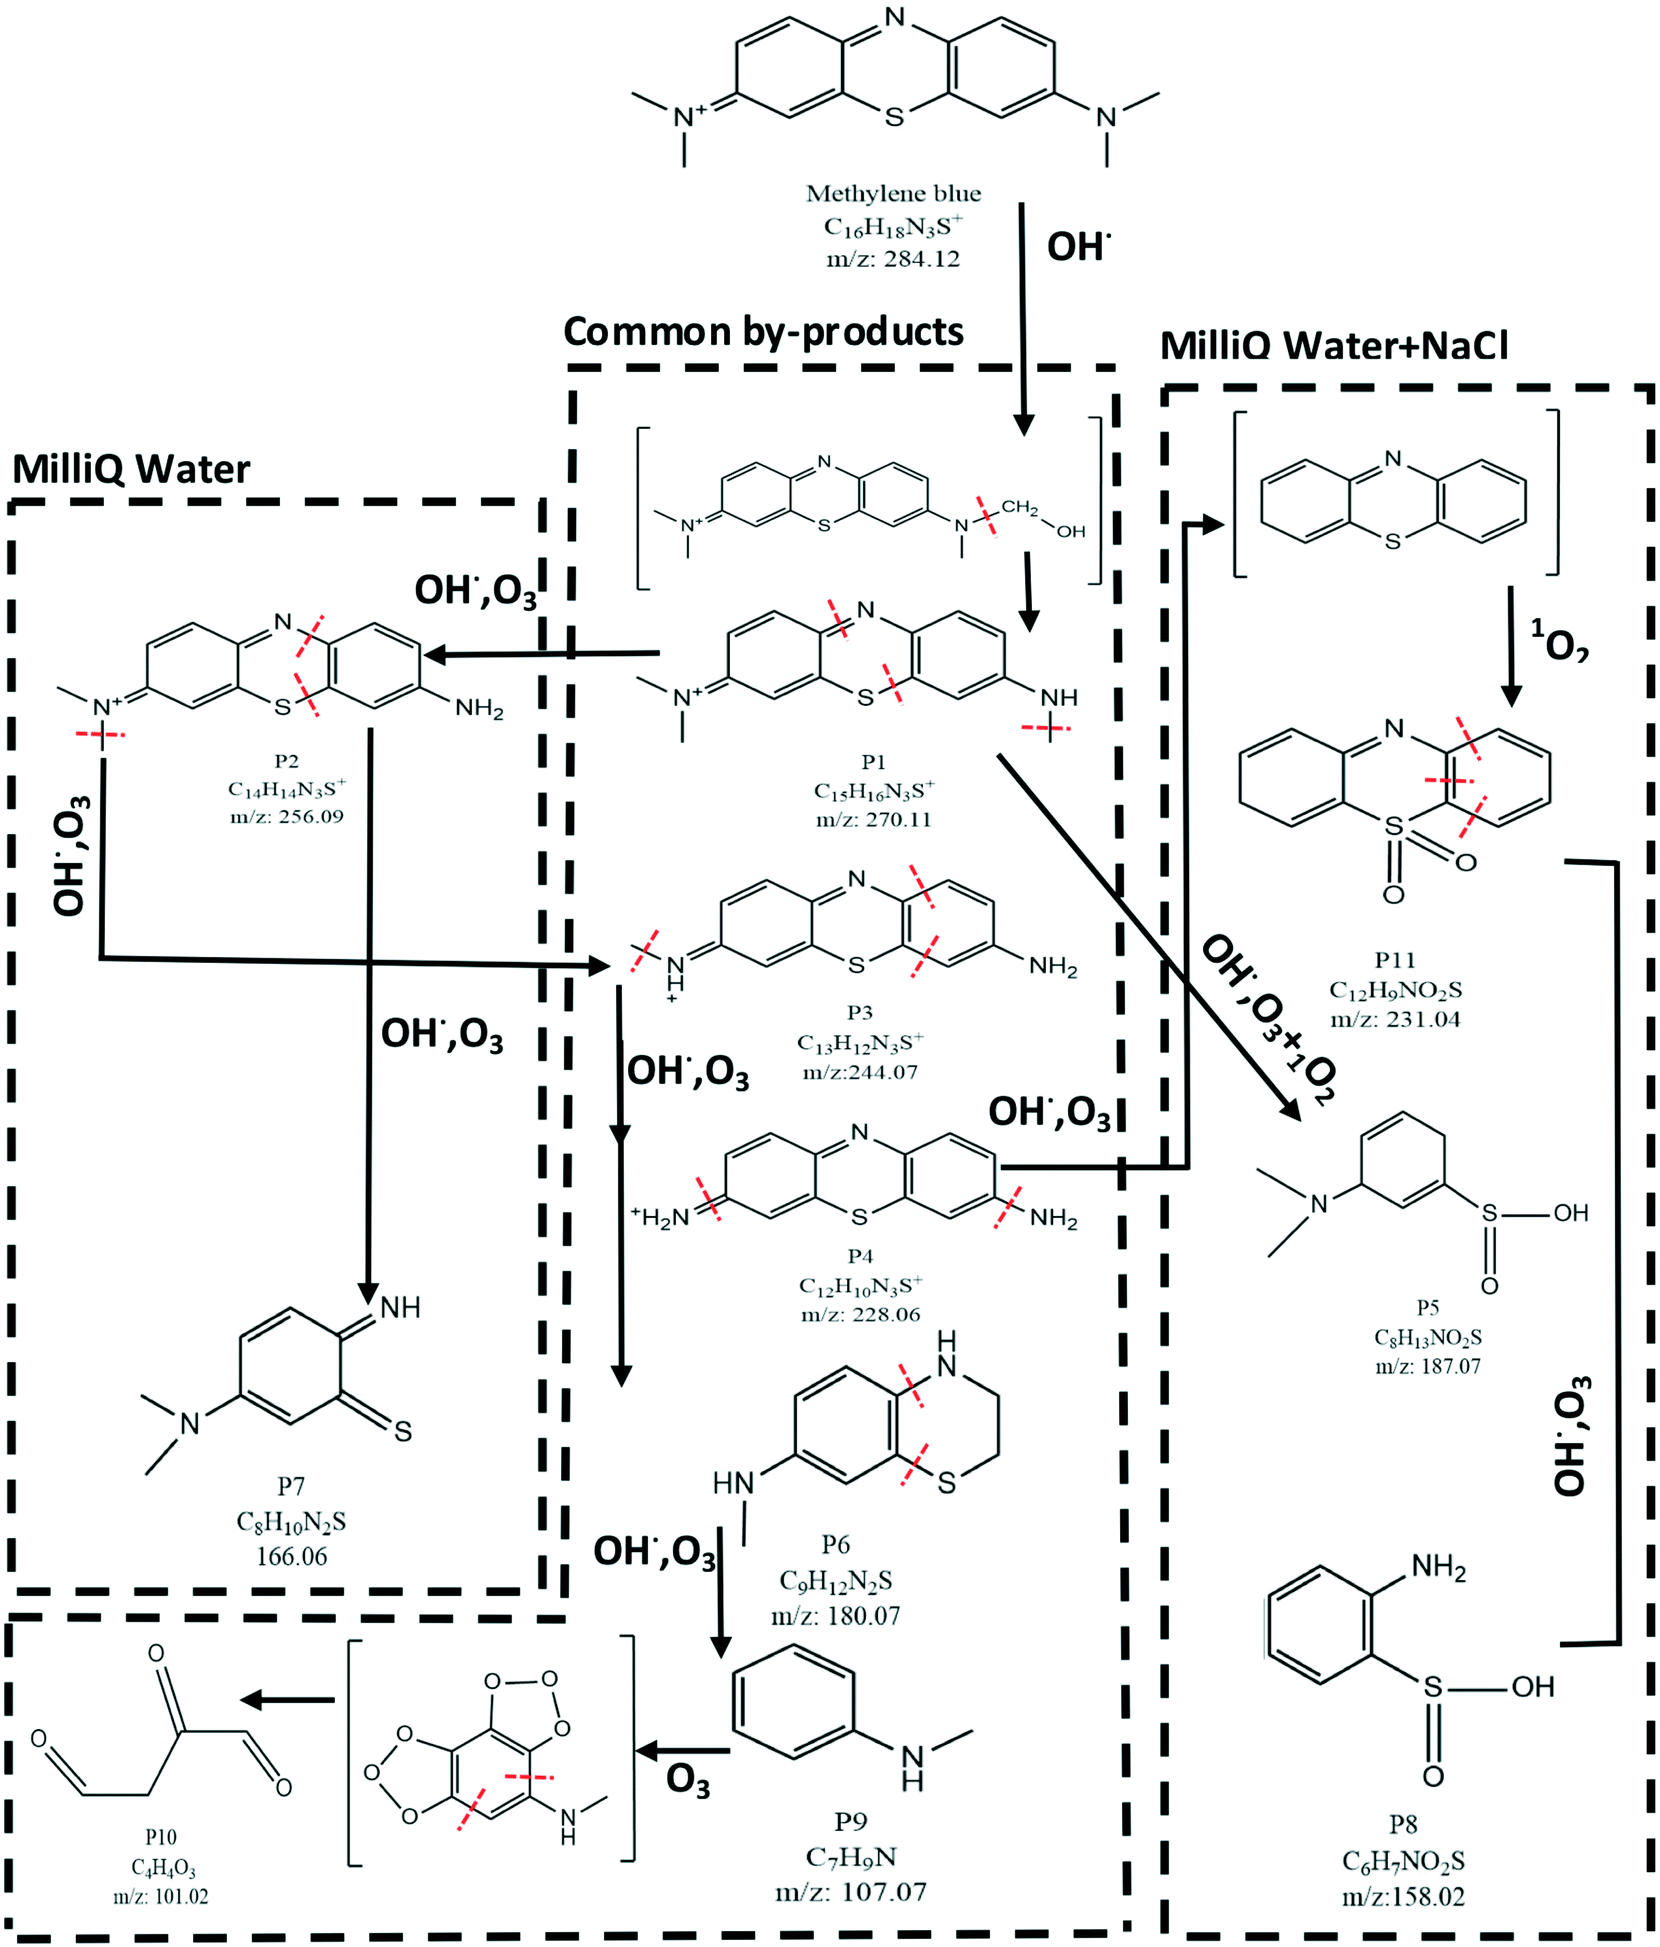 | ||
| Fig. 5 A degradation pathway for MB was suggested based on the species detected by LC–MS. The major pathway for degradation of MB molecules is believed to be the action of OH˙. Moreover, the by-products can be categorized into three groups based on their formation in specific water matrices. These categories from left to right in the figure are 1) only in MilliQ, 2) common by-products and 3) only in NaCl added to MilliQ water. The formation of sulfones (P11) and sulfinic acids (P5 and P8) in only samples with NaCl added to MilliQ water confirms the formation of 1O2 as an oxidizing agent in these samples. Moreover, the presence of small organic molecules (such as P10) in both water matrices suggests the complete destruction of the aromatic ring and formation of aliphatic molecules. This is possibly due to the action of ozone molecules on aromatic compounds such as P9. This process proceeds first with the formation of ozonide compounds which are unstable and turn into aliphatic molecules. | ||
In Fig. 5, a chemical structure inside two brackets indicates an intermediate compound which, although not detected by LC–MS, its inclusion in the degradation pathway increases the clarity of various steps involved in the degradation mechanism. The major pathway in the degradation of MB is oxidation by OH˙. The first step is the oxidation of a methyl group (CH3) to a hydroxymethyl group (CH2–OH). This structure is probably unstable (shown in the bracket in Fig. 5) and results in the termination of the methyl group from the MB molecule (P1). The remaining methyl groups can go through a similar process to yield P2, P3 and P4. It has to be mentioned that the same by-products can be achieved through the action of ozone (O3) on MB molecules, as suggested by Huang et al.1 Product P4 can degrade further by losing its amine (−NH2) groups to form an intermediate (top right corner of Fig. 5). This intermediate is probably the substrate for oxidation by 1O2, in the case of NaCl added to MilliQ water, to form sulfones (P11). P11 can be further oxidized by OH˙ or O3 to create sulfinic acid by-products (P8). The presence of the sulfones (P11) and sulfinic acids (P5 and P8) can be explained by the action of 1O2 on organic molecules. Due to high electrophilicity, 1O2 is capable of oxidizing phenols, sulfides and amines. Oxidation of sulfides by 1O2 results in the formation of sulfoxides and sulfones.57,58 The sulfone group is known to be an electron withdrawing group (EWG), i.e. it draws the electron density from neighboring atoms. Subsequently, the strength of the bonds neighboring the sulfone group decreases. As a result, further degradation of the organic molecule containing a sulfone group becomes easier. This confirms the hypothesis discussed in section 3.1 in which the increased removal% of MB (during the post treatment stage) in solutions containing Cl− was attributed to the formation of 1O2 through a series of reactions mediated by Cl-based compounds. However, the direct measurement of the concentration of 1O2 in the solution by means of suitable chemical probes and the use of kinetic modeling may further enhance the understanding of the involved processes. These studies can be the subject of future investigations. LC–MS results presented in Fig. 5 indicate that one major step in degradation of MB, regardless of the water matrix used, is the degradation of the aromatic moieties. This is probably due to the attack of hydroxyl radicals and results in the formation of products such as P7 from P2, P6 from P3, etc. This aromatic ring destruction continues until the organic molecules turn into their simplest aromatic form (P9). Finally, P9 can lose its aromatic structure completely and form the aliphatic by-product P10. This is possible by formation of an ozonide intermediate, as suggested by Kim et al.59 Finally, the LC–MS results suggest that there are no chlorinated by-products present in the plasma treated solutions, in the case of NaCl added to the MilliQ water matrix. These chlorinated by-products can be hazardous (if present) for wildlife due to bioaccumulation.28
4. Conclusions
Plasma generated using a single electrode streamer corona discharge system was used for decontamination of water containing dye molecules such as methylene blue. The effects of solution characteristics, such as the concentration of Cl− in the solution, the initial pH of the solution, and the initial concentration of MB, on treatment efficiency were investigated. The results indicate that at an optimum concentration of Cl− (50 mg l−1), the contaminant removal percentage is at its maximum (85%). Moreover, although the presence of Cl− decreases the removal percentage during the treatment stage, it significantly enhances the removal percentage in the post treatment stage. It was hypothesized that this phenomenon is due to the formation of singlet oxygen (1O2) through a series of reactions mediated by Cl-based compounds. This hypothesis was analytically confirmed by LC–MS analysis and through the formation of sulfones and sulfinic acids in only treated solutions containing Cl−. The initial pH of the solution proved to play an important role in both treatment and post treatment stages. While maximum removal% during the treatment stage was obtained under initial acidic conditions, the role of treatment and post treatment stages was almost equal in solutions with initial near neutral pH values. This was attributed to the sensitivity of the involved fundamental chemical reactions to the initial pH of the solution. The results presented in this study shed light on the possible effects of solution characteristics on the behavior of plasma-based water treatment processes.Acknowledgements
This work was supported by the Canada Excellence Research Chairs (CERC) program. The authors thank the Oil Sands and Coal Interfacial Engineering Facility (OSCIEF) for characterization experiments. Moreover, the authors thank the Stable Isotope Facility for Ecosystem Research (SIFER) and the Mass Spectrometry Facility for ion chromatography and mass spectrometry analyses, respectively.References
- F. Huang, L. Chen, H. Wang and Z. Yan, Chem. Eng. J., 2010, 162, 250–256 CrossRef CAS.
- N. Koprivanac, H. Kušić, D. Vujević, I. Peternel and B. R. Locke, J. Hazard. Mater., 2005, 117, 113–119 CrossRef CAS PubMed.
- P. K. Malik and S. K. Saha, Sep. Purif. Technol., 2003, 31, 241–250 CrossRef CAS.
- A. T. Sugiarto, T. Ohshima and M. Sato, Thin Solid Films, 2002, 407, 174 CrossRef CAS.
- A. T. Sugiarto, S. Ito, T. Ohshima, M. Sato and J. D. Skalny, J. Electrost., 2003, 58, 135–145 CrossRef CAS.
- L. Wang, J. Hazard. Mater., 2009, 171, 577–581 CrossRef CAS PubMed.
- L. G. Devi, C. Munikrishnappa, B. Nagaraj and K. E. Rajashekhar, J. Mol. Catal. A: Chem., 2013, 374–375, 125–131 CrossRef CAS.
- M. Hijosa-Valsero, R. Molina, H. Schikora, M. Müller and J. M. Bayona, J. Hazard. Mater., 2013, 262, 664–673 CrossRef CAS PubMed.
- R. Andreozzi, V. Caprio, A. Insola and R. Marotta, Catal. Today, 1999, 53, 51–59 CrossRef CAS.
- J. R. Bolton, K. G. Bircher, W. Tumas and C. A. Tolman, Pure Appl. Chem., 2001, 73, 627–637 CrossRef CAS.
- I. Gültekin and N. H. Ince, J. Environ. Manage., 2007, 85, 816–832 CrossRef PubMed.
- P. Mojir Shaibani, K. Prashanthi, A. Sohrabi and T. Thundat, J. Nanotechnol., 2013, 2013, 939531 Search PubMed.
- R. Maciel, G. L. Sant'Anna and M. Dezotti, Chemosphere, 2004, 57, 711–719 CrossRef CAS PubMed.
- C. Comninellis, A. Kapalka, S. Malato, S. A. Parsons, I. Poulios and D. Mantzavinos, J. Chem. Technol. Biotechnol., 2008, 83, 769–776 CrossRef CAS.
- B. R. Locke, M. Sato, P. Sunka, M. R. Hoffmann and J.-S. Chang, Ind. Eng. Chem. Res., 2006, 45, 882–905 CrossRef CAS.
- M. Marković, M. Jović, D. Stanković, V. Kovačević, G. Roglić, G. Gojgić-Cvijović and D. Manojlović, Sci. Total Environ., 2015, 505, 1148–1155 CrossRef PubMed.
- D. R. Grymonpré, A. K. Sharma, W. C. Finney and B. R. Locke, Chem. Eng. J., 2001, 82, 189–207 CrossRef.
- P. Lukes and B. R. Locke, Ind. Eng. Chem. Res., 2005, 44, 2921–2930 CrossRef CAS.
- M. Sahni and B. R. Locke, Ind. Eng. Chem. Res., 2006, 45, 5819–5825 CrossRef CAS.
- Z. Stará, F. Krčma, M. Nejezchleb and J. Dušan Skalný, Desalination, 2009, 239, 283–294 CrossRef.
- X. Wen, M. Wang, Z. Ding and G. Liu, Plasma Sci. Technol., 2012, 14, 293–296 CrossRef CAS.
- L. Shu, T. Waite, P. Bliss, A. Fane and V. Jegatheesan, Desalination, 2005, 172, 235–243 CrossRef CAS.
- A. Ghaly, R. Ananthashankar, M. Alhattab and V. Ramakrishnan, J. Chem. Eng. Process Technol., 2013, 5, 1–19 Search PubMed.
- V. M. Correia, T. Stephenson and S. Judd, Environ. Technol., 1994, 15, 917–929 CrossRef CAS.
- D. Rajkumar, B. J. Song and J. G. Kim, Dyes Pigm., 2007, 72, 1–7 CrossRef.
- J. M. Aubry, J. Am. Chem. Soc., 1985, 107, 5844–5849 CrossRef CAS.
- X. Jin, X. Wang, J. Yue, Y. Cai and H. Zhang, Electrochim. Acta, 2010, 56, 925–928 CrossRef CAS.
- S. N. Ramjaun, R. Yuan, Z. Wang and J. Liu, Electrochim. Acta, 2011, 58, 364–371 CrossRef CAS.
- X. Jin, Q. Xia, H. Zhang and X. Wang, IEEE Trans. Plasma Sci., 2011, 39, 3218–3221 CrossRef CAS.
- L. Wang, X. Jiang and Y. Liu, J. Hazard. Mater., 2008, 154, 1106–1114 CrossRef CAS PubMed.
- K. Mopper and X. Zhou, Science, 1990, 250, 661–664 CAS.
- Y. Yang, J. J. Pignatello, J. Ma and W. A. Mitch, Environ. Sci. Technol., 2014, 48, 2344–2351 CrossRef CAS PubMed.
- R. Yuan, S. N. Ramjaun, Z. Wang and J. Liu, Chem. Eng. J., 2012, 209, 38–45 CrossRef CAS.
- P. Caregnato, J. A. Rosso, J. M. Soler, A. Arques, D. O. Mártire and M. C. Gonzalez, Water Res., 2013, 47, 351–362 CrossRef CAS PubMed.
- J. E. Grebel, J. J. Pignatello and W. A. Mitch, Environ. Sci. Technol., 2010, 44, 6822–6828 CrossRef CAS PubMed.
- J. J. Pignatello, Environ. Sci. Technol., 1992, 26, 944–951 CrossRef CAS.
- J. E. F. Moraes, F. H. Quina, C. A. O. Nascimento, D. N. Silva and O. Chiavone-Filho, Environ. Sci. Technol., 2004, 38, 1183–1187 CrossRef CAS PubMed.
- J. Kiwi, A. Lopez and V. Nadtochenko, Environ. Sci. Technol., 2000, 34, 2162–2168 CrossRef CAS.
- C. Liang, Z. S. Wang and N. Mohanty, Sci. Total Environ., 2006, 370, 271–277 CrossRef CAS PubMed.
- R. P. Joshi and S. M. Thagard, Plasma Chem. Plasma Process., 2013, 33, 17–49 CrossRef CAS.
- P. Lukes and B. R. Locke, J. Phys. D: Appl. Phys., 2005, 38, 4074–4081 CrossRef CAS.
- H. Wang and X. Chen, J. Hazard. Mater., 2011, 186, 1888–1892 CrossRef CAS PubMed.
- C. W. Van Neste, J. E. Hawk, A. Phani, J. A. J. Backs, R. Hull, T. Abraham, S. J. Glassford, A. K. Pickering and T. Thundat, Wireless Power Transfer, 2014, 1, 75–82 CrossRef.
- M. Magureanu, N. B. Mandache and V. I. Parvulescu, Water Res., 2015, 81, 124–136 CrossRef CAS PubMed.
- J. S. Chang, P. A. Lawless and T. Yamamoto, IEEE Trans. Plasma Sci., 1991, 19, 1152–1166 CrossRef CAS.
- A. Gomes, E. Fernandes and J. L. F. C. Lima, J. Biochem. Biophys. Methods, 2005, 65, 45–80 CrossRef CAS PubMed.
- J. G. Mohanty, J. S. Jaffe, E. S. Schulman and D. G. Raible, J. Immunol. Methods, 1997, 202, 133–141 CrossRef CAS PubMed.
- P. Lukes, E. Dolezalova, I. Sisrova and M. Clupek, Plasma Sources Sci. Technol., 2014, 23, 15019 CrossRef.
- G. Kamgang-Youbi, J.-M. Herry, M.-N. Bellon-Fontaine, J.-L. Brisset, A. Doubla and M. Naïtali, Appl. Environ. Microbiol., 2007, 73, 4791–4796 CrossRef CAS PubMed.
- D. Moussa, A. Doubla, G. Kamgang-Youbi and J. L. Brisset, IEEE Trans. Plasma Sci., 2007, 35, 444–453 CrossRef CAS.
- J. Brisset, D. Moussa, A. Doubla, E. Hnatiuc, B. Hnatiuc, G. Kamgang Youbi, J. Herry, M. Naïtali and M.-N. Bellon-Fontaine, Ind. Eng. Chem. Res., 2008, 47, 5761–5781 CrossRef CAS.
- M. Nätali, J. M. Herry, E. Hnatiuc, G. Kamgang and J. L. Brisset, Plasma Chem. Plasma Process., 2012, 32, 675–692 CrossRef.
- B. Sun, M. Sato and J. Sid Clements, J. Electrost., 1997, 39, 189–202 CrossRef CAS.
- E. Albiter, S. Alfaro and M. A. Valenzuela, Photochem. Photobiol. Sci., 2015, 14, 597–602 CAS.
- G. V. Buxton, C. L. Greenstock, W. P. Helman and A. B. Ross, J. Phys. Chem. Ref. Data, 1988, 17, 513–886 CrossRef CAS.
- S. B. Gupta and H. Bluhm, IEEE Trans. Plasma Sci., 2008, 36, 1621–1632 CrossRef CAS.
- M. C. DeRosa and R. J. Crutchley, Coord. Chem. Rev., 2002, 233–234, 351–371 CrossRef CAS.
- I. Kruk, Environmental Toxicology and Chemistry of Oxygen Species, Springer, 1998 Search PubMed.
- K. S. Kim, C. S. Yang and Y. S. Mok, Chem. Eng. J., 2013, 219, 19–27 CrossRef CAS.
Footnote |
| † Electronic supplementary information (ESI) available. See DOI: 10.1039/c6ew00308g |
| This journal is © The Royal Society of Chemistry 2017 |