
Characterization of chemical composition and bacterial community of corrosion scales in different drinking water distribution systems†
Haibo
Wang
a,
Chun
Hu
*ab,
Lang
Yin
a,
Sujia
Zhang
a and
Lizhong
Liu
ab
aKey Laboratory of Drinking Water Science and Technology, Research Center for Eco-Environmental Sciences, Chinese Academy of Sciences, Beijing, 100085, China. E-mail: huchun@rcees.ac.cn; Fax: +86 10 62843541; Tel: +86 10 62849628
bUniversity of Chinese Academy of Sciences, Beijing, 100049, China
First published on 22nd November 2016
Abstract
Characterization of the chemical composition and bacterial community of corrosion scales was studied in real drinking water distribution systems from eight cities. The results of X-ray powder diffraction (XRD) indicated that α-FeOOH and Fe3O4 were present in all corrosion scales, and green rust was only found in corrosion scales of pipes transporting surface water. The corrosion scales with a higher Fe3O4/α-FeOOH ratio showed less iron release than those with a lower ratio. Moreover, the results of 454 pyrosequencing revealed that Proteobacteria (46.5–84.3%) was the main bacterial phylum in all corrosion scales; however, the bacterial genera were very different in the pipes from eight cities. Nitrate-reducing bacteria (10.9–36.0%) were the main potential corrosive bacteria, and denitrifying genes including nirS, nirK and nosZ were all found in the corrosion scales. The results of most probable number (MPN) tests indicated that nitrate-reducing bacteria, Fe(III)-reducing bacteria and nitrate-dependent Fe(II)-oxidizing bacteria in corrosion scales were indeed active and had the function of Fe(II) oxidation and Fe(III) reduction. All the results suggested that there was an apparent relationship between the relevant biochemical functions (e.g., iron redox cycling) of the bacterial community and the formation of α-FeOOH and Fe3O4 in corrosion scales. Furthermore, the relative abundance of Desulfovibrio also correlated very well with the content of green rust in corrosion scales. These results will be very helpful for future control of iron release in water distribution systems.
Water impactIron release from corrosion scales in water distribution pipes affects tap water quality. Corrosion scales with a higher Fe3O4/α-FeOOH ratio show less iron release than those with a lower ratio. There is an apparent relationship between the chemical composition of corrosion scales and the relevant biochemical function of iron redox cycling. The information will be useful for control of iron release in distribution systems. |
1. Introduction
Unlined cast iron pipes have been used in drinking water distribution systems (DWDSs) for several centuries, and the corrosion and bacterial regrowth in pipes can cause deterioration of water quality.1–3 The formation of corrosion scales is a result of continued corrosion followed by a combination of precipitation and oxidation of corrosion products.4 Many corrosion scales are composed of goethite (α-FeOOH), lepidocrocite (γ-FeOOH), magnetite (Fe3O4), siderite (FeCO3), ferric hydroxide (Fe(OH)3), ferrous hydroxide (Fe(OH)2), and calcium carbonate (CaCO3).5–7The chemical composition of corrosion scales can affect the quality of distributed water in DWDSs. Yang et al. have indicated that thick and densely distributed corrosion scales with higher Fe3O4 content are more stable, and thin corrosion scales with higher α-FeOOH and FeCO3 content more easily release iron into the distributed water.8 The iron released from the corrosion scales will give drinking water a red, brown or yellow colour.4 Iron can also give tap water an unpleasant metallic taste9 and stain porcelain plumbing.10 Moreover, iron release plays great roles in biological stability in tap water; for example, iron is a key requirement for Legionella pneumophila growth and iron release can increase Legionella in tap water.11,12 The chemical composition of corrosion scales varies significantly with water quality and the hydraulic condition.13 Moreover, some studies have identified the bacterial community in the corrosion scales of cast iron pipes and indicated the effects of the bacterial community on the chemical composition of corrosion scales.14–16
Many bacteria play great roles in iron redox cycling, and this process also influences corrosion scale composition.17,18 Green rust can be formed during Fe(II) oxidation by the nitrate reducing Acidovorax sp. strain BoFeN1.19Geobacter metallireducens could induce sequential nitrate reduction, Fe(III) reduction and nitrate dependent Fe(II) oxidation, and this process causes the transformation of the iron oxides.20 Our study also indicated that the nitrate-reducing bacteria (NRB) Acidovorax and Hydrogenophaga promoted the formation of Fe(III) oxides at the initial stage of corrosion.21 When the corrosion reaches a relatively stable stage, NRB Dechloromonas, iron-reducing bacteria (IRB) Rhodobacter and iron-oxidizing bacteria (IOB) Rhodomicrobium could induce iron redox cycling in the corrosion scales, and this accelerated the Fe3O4 formation and decreased the iron release.21 Because the NRB Dechloromonas was the main bacteria in the corrosion scales in our study,21 one bacterium, Dechloromonas hortensis, was used to test its function in different NO3−-N concentrations.22 The results indicated that at lower NO3−-N concentrations (2.2 mg L−1), this bacterium induced Fe(II)/Fe(III) redox cycling in simulated DWDSs and resulted in higher Fe3O4 formation in corrosion scales and lower iron release.22 Moreover, Li et al. elucidated the same results by simulated DWDSs using groundwater and surface water with different NO3−-N concentrations.23 Zhu et al. also found that NRB exhibited the greatest corrosion inhibition by inducing the redox cycling of iron to enhance the precipitation of iron oxides and formation of Fe3O4 in the DWDSs with UV/Cl2 disinfection.24 Moreover, the water quality including the presence of SO42−, NO3− and natural organic matter (NOM) could influence the microbial oxidation and reduction of iron oxides.14,23,25 For example, in the presence of the IRB Shewanella putrefaciens CN32, NOM was found to enhance the microbial reduction of Fe(III) under anaerobic, circumneutral pH conditions.25
Therefore, many bacteria in corrosion scales could induce the iron redox cycling process, and this could promote Fe3O4 formation and decreased iron release. However, these studies were all done in the laboratory. The results in the laboratory cannot represent the process in real DWDSs completely because of the complexity of the actual environment. Until now, there has been little known about whether the bacteria in corrosion scales could induce iron redox cycling and whether this process has some relationship with the Fe3O4 formation in corrosion scales and iron release in real DWDSs. Therefore, the objective of this study was to analyze the characterization of the bacterial community and the chemical composition of corrosion scales in real drinking water pipes and to discuss the relationship between bacterial function and chemical composition in corrosion scales.
2. Materials and methods
2.1. Sample collection in actual DWDSs
Aged unlined cast iron pipe sections (approximately 20 years) were excavated from different DWDSs in eight cities of China during March–May 2014. Pipes from cities A–D were transporting groundwater, and pipes from E–H were transporting surface water. The diameter of all pipes was 100 mm. The hydraulic and water quality history of the sampling sites from June 2013 to May 2014 were derived from the database of the drinking water treatment plant in every city. In all sampling sites, the water flow velocity of all pipes was 0.1–0.5 m s−1 according to the water consumption at different times. The value range of water quality including pH, Cl−NO3−, SO42−, alkalinity and chlorine residual in DWDSs is shown in Table S1.†The water was sampled from the taps of customers that were connected directly to the pipelines. The taps were cleaned using absolute ethyl alcohol and the tap water was run for an extensive time until the water temperature remained stable for 30 s to ensure that the water was coming through the main pipe and not stagnant water in order to obtain representative samples from the pipes.26,27 Ten-liter water samples were collected from each tap using sterile plastic carboys every 30 minutes. The water was sampled three times from each tap, and a total of 30 liters of water was collected. The mean average and standard deviation of water quality is shown in Table 1. The detected tap water quality was consistent with the values from the database of different drinking water treatment plants (Table S1†).
| Parameters | A | B | C | D | E | F | G | H |
|---|---|---|---|---|---|---|---|---|
| The results are shown as mean average and standard deviation. | ||||||||
| pH | 8.52 ± 0.12 | 7.73 ± 0.11 | 7.87 ± 0.13 | 7.53 ± 0.10 | 8.36 ± 0.15 | 8.05 ± 0.12 | 7.91 ± 0.08 | 7.79 ± 0.08 |
| DOC (mg L−1) | 0.29 ± 0.03 | 0.35 ± 0.03 | 0.51 ± 0.04 | 1.94 ± 0.12 | 2.20 ± 0.15 | 1.97 ± 0.13 | 1.77 ± 0.11 | 1.43 ± 0.09 |
| NO3−-N (mg L−1) | 0.44 ± 0.05 | 7.58 ± 0.52 | 9.69 ± 0.68 | 4.95 ± 0.24 | 2.95 ± 0.19 | 2.87 ± 0.14 | 2.38 ± 0.18 | 5.46 ± 0.61 |
| Cl− (mg L−1) | 167.9 ± 15.8 | 26.1 ± 2.42 | 25.3 ± 2.15 | 27.1 ± 2.24 | 25.1 ± 2.16 | 39.4 ± 3.19 | 34.3 ± 3.24 | 48.8 ± 5.06 |
| SO42− (mg L−1) | 171.7 ± 15.6 | 48.1 ± 5.84 | 36.8 ± 3.28 | 136.9 ± 12.8 | 99.7 ± 10.4 | 145.9 ± 13.2 | 106.5 ± 9.94 | 147.8 ± 13.6 |
| Alkalinity (mg CaCO3 L−1) | 152.7 ± 14.8 | 182.0 ± 17.1 | 197.8 ± 18.5 | 228.9 ± 20.9 | 151.4 ± 14.8 | 150.2 ± 15.1 | 149.0 ± 13.7 | 189.3 ± 17.6 |
| Chlorine residual (mg L−1) | 0.27 ± 0.03 | 0.25 ± 0.02 | 0.26 ± 0.02 | 0.26 ± 0.03 | 0.28 ± 0.02 | 0.24 ± 0.02 | 0.30 ± 0.03 | 0.26 ± 0.03 |
Because the pipes were still in service, the water inlet valve was closed after collecting the tap water, and then the water in the pipes was drained quickly. The exteriors of the pipes were cleaned using a chain cleaner prior to removal to minimize contamination within the pipes during the sampling. Pipe sections of 1 m in length were manually extracted using a hinged cutter, and the open ends were immediately sealed with sterile bags.28 The sampling was also done in triplicate, and then three pipe sections from each city were cooled with ice and quickly transported to the laboratory. The metal spatulas were all covered with brown paper and sterilized at 121 °C and 1 bar for 20 minutes. Before sampling the corrosion scales, one of the sterile metal spatulas was scraped with a sterile cotton swab and washed with sterile water, and then DNA was extracted from the water and the cotton swab to ensure that the sterile metal spatulas could not induce contamination during sampling. Moreover, one sterile metal spatula was used only once. Corrosion scales were sampled from the interiors of the water pipe sections within 2 h of pipe section extraction using a sterile metal spatula at least 10 cm from a cut end to minimize the risk of contamination.28 The area of each sampling site within the pipe sections was measured using digital calipers and was approximately 20.0 cm2. All samples were stored at −80 °C before DNA extraction.
2.2. Analysis of water quality and corrosion scales
The tap water quality parameters from different pipes including pH, NO3−-N, Cl−, SO42− and alkalinity were measured according to standard methods.25 Dissolved organic carbon (DOC) was analyzed using a total organic carbon analyzer (Phoenix 8000; Tekmer-Dohrmann, USA). Chlorine residual was measured using a HANNA HI93711 spectrophotometer (Italy). The difference of water quality was measured using analysis of variance (ANOVA) with a significance threshold of α = 0.05. P values of less than 0.05 were considered as statistically significant.The corrosion scales from three pipe sections in each city were crushed using a sterile pestle and mortar in an anaerobic glove box which was equipped with an ultraviolet lamp. Crushed and homogenized scales from each city were analyzed using a powder X-ray diffractometer (XRD, X'Pert PRO MPD; PANalytical, The Netherlands) to determine the crystalline phase composition. The XRD patterns were analyzed using X'Pert HighScore Plus software (version 2.2.4) and the PDF 2004 database was used for crystalline phase identification. X-ray diffraction was used to semi-quantitatively determine the weight fraction of constituents.14
2.3. The iron release in different pipes
In order to know the iron release of different pipes, two experimental facilities were set up in the laboratory, one using the pipe sections (1 m × 3) from city A, and the other one using pipe sections from city E (Fig. S1†). The water used was collected from a drinking water treatment plant in the north of China, which was treated by coagulation, flocculation, sedimentation, sand filtration, and biologically activated carbon filtration (prior to entering the chlorine contact tanks). The water quality is shown in Table S2.† Sodium hypochlorite was used as the disinfectant. The water flow rate was controlled at 36 L h−1, and the water was cycled in the pipes for 24 hours to simulate the low-flow regions or intermittent water flow environment in actual pipes according to reported methods.6,29 Then the effluents were collected and the total iron concentration was measured according to standard methods.30 The total iron concentration was measured from 6 days to 36 days until the concentration was stable in the effluents. The difference in total iron concentration in the effluents of the two pipes was also measured using ANOVA with a significance threshold of α = 0.05.2.4. DNA extraction
During the collection of pipes, three pipe sections (1 m × 3) were sampled from each city. The corrosion scales collected from each pipe section were freeze dried using a FreeZone 2.5 L Benchtop system (Labconco, Kansas, MO). Then 0.5 g of crushed and homogenized corrosion scales from each pipe section was used for DNA extraction. The DNA of bacteria in corrosion scales was extracted using a FastDNA spin kit for soil (MP Biomedicals, Solon, OH, USA) following the manufacturer's instructions. DNA quality was checked on an agarose gel, and concentrations were measured with a Nanodrop spectrophotometer (ND-1000, NanoDrop, USA). All DNA samples were stored at −80 °C until further processing.To determine the method recovery efficiency, E. coli was used as a representative microorganism according to the method of Wang et al.31 A serial dilution of E. coli (ATCC 25922) was spiked into 50 mL of autoclaved water and subjected to freeze drying and/or DNA extraction. The recovery efficiency of the freeze drying method varied from 19.1% to 40.5% depending on the concentration of the sample, compared to direct DNA extraction (Fig. S2†).
2.5. Pyrosequencing
Primers 341F (5′-CCTACGGGAGGCAGCAG-3′) and 1073R (5′-ACGAGCTGACGACARCCATG-3′) were used to amplify partial regions (V3-V6) of 16S rRNA genes.23 The PCR products of three independent reactions were pooled together, purified with the AxyPrep DNA Gel Extraction Kit (Axygen, USA), and quantified using a TBS-380 Fluorometer (Turner Biosystems, USA). A Roche massively parallel 454 GS-FLX Titanium sequencer (Roche 454 Life Sciences, Branford, CT, USA) was used for the pyrosequencing. Pyrosequencing flowgrams were converted to sequence reads using MOTHUR software (http://www.mothur.org/) and then analyzed using the UCHIME (http://www.drive5.com/uchime) standard pipeline. Sequence reads were initially filtered and denoised to remove low quality or ambiguous reads. High quality sequences (>200 bp in length, quality score >25, exact match to barcode and primer, and containing no ambiguous characters) remained. Total bacterial communities were analyzed for the number of operational taxonomic units (OTUs) using the MOTHUR program. The numbers of OTUs were estimated at 97% 16S rRNA gene sequence similarity. Taxonomic positions of representative sequences were assigned using the SILVA database (http://www.arb-silva.de/). The difference in relative abundance of the bacterial genera in the corrosion scales was also measured using ANOVA with a significance threshold of α = 0.05.2.6. Quantitative real time PCR
Quantitative real time polymerase chain reaction (qPCR) analysis of 16S rRNA gene for total bacteria was performed using the primer pairs 1369F (5′-CGGTGAATACGTTCYCGG-3′) and 1492R (5′-GGWTACCTTGTTACGACTT-3′) with the probe 1389F (5′-CTTGTACACACCGCCCGTC-3′).32 In addition, genes encoding nitrite reductase (nirS or nirK) and nitrous oxide reductase (nosZ) are the most common molecular markers for denitrifiers. Three pairs of primers, nirK876 (5′-ATYGGCGGVAYGGCGA-3′)/nirK1040 (5′-GCCTCGATCAGRTTRTGGTT-3′), nirSCd3aF (5′-GTSAACGTSAAGGARACSGG-3′)/nirSR3cd (5′-GASTTCGGRTGSGTCTTGA-3′) and nosZ-F (5′-CGYTGTTCMTCGACAGCCAG-3′)/nosZ1622R (5′-CGSACCTTSTTGCCSTYGCG-3′), were used to amplify nirK, nirS and nosZ, respectively.23,33 PCR amplifications were carried out in 96-well optical plates on an Applied Biosystems 7300 qPCR system with 7300 SDS software (Applied Biosystems). All samples, including standards and negative controls, were analyzed in triplicate. The slopes of standard curves and amplification efficiency values for quantification were as follows: −3.356 and 98.6% for nirK, −3.388 and 97.3% for nirS, −3.352 and 98.8% for nosZ, and −3.409 and 96.5% for 16S rRNA gene.2.7. Most probable number enumeration
The abundance of culturable nitrate-reducing bacteria, Fe(III)-reducing bacteria and nitrate-dependent Fe(II)-oxidizing bacteria in the corrosion scales of different pipes was analyzed using a three-tube most probable number (MPN) technique. Triplicate pressure tubes containing sterile, anaerobic (N2![[thin space (1/6-em)]](https://www.rsc.org/images/entities/char_2009.gif) :CO2; 90:10, V/V) AGW medium (10 mM PIPES, 2 mM NaHCO3, 5 mM NH4Cl, 0.5 mM KH2PO4, pH 6.8) were inoculated with homogenized corrosion scales. For testing of the three bacteria in the corrosion scales, the AGW medium was amended according to previous studies.20,34 For testing of the acetate-oxidizing nitrate-reducing bacteria, tubes were amended with 5 mM NaHCO3 and 10 mM Na-acetate from sterile, anaerobic stock solutions. For acetate-oxidizing Fe(III)-reducing bacteria, the medium was amended with 10 mM of synthetic hydrous ferric oxide prior to autoclaving, and then amended with 10 mM Na-acetate and 2 mM FeCl2 (as a reducing agent) from sterile, anaerobic stock solutions. The medium for Fe(II)-oxidizing nitrate-reducing bacteria was amended with 0.5 mM Na-acetate, 5 mM NaNO3 and 10 mM FeCl2 from sterile, anaerobic stock solutions. Positive results for acetate-oxidizing nitrate reducers were determined by checking for depletion of NO3− by ion chromatography. Visual assessment of blackening of the medium, and formation of reddish-brown precipitates, was used to identify positive results for Fe(III) reducers and nitrate-dependent Fe(II) oxidizers, respectively.
:CO2; 90:10, V/V) AGW medium (10 mM PIPES, 2 mM NaHCO3, 5 mM NH4Cl, 0.5 mM KH2PO4, pH 6.8) were inoculated with homogenized corrosion scales. For testing of the three bacteria in the corrosion scales, the AGW medium was amended according to previous studies.20,34 For testing of the acetate-oxidizing nitrate-reducing bacteria, tubes were amended with 5 mM NaHCO3 and 10 mM Na-acetate from sterile, anaerobic stock solutions. For acetate-oxidizing Fe(III)-reducing bacteria, the medium was amended with 10 mM of synthetic hydrous ferric oxide prior to autoclaving, and then amended with 10 mM Na-acetate and 2 mM FeCl2 (as a reducing agent) from sterile, anaerobic stock solutions. The medium for Fe(II)-oxidizing nitrate-reducing bacteria was amended with 0.5 mM Na-acetate, 5 mM NaNO3 and 10 mM FeCl2 from sterile, anaerobic stock solutions. Positive results for acetate-oxidizing nitrate reducers were determined by checking for depletion of NO3− by ion chromatography. Visual assessment of blackening of the medium, and formation of reddish-brown precipitates, was used to identify positive results for Fe(III) reducers and nitrate-dependent Fe(II) oxidizers, respectively.
After the MPN enumerations, the Fe(II) oxidation and Fe(III) reduction products caused by the bacterial function in the corrosion scales of pipe E under different conditions were analyzed using a powder X-ray diffractometer (XRD, X'Pert PRO MPD; PANalytical, The Netherlands) to determine the crystalline phase composition.
3. Results and discussion
3.1. Water quality analysis
The main tap water quality parameters of different pipes are summarized in Table 1. The water source of pipes A–D was groundwater, and the water source of pipelines E–H was surface water. The water from pipes A and B was treated with chlorine dioxide only, and from pipes C and D was treated with chlorine only. The water from pipes E and F was treated with coagulation, sedimentation, filtration and chlorine disinfection, and from G and H was treated with coagulation, sedimentation, filtration, ozonation, biologically activated carbon and chlorine disinfection. The pH was 7.5–8.5, and chlorine residual was 0.2–0.3 mg L−1 for the eight tap waters. There was no significant difference between the eight tap waters (p > 0.05). However, DOC, NO3−-N, Cl−, SO42− and alkalinity were very different in different tap waters (p < 0.05). Therefore, the water source and treatment process may have a great influence on the water quality in different cities. pH, chlorine residual and dissolved organic carbon (DOC) and nitrate were considered to be the most important factors affecting bacterial communities.23,35 Chloride and sulphate had been shown to increase water corrosivity, while higher alkalinity had been demonstrated to reduce the corrosion rate.36,37 Sun et al. and Yang et al. have also indicated that chloride, sulphate and alkalinity affected the potential corrosive bacteria and chemical composition of corrosion scales in the DWDSs.8,14,36 Therefore, the quality of the water in DWDSs could affect the chemical composition and bacterial communities in corrosion scales.3.2. Chemical composition of the corrosion scales
The morphology of the corrosion scales of different pipes is shown by photographs in Fig. S3.† The corrosion scales densely attached to the surface of the pipes, and tubercles formed on the surface of most pipes. Fig. 1 shows the crystalline composition of the corrosion scales in different pipes. XRD patterns for each sample are also shown in Fig. S4.† The content of goethite (α-FeOOH) changed from 13% to 52%, while the content of magnetite (Fe3O4) changed from 19% to 48%. Previous research had indicated that thick and stable scales had a much higher Fe3O4/α-FeOOH ratio (>1.0), while thin and unstable corrosion scales had a lower Fe3O4/α-FeOOH ratio and higher content of γ-FeOOH.8 In our study, the average ratio of Fe3O4/α-FeOOH was about 1.14. Therefore, most of the corrosion scales were thick and stable. However, in corrosion scales of pipe A, the ratio was 0.41, and the content of lepidocrocite (γ-FeOOH) was 34%. This indicated that the corrosion scales in pipe A may be less stable than the corrosion scales from pipes B–H. In tap water of pipe A, DOC concentration was lower (0.29 ± 0.03 mg L−1), and Cl− (167.9 ± 15.8 mg L−1) and SO42− (171.7 ± 15.6 mg L−1) were higher than those of tap waters from pipes B–H (Table 1). Therefore, lower DOC and higher Cl− and SO42− concentration may not be helpful for the stability of corrosion scales in pipes. Moreover, the average content of Fe3O4 in groundwater and surface water pipes was 33.8% and 32.3%, respectively. The average content of α-FeOOH in groundwater and surface water pipes was 47.8% and 26.3%, respectively. Therefore, the ratio of Fe3O4/α-FeOOH was higher in surface water pipes than that in groundwater pipes, suggesting that the corrosion scales in surface water pipes may be more stable than that in groundwater pipes.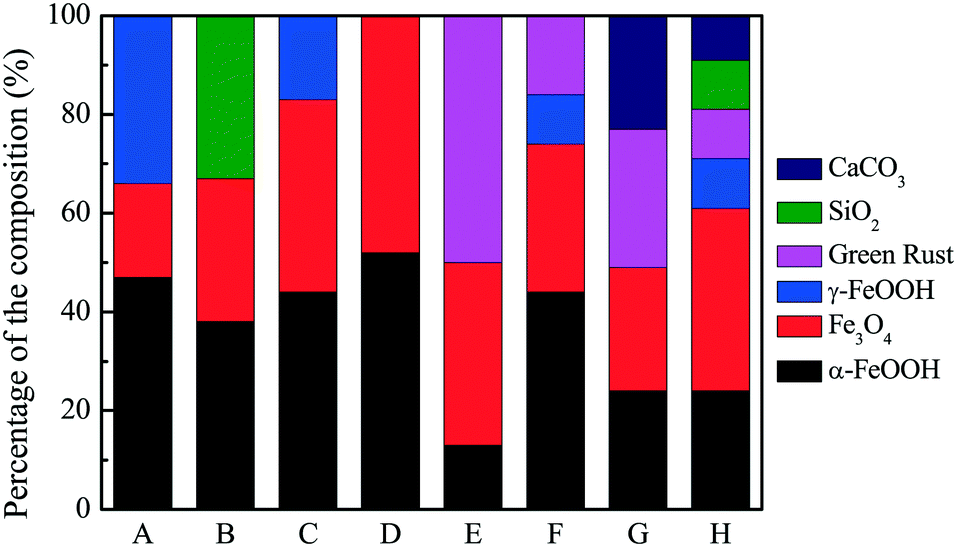 | ||
| Fig. 1 The semi-quantitative composition of corrosion scales from different pipes by analysis of XRD patterns (wt%). | ||
In order to know the iron release of different pipes, two experimental facilities were set up in the laboratory using pipes from cities A and E. The water used was collected from a drinking water plant, and the total iron concentration in the water was less than the limit of detection (<LOD = 10 μg L−1) for the method. After the water was cycled in the pipes for 24 hours, the total iron concentration in the effluents was measured (Fig. 2). The results showed that the total iron concentration in the effluents of both pipes was at a relatively stable value from 24 days to 36 days. The average total iron concentration was 77 ± 3 μg L−1 in the effluents of pipe A, while it was 48 ± 2 μg L−1 in the effluents of pipe E. The total iron concentration was significantly lower in the effluents of pipe E than that of pipe A (p = 0.001). The results indicated that the corrosion scales in pipe A were less stable than those in pipe E. This was consistent with the Fe3O4/α-FeOOH ratio, which was 0.41 and 2.85 in pipes A and E, respectively.
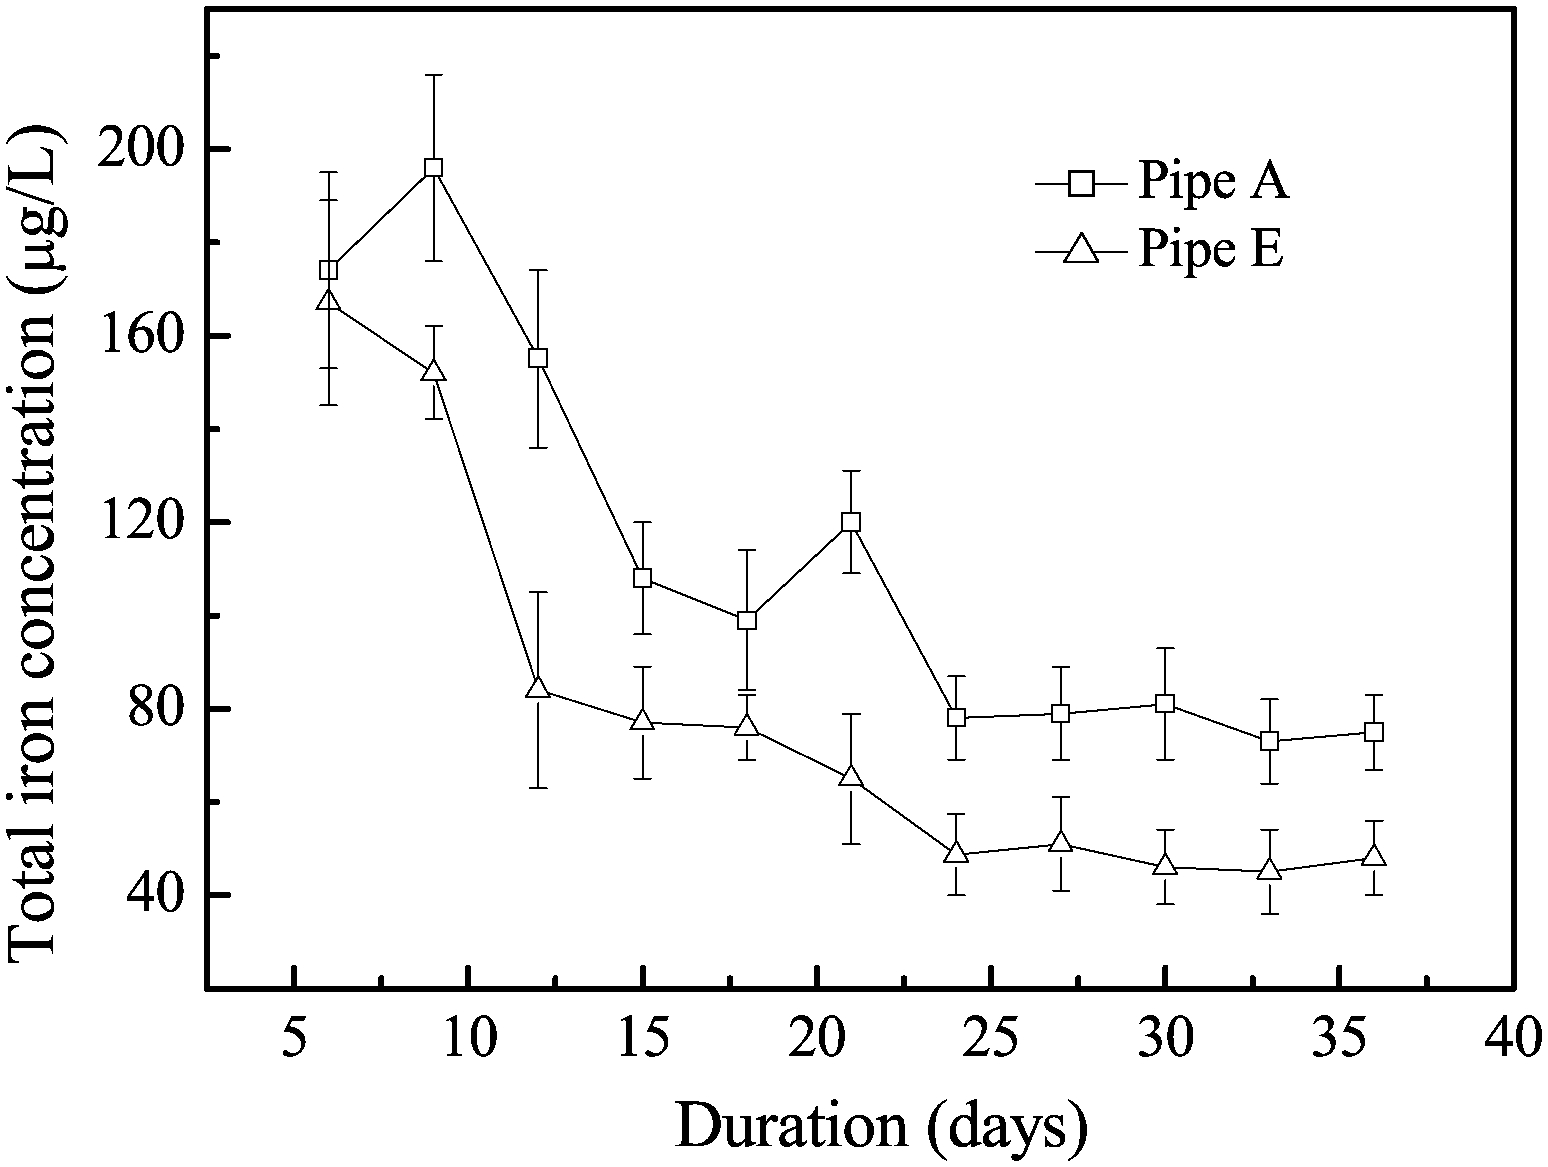 | ||
| Fig. 2 The total iron concentration in the effluents of pipes A and pipe E. Error bars represent the standard deviation from the average of three replications. | ||
Furthermore, green rust (GR) was also always found in the porous core layer of dense corrosion scales in DWDSs.8,38,39 GR was an intermediate compound which was then transformed to α-FeOOH and Fe3O4 to form a dense shell-like layer.39–41 The dense layers of corrosion scales played a positive role in inhibiting the corrosion and iron release of the pipes.8,39,41 In our study, the average content of green rust (GR) (10–51%) was found in corrosion scales of pipes E–H. These pipes were all transporting surface waters. Moreover, quartz (SiO2) was found in corrosion scales of pipes B and H, and calcium carbonate (CaCO3) was present in corrosion scales of pipes G and H. It is likely that CaCO3 could reduce the iron release by decreasing the porosity of the scale,42 making the corrosion scales in pipes become more stable.
3.3. Bacterial community composition of corrosion scales
The bacterial community composition of corrosion scales in the pipes from each city was analyzed using 454 pyrosequencing. The relative abundance of bacterial phyla in different samples is shown in Fig. S5.†Proteobacteria was the main bacterial phylum in all of the corrosion scales, and the relative abundance was from 46.5% to 84.3%. At class level, Alphaproteobacteria was the main bacterial class in corrosion scales of pipe A, and its relative abundance was 40.1% (Fig. 3A). However, Betaproteobacteria was the main bacterial class in other corrosion scales, and the relative abundance was from 28.8% to 56.8% (Fig. 3A). Moreover, Deltaproteobacteria was also high in corrosion scales of pipes E–H, and its relative abundance was from 7.25% to 23.9% (Fig. 3A).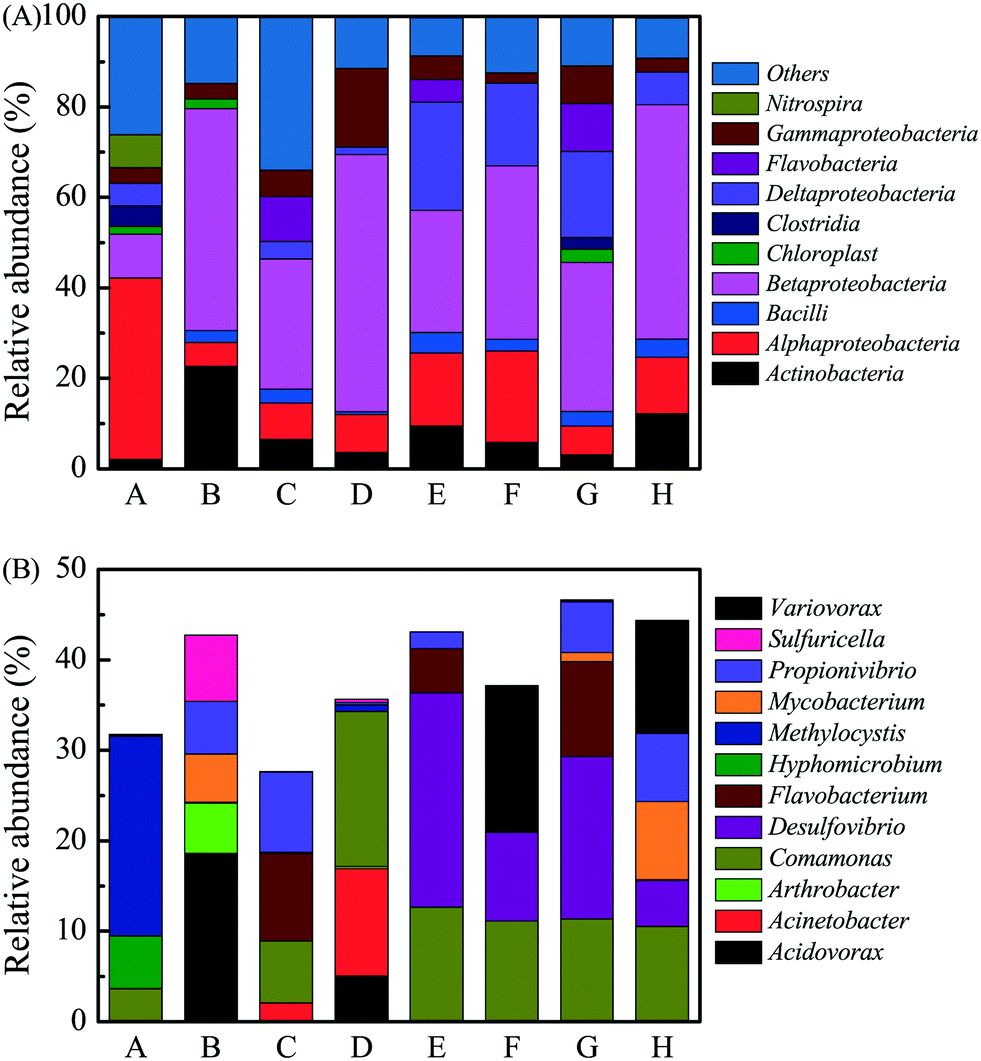 | ||
| Fig. 3 Relative abundance of bacterial classes (A) and genera (B) in corrosion scales from different pipes. The genera which were lower than 5% in all samples are not shown in this figure. | ||
In addition, the analysis based on the genus level allowed us to further verify the bacterial community composition in different samples (Fig. 3B). In the corrosion scales of pipe A, the main bacterial genus was Methylocystis, and its relative abundance was 22.1%. In corrosion scales of pipe B, the main bacterial genus was Acidovorax (18.6%), and the main bacterial genera were Comamonas (6.87%), Flavobacterium (9.66%) and Propionivibrio (8.90%) in corrosion scales of pipe C. However, in corrosion scales of pipe D, the main bacterial genera were Acinetobacter (11.9%) and Comamonas (17.2%). Therefore, the bacterial genera in corrosion scales from pipes A–D which were transporting groundwater changed greatly. However, in corrosion scales of pipes E–H which were transporting surface water, the main bacterial genera were Comamonas (10.6–12.7%) and Desulfovibrio (5.06–23.7%). Although the main bacterial genera had some similarity in some corrosion scales from pipes E–H, the bacterial genera in corrosion scales of these pipes were also changed. For example, the relative abundance of Flavobacterium was high in corrosion scales of pipes E and G, while Variovorax was also high in corrosion scales of pipes F and H. In general, the relative abundance of bacterial genera in corrosion scales was very different in eight cities (p < 0.05), which may be due to the different water quality in the eight drinking water distribution systems.
In order to validate whether the variation of bacterial genera in corrosion scales may be due to the different water quality in eight cities and not to the random variation of the sampling and the 454 pyrosequencing method, three samples from pipe B which was transporting groundwater and three samples from pipe F which was transporting surface water were also analyzed separately using 454 pyrosequencing (Fig. 4). In the three samples of corrosion scales from pipe B, the main bacterial genera were Acidovorax, Arthrobacter, Mycobacterium, Propionivibrio and Sulfuricella, and the relative abundance of these bacterial genera was not different in the three samples (p = 0.96). In corrosion scales from pipe F, the relative abundance of the main bacterial genera was also not different in the three samples (p = 0.99). The results validated that the variation of bacterial genera in corrosion scales from different cities may be due to the different water quality in eight cities rather than the random variation of the sampling and the 454 pyrosequencing method.
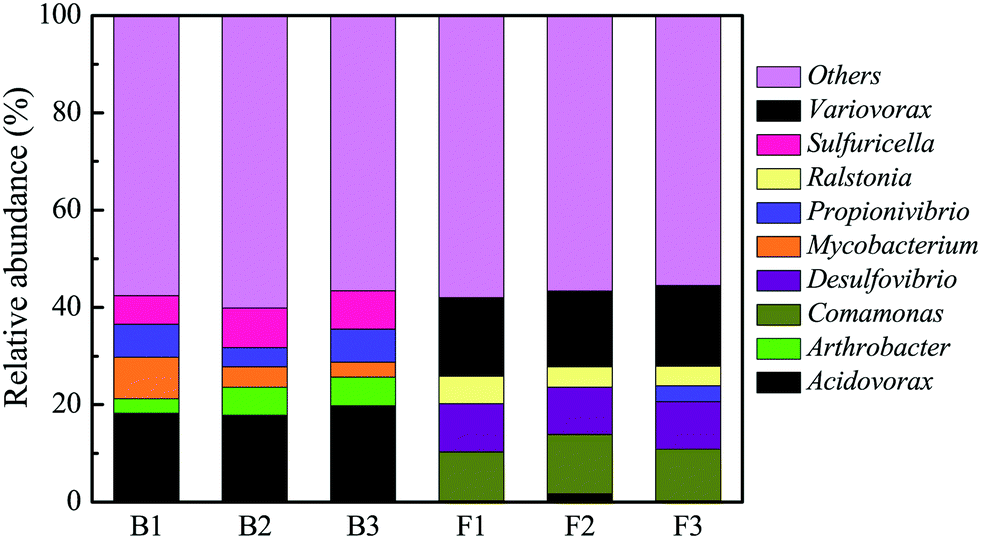 | ||
| Fig. 4 The random variation of relative abundance of bacterial genera in three corrosion scale samples from pipe B which was transporting groundwater and pipe F which was transporting surface water. | ||
3.4. The potential corrosive bacteria and their function
The bacterial communities in corrosion scales were further analyzed in terms of their potential function with respect to iron corrosion. Many studies have indicated that the iron-oxidizing bacteria (IOB), iron-reducing bacteria (IRB), sulfur-oxidizing bacteria (SOB), sulfate-reducing bacteria (SRB), nitrobacteria (NOB), and nitrate-reducing bacteria (NRB) could influence the corrosion process and the composition of the corrosion scales.14,15,43,44 The potential corrosive bacteria were identified at the genus level, and the classification was made according to the above reports (Fig. 5 and Table S3†).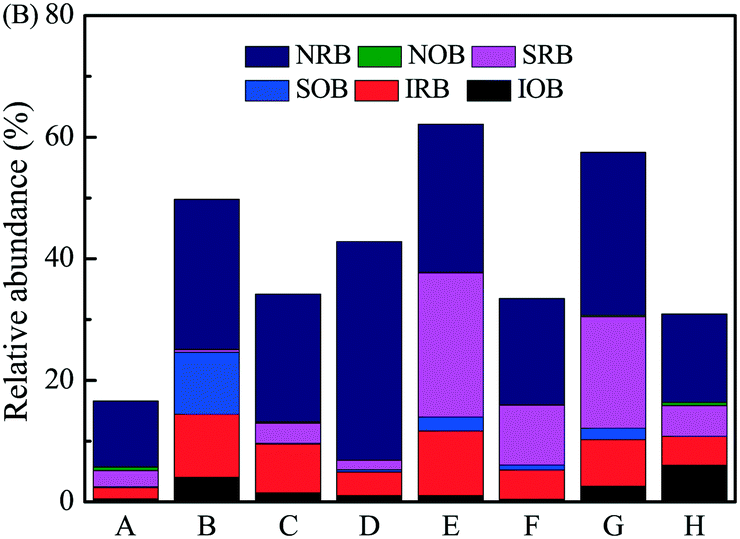 | ||
| Fig. 5 Relative abundance of potential corrosive bacteria at genus level in corrosion scales of different pipes. | ||
The abundance of nitrogen-respiring bacteria related to iron corrosion was found to be 10.9–36.0% (NRB) and 0.03–0.61% (NOB), including Nitrospira and Nitrosospira).14,15 NRB were predominant in all the corrosion scales from different pipes. The most abundant NRB was Comamonas, which was related to Fe(II) oxidation and nitrate reduction.45 The second most abundant bacteria were iron-respiring bacteria, including IRB (1.87–10.6%) and IOB (0.47–6.05%). Gallionella and Geothrix were the most common IOB and IRB present in corrosion scales, respectively,23,44 the relative abundance of which was 0–4.66% and 0–6.40%, respectively. The third most abundant bacteria were sulfur cycling bacteria, including SOB (0.02–10.2%) and SRB (0.43–23.7%). Sulfuricella36 was the most abundant SOB in corrosion scales of pipe B, and the relative abundance was 7.32%. Desulfovibrio44 was the most abundant SRB in corrosion scales of pipes E and G, and the relative abundance was 23.7% and 17.9%, respectively.
From the analysis above, the relative abundance of NRB was the highest among the potential corrosive bacteria in all of the corrosion scales. Therefore, the denitrifying functional genes including nirS, nosZ and nirK were analyzed quantitatively by qPCR (Fig. S6†). In corrosion scales, the gene copy number of nirS, nosZ and nirK changed greatly in different pipes. The total denitrifying gene copy numbers, as the percentage of total bacterial 16S rRNA gene copy numbers, changed from 1.8% to 13.7%. Furthermore, MPN showed that the abundance of culturable Fe(III)-reducing bacteria was 9.5 × 10⁷–7.5 × 10⁸ cells per g, nitrate-dependent Fe(II)-oxidizing bacteria was 1.5 × 10⁷–3.8 × 10⁸ cells per g, and nitrate-reducing bacteria was 4.5 × 10⁸–1.1 × 10¹¹ cells per g in the corrosion scales of different pipes (Table 2).
| Pipes | Acetate + NO3− | Acetate + Fe(III) | Fe(II) + NO3− | |||
|---|---|---|---|---|---|---|
| MPN (cell per g) | 95% confidence interval | MPN (cell per g) | 95% confidence interval | MPN (cell per g) | 95% confidence interval | |
| A | 9.5 × 10⁷ | 1.5 × 10⁷–3.9 × 10⁸ | 9.5 × 10⁷ | 1.5 × 10⁷–3.9 × 10⁸ | 9.5 × 10⁷ | 1.5 × 10⁷–3.9 × 10⁸ |
| B | 1.1 × 10¹⁰ | 1.5 × 10⁹–4.8 × 10¹⁰ | 7.5 × 10⁸ | 1.4 × 10⁸–2.3 × 10⁹ | 1.5 × 10⁹ | 3.0 × 10⁸–4.4 × 10¹⁰ |
| C | 3.0 × 10⁹ | 3.6 × 10⁸–4.9 × 10⁹ | 4.5 × 10⁸ | 7.3 × 10⁷–2.2 × 10⁹ | 7.5 × 10⁸ | 1.4 × 10⁸–2.3 × 10⁹ |
| D | 1.1 × 10¹¹ | 1.5 × 10¹⁰–4.8 × 10¹¹ | 2.5 × 10⁸ | 4.3 × 10⁷–1.3 × 10⁹ | 4.5 × 10⁸ | 7.3 × 10⁷–2.2 × 10⁹ |
| E | 2.0 × 10⁹ | 3.3 × 10⁸–4.7 × 10⁹ | 4.5 × 10⁸ | 7.3 × 10⁷–2.2 × 10⁹ | 4.5 × 10⁸ | 7.3 × 10⁷–2.2 × 10⁹ |
| F | 3.0 × 10⁹ | 3.6 × 10⁸–4.9 × 10⁹ | 2.5 × 10⁸ | 4.3 × 10⁷–1.3 × 10⁹ | 1.5 × 10⁸ | 3.0 × 10⁷–4.4 × 10⁹ |
| G | 4.5 × 10¹⁰ | 6.9 × 10⁹–2.3 × 10¹¹ | 4.5 × 10⁸ | 7.3 × 10⁷–2.2 × 10⁹ | 9.5 × 10⁸ | 1.5 × 10⁸–3.9 × 10⁹ |
| H | 4.5 × 10⁸ | 7.3 × 10⁷–2.2 × 10⁹ | 2.5 × 10⁸ | 4.3 × 10⁷–1.3 × 10⁹ | 2.5 × 10⁹ | 3.8 × 10⁸–1.3 × 10¹⁰ |
After the MPN enumerations, the Fe(II) oxidation and Fe(III) reduction products caused by the bacteria in the corrosion scales from pipe E under different conditions were measured using XRD. In AGW medium with 10 mM FeCl2, reddish-brown precipitates were formed. They were made up of goethite (α-FeOOH) (Fig. 6), which came from the oxidation of Fe(II) by the bacteria in corrosion scales. The concentrations of sodium acetate, NaNO3 and FeCl2 in solution decreased to 0.43, 3.33 and 6.49 mM, respectively, indicating the process of nitrate-dependent Fe(II)-oxidation. In the AGW medium with 10 mM synthetic hydrous ferric oxide, the colour became black. The synthetic hydrous ferric oxide was amorphous; after the MPN experiment, magnetite (Fe3O4) and goethite (α-FeOOH) were precipitated (Fig. 6). Moreover, the concentration of sodium acetate decreased from 10 mM to 7.39 mM, and that of FeCl2 decreased from 2 mM to 0.18 mM. This indicated that the bacteria in corrosion scales could use acetate and Fe(II) as electron acceptors to reduce Fe(III). Because the MPN experiment showed the number of culturable nitrate-reducing, Fe(III)-reducing and nitrate-dependent Fe(II)-oxidizing bacteria in corrosion scales, the results indicated that the bacterial communities could drive active iron redox cycling in the corrosion scales from different pipes.
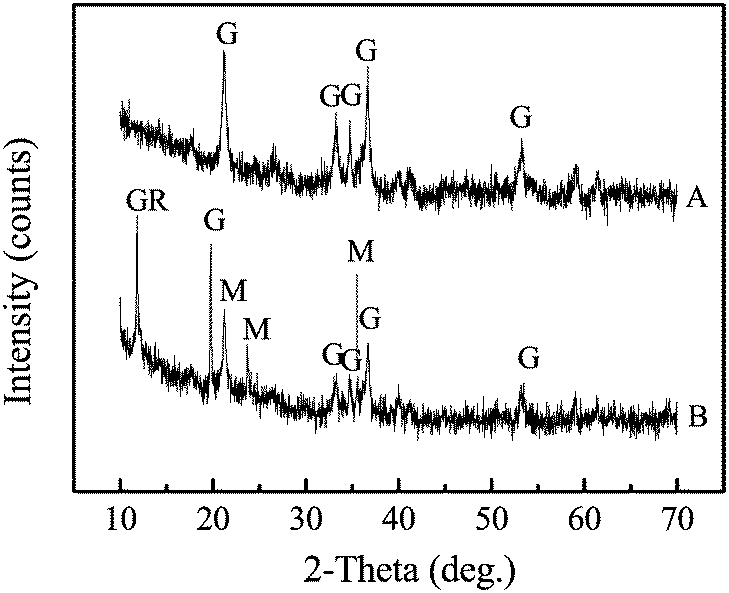 | ||
| Fig. 6 XRD patterns of the Fe(II) oxidation and Fe(III) reduction products caused by the bacteria in the corrosion scales from pipe E under different conditions. (A) NO3− and FeCl2 and (B) synthetic hydrous ferric oxide (G, goethite; M, magnetite; GR, green rust). | ||
3.5. Relationship between bacterial community and chemical composition of corrosion scales
The Fe2+ produced by chemical corrosion can be oxidized to Fe3+ by IOB, and rapid precipitation of bacteriogenic iron oxides could occur.44 The formed amorphous biomineralization products can further transform to α-FeOOH.46 In addition, NRB was also shown to produce Fe(III) oxides including α-FeOOH during the nitrate-dependent Fe(II) oxidation.34,45,47 The biogenic nitrite, which was very reactive in regard to nitrate, abiotically oxidized Fe(II) to green rust (GR).40 Moreover, DO in the corrosion scales was 0.20–0.45 mg L−1 according to a previous study.15 Under this anoxic condition, IRB could respire with Fe(III) oxides and induce Fe3O4 formation.15,36 Moreover, under anoxic or anaerobic conditions, NRB could induce the iron redox cycling process in corrosion scales, promoting Fe3O4 formation.20,21,34 Our previous work also indicated the effects of IOB, IRB and NRB on the corrosion of cast iron pipes, which had only chemical corrosion, using sterile water acting as a reference.21 In this study, the bacterial communities in corrosion scales of real drinking water distribution pipes were characterized. The results showed that there were many potential corrosive bacteria including IOB, IRB and NRB in corrosion scales of different pipes (Fig. 5). MPN results also indicated that these bacteria in corrosion scales were indeed active and had the function of Fe(II) oxidation and Fe(III) reduction, and this iron redox cycling process also could induce formation of different corrosion products including α-FeOOH and Fe3O4 (Table 2 and Fig. 6). Coincidentally, the relative abundance of corrosion potential bacteria was higher in corrosion scales of pipe E, and the Fe3O4/α-FeOOH ratio was also higher, but its iron release was lower compared with that of pipe A (Fig. 1, 2 and 5). This was consistent with other studies, which indicated the effects of IOB, IRB and NRB on corrosion and the effects of Fe3O4/α-FeOOH ratio on iron release.8,14,15 Moreover, SRB Desulfovibrio was also found in the corrosion scales of pipes E–H in which the content of GR was high. Fig. S7† also shows that the content of GR and the relative abundance of SRB Desulfovibrio correlated very well using analysis of standard linear regression and Pearson test (r = 0.963, p = 0.037). This result suggested that the formation of GR may have some relationship with the presence of SRB Desulfovibrio in the corrosion scales. Pineau et al. had verified that the presence of green rust in the inner parts of corrosion scales was helpful for the growth of SRB.41 The SRB Desulfovibrio could induce pitting corrosion;48 however, the α-FeOOH and Fe3O4 formed by the transformation of green rust could protect the iron from corrosion.8,39,41The above results indicated that the potential corrosive bacteria, Fe3O4 and α-FeOOH were present in all the corrosion scales of different drinking water distribution pipes. The potential corrosive bacteria in corrosion scales were active and had the function of iron redox cycling. There was some relationship between the biochemical function of the bacterial community and the formation of Fe3O4 and α-FeOOH in corrosion scales. Moreover, the content of GR correlated very well with the relative abundance of Desulfovibrio. However, in the real drinking water distribution pipes, the water quality may also affect the bacterial community and chemical composition of corrosion scales. Continuous observation of the actual drinking water distribution systems is needed in order to better understand the interaction between the bacterial community and the chemical composition of corrosion scales.
4. Conclusions
The results verified that the main potential corrosive bacteria in corrosion scales were nitrate-reducing bacteria. These bacteria in corrosion scales were indeed active and had the function of Fe(II) oxidation and Fe(III) reduction. Moreover, α-FeOOH and Fe3O4 were the main chemical components of corrosion scales, and green rust was only found in corrosion scales of pipes transporting surface water. There was an apparent relationship between the relevant biochemical functions (e.g., iron redox cycling) of the bacterial community and the formation of α-FeOOH and Fe3O4 in corrosion scales. The corrosion scales with a higher Fe3O4/α-FeOOH ratio showed less iron release than those with a lower ratio. This information will be useful for future control of iron release in actual DWDSs. Because the bacterial genera in corrosion scales are very different in the eight cities, continuous observation of the bacterial community and chemical composition of corrosion scales in actual DWDSs is needed in order to take measures to promote the formation of Fe3O4, which will be helpful for future control of iron concentration in tap water. Furthermore, the content of green rust and the relative abundance of sulfate-reducing bacteria Desulfovibrio correlated very well in corrosion scales. Further work is required to study the interaction between green rust and Desulfovibrio in corrosion scales in order to control the corrosion and iron release of actual cast iron pipes caused by the sulfate-reducing bacteria.Acknowledgements
This work was funded by the National Natural Science Foundation of China (No. 51308529, 51290281).References
- L. S. McNeill and M. Edwards, J. - Am. Water Works Assoc., 2001, 93, 88–100 CAS.
- P. S. Husband and J. B. Boxall, Water Res., 2011, 45, 113–124 CrossRef CAS PubMed.
- K. E. Fish, A. M. Osborn and J. Boxall, Environ. Sci.: Water Res. Technol., 2016, 2, 614–630 Search PubMed.
- P. Sarin, V. L. Snoeyink, D. A. Lytle and W. M. Kriven, J. Environ. Eng., 2004, 130, 364–373 CrossRef CAS.
- P. Sarin, V. L. Snoeyink, J. Bebee, W. M. Kriven and J. A. Clement, Water Res., 2001, 35, 2691–2697 CrossRef.
- Z. J. Tang, S. K. Hong, W. Z. Xiao and J. Taylor, Corros. Sci., 2006, 48, 322–342 CrossRef CAS.
- C. Y. Peng, G. V. Korshin, R. L. Valentine, A. S. Hill, M. J. Friedman and S. H. Reiber, Water Res., 2010, 44, 4570–4580 CrossRef CAS PubMed.
- F. Yang, B. Y. Shi, J. N. Gu, D. S. Wang and M. Yang, Water Res., 2012, 46, 5423–5433 CrossRef CAS PubMed.
- K. Hoehl, G. U. Schoenberger and M. Busch-Stockfisch, Food Qual. Prefer., 2010, 21, 243–249 CrossRef.
- S. Bordoloi, S. K. Nath and R. K. Dutta, Desalination, 2011, 281, 190–198 CrossRef CAS.
- N. P. Cianciotto, BioMetals, 2007, 20, 323–331 CrossRef CAS PubMed.
- D. O. Schwake, E. Garner, O. R. Strom, A. Pruden and M. A. Edwards, Environ. Sci. Technol. Lett., 2016, 3, 311–315 CrossRef.
- C. L. Chun, R. M. Hozalski and W. A. Arnold, Environ. Sci. Technol., 2005, 39, 8528–8532 CrossRef.
- F. Yang, B. Y. Shi, Y. H. Bai, H. F. Sun, D. A. Lytle and D. S. Wang, Water Res., 2014, 59, 46–57 CrossRef CAS PubMed.
- J. T. Jin, G. X. Wu and Y. T. Guan, Water Res., 2015, 71, 207–218 CrossRef CAS PubMed.
- I. Lanneluc, M. Langumier, R. Sabot, M. Jeannin, P. Refait and S. Sable, Int. Biodeterior. Biodegrad., 2015, 99, 55–65 CrossRef CAS.
- L. K. Herrere and H. A. Videla, Int. Biodeterior. Biodegrad., 2009, 63, 891–905 CrossRef.
- K. A. Zarasvand and V. R. Rai, Int. Biodeterior. Biodegrad., 2014, 87, 66–74 CrossRef.
- C. Pantke, M. Obst, K. Benzerara, G. Morin, G. O. Nguema, U. Dippon and A. Kappler, Environ. Sci. Technol., 2012, 46, 1439–1446 CrossRef CAS PubMed.
- K. A. Weber, M. M. Urrutia, P. F. Churchill, R. K. Kukkadapu and E. E. Roden, Environ. Microbiol., 2006, 8, 100–113 CrossRef CAS PubMed.
- H. B. Wang, C. Hu, L. L. Zhang, X. X. Li, Y. Zhang and M. Yang, Water Res., 2014, 65, 362–370 CrossRef CAS PubMed.
- H. B. Wang, C. Hu, L. C. Han and M. Yang, Corros. Sci., 2015, 100, 599–606 CrossRef CAS.
- X. X. Li, H. B. Wang, C. Hu, M. Yang, H. Y. Hu and J. F. Niu, Corros. Sci., 2015, 90, 331–339 CrossRef CAS.
- Y. Zhu, H. B. Wang, X. X. Li, C. Hu, M. Yang and J. H. Qu, Water Res., 2014, 60, 174–181 CrossRef CAS PubMed.
- J. Chen, B. H. Gu, R. A. Royer and W. D. Burgos, Sci. Total Environ., 2003, 307, 167–178 CrossRef CAS PubMed.
- P. W. J. J. van der Wielen and D. wan der Kooij, Appl. Environ. Microbiol., 2013, 79, 825–834 CrossRef CAS PubMed.
- C. Hwang, F. Ling, G. L. Andersen, M. W. LeChevallier and W. T. Liu, Appl. Environ. Microbiol., 2012, 78, 7856–7865 CrossRef CAS PubMed.
- C. K. Gomez-Smith, T. M. LaPara and R. M. Hozalski, Environ. Sci. Technol., 2015, 49, 8432–8440 CrossRef CAS PubMed.
- P. Sarin, J. A. Clement, V. L. Snoeyink and W. M. Kriven, J. - Am. Water Works Assoc., 2003, 95, 85–96 CAS.
- EPA of China, Analysis method for water and waste water, Press of Chinese Environmental Science, 2002 Search PubMed.
- H. Wang, S. Masters, Y. J. Hong, J. Stallings, J. O. Falkinham III, M. A. Edwards and A. Pruden, Environ. Sci. Technol., 2012, 46, 11566–11574 CrossRef CAS PubMed.
- M. T. Suzuki, L. T. Taylor and E. F. DeLong, Appl. Environ. Microbiol., 2000, 66, 4605–4614 CrossRef CAS PubMed.
- I. N. Throback, K. Enwall, A. Jarvis and S. Hallin, FEMS Microbiol. Ecol., 2004, 49, 401–407 CrossRef CAS PubMed.
- A. J. Coby, F. Picardal, E. Shelobolina, H. F. Xu and E. E. Roden, Appl. Environ. Microbiol., 2011, 77, 6036–6042 CrossRef CAS PubMed.
- S. Ndiongue, P. M. Huck and R. M. Slawson, Water Res., 2005, 39, 953–964 CrossRef CAS PubMed.
- H. F. Sun, B. Y. Shi, Y. H. Bai and D. S. Wang, Sci. Total Environ., 2014, 472, 99–107 CrossRef CAS PubMed.
- N. Shani, P. Rossi and C. Holliger, Environ. Sci. Technol., 2013, 47, 6836–6845 CAS.
- J. Swietlik, U. Raczyk-Stanislawiak, P. Piszora and J. Nawrocki, Water Res., 2012, 46, 1–10 CrossRef CAS PubMed.
- P. Sarin, V. L. Snoeyink, D. A. Lytle and W. M. Kriven, J. Environ. Eng., 2004, 130, 364–373 CrossRef CAS.
- M. Etique, F. P. A. Jorand, A. Zegeye, B. Gregoire, C. Despas and C. Ruby, Environ. Sci. Technol., 2014, 48, 3742–3751 CrossRef CAS PubMed.
- S. Pineau, R. Sabot, L. Quillet, M. Jeannin, Ch. Caplat, I. Dupont-Morral and Ph. Refait, Corros. Sci., 2008, 50, 1099–1111 CrossRef CAS.
- H. B. Wang, C. Hu, X. X. Hu, M. Yang and J. H. Qu, Water Res., 2012, 46, 1070–1078 CrossRef CAS PubMed.
- J. P. Shapleigh, The Denitrifying Prokaryotes, in Prokaryotes, Springer Press, 2006, vol. 2, pp. 769–792 Search PubMed.
- H. F. Sun, B. Y. Shi, D. A. Lytle, Y. H. Bai and D. S. Wang, Environ. Sci.: Processes Impacts, 2014, 16, 576–585 CAS.
- M. Blothe and E. Roden, Appl. Environ. Microbiol., 2009, 75, 6937–6940 CrossRef CAS PubMed.
- Z. J. Wu, L. X. Yuan, N. Jia, Y. H. Wang and L. G. Sun, Geochem. J., 2009, 43, 167–177 CrossRef CAS.
- A. Chakraborty and F. Picardal, Appl. Environ. Microbiol., 2013, 79, 748–752 CrossRef CAS PubMed.
- C. M. Xu, Y. H. Zhang, G. X. Cheng and W. S. Zhu, Mater. Charact., 2008, 59, 245–255 CrossRef CAS.
Footnote |
| † Electronic supplementary information (ESI) available. See DOI: 10.1039/c6ew00264a |
| This journal is © The Royal Society of Chemistry 2017 |