Carbon nanofibers as a micronutrient carrier in plants: efficient translocation and controlled release of Cu nanoparticles†
Mohammad
Ashfaq
ab,
Nishith
Verma
*ac and
Suphiya
Khan
b
aCenter for Environmental Science and Engineering, Indian Institute of Technology Kanpur, Kanpur 208016, India. E-mail: vermanishith@gmail.com; Fax: +91 512 259 0104; Tel: +91 512 259 7704
bDepartment of Bioscience and Biotechnology, Banasthali University, Banasthali 304022, India
cDepartment of Chemical Engineering, Indian Institute of Technology Kanpur, Kanpur 208016, India
First published on 14th November 2016
Abstract
An aqueous colloidal dispersion (∼230 nm average size) of the copper (Cu) nanoparticle (NP)-grown carbon nanofibers (CNFs) was used as a stimulant for crop yields. The Cu-CNFs (average diameter = 95 nm), separately prepared on an activated carbon microfiber substrate using chemical vapor deposition, were dispersed in Cicer arietinum seed-containing water. The CNFs served as a carrier for the Cu micronutrient, with a controlled release of the Cu NPs. The CNFs also served as a growth stimulant by increasing the water uptake capacity of the plants. The scanning electron microscopy images, elemental (Cu/C) mapping, and atomic absorption spectrometry data corroborated the effective translocation of the Cu-CNFs from the root to the shoot of the plants. The water uptake capacity, germination rate, shoot and root lengths, and chlorophyll and protein contents significantly increased in the plants using the Cu-CNFs. This is the first study showing the use of the Cu-CNFs as a carrier of micronutrients in plants, with an effective translocation ability.
Environmental significanceThe evidence for carbon nanofibers (CNFs) as a carrier for the Cu NP micronutrients in plant tissues, with easy translocation and slow release of the micronutrients is successfully provided. The translocation ability of the Cu-CNFs is attributed to their nano size and their negatively charged surface. The significantly high germination rate, water uptake capacity, and chlorophyll and protein contents measured in the plants grown using the Cu-CNFs are clearly an indication of the nanotechnology successfully being used for agricultural applications. |
1. Introduction
At present, several materials are used as a stimulant for the germination of seeds and the growth of plants, and also, to protect crops from pathogenic diseases.1 With increasing applications of nanotechnology in several areas, a variety of nanomaterials have been developed in the past decade for agricultural and food applications. In this context, different metal and metal oxide nanoparticles (NPs) have been used for augmenting the germination of seeds and plant growth.2–8 Recently, carbon-based materials including carbon nanotubes (CNTs) have been used as a stimulant for plant growth. The CNTs can penetrate the seed coat, enhancing water uptake and seed-germination.9–13The aforementioned and many more studies have focused on the effects of metal- and carbon-based nanomaterials on the various developmental aspects of plants, including water uptake capacity, photosynthetic processes, electron transport systems, and nutritional quality.14,15 Despite several positive aspects of using nanomaterials as a growth stimulant, an ineffective dispersion, large accumulation, and abrupt release of nutrients during practical use remain a concern. The agglomeration of the metal NPs and CNTs in aqueous media also reduces their effectiveness. Therefore, various methods such as surface functionalization, ultra-sonication, and surfactant-mediated stabilization have been used to minimize the agglomeration and increase the mono-dispersion of nanomaterials.16,17 However, inconsistency in reproducibility and behaviour may arise from the variability of the nanomaterials and dispersion processes.18 Furthermore, a few studies have shown that metal nanoparticles were accumulated in the roots and not translocated to the shoots.19–21 In such cases, the accumulated nanomaterials showed phytotoxicity.22,23 From the overview of the aforesaid studies, it is clear that there is a necessity to develop an effective nanomaterial-based carrier that can easily translocate and deliver micronutrients with slow release in the plants.
Recently, the transition metal NP-grown carbon nanofibers (CNFs) were used for a wide range of applications including environmental remediation,16 antibacterial activities,24 purification of bioactive agents,25 drug delivery,26 and nano-antibiotics.27 Copper (Cu) is recognized as an essential micro-nutrient. It plays a crucial role in the synthesis of RNA, required for photosystem activity and cell wall metabolism, signaling plant growth.28–30 Furthermore, the Cu-CNFs show a negligible toxicity, when compared with the other carbon-based materials including CNTs.31 Therefore, Cu-CNF is a potential nanomaterial as the carrier for micronutrients and stimulant of plant growth, and is the focus of the present study.
In the following section, the synthesis of Cu-CNFs is described. The release profiles of the Cu NPs, and their effects on the germination of gram (Cicer arietinum) seeds and the growth of the plants are studied next. Cicer arietinum is an important legume crop because of its high protein contents, and is considered to be a substitute for meat.32 The translocation of the Cu-CNFs from root to shoot is experimentally demonstrated and the effects of translocation on plant growth parameters such as water uptake capacity, germination rates, root and shoot lengths, chlorophyll and protein contents are studied.
2. Materials and methods
2.1. Chemicals
Copper nitrate (Cu(NO3)2·3H2O), sodium dodecyl sulfate (SDS), bovine serum albumin (BSA), sodium chloride (NaCl), and potassium sodium tartrate were purchased from Merck, Germany. Propidium iodide (PI) dye was purchased from Invitrogen, India. Hydrogen, nitrogen, and acetylene gases were purchased from Sigma Gases, India. The phenolic resin-based activated carbon microfibers (ACFs) were procured from Kynol, Japan. All chemicals used were of high purity grade. The Cicer arietinum seeds were purchased from a local supplier. All solutions were prepared using Milli-Q water (Milli-Q, Integral A-10 system, France).2.2. Preparation of Cu-CNFs
The as-received ACF samples were pre-treated with 0.05 M HNO3 solution at 80 °C for 2 h. After the pre-treatment, the ACFs were washed several times with Milli-Q water and then dried in still air at room temperature (∼30 °C) for 6 h and in an oven at 120 °C for another 12 h to remove impurity ions from the surface of the ACFs.The pre-treated ACF sample (7 cm × 15 cm) was impregnated with an aqueous solution of 0.4 M Cu(NO3)2·3H2O salts for 6 h under flow conditions, using a peristaltic pump (rpm = 100). The SDS surfactant was used for improving the mono-dispersion of the metal salt particles in the impregnating solution and increasing the metal loadings in the ACF substrate. The impregnated ACF sample was dried at room temperature for 3 h, followed by drying in an oven at 120 °C for 2 h. The dried Cu(NO3)-ACF sample was calcined at 200 °C for 4 h in a nitrogen atmosphere in a vertical furnace. After calcination, the CuO-ACF sample was reduced at 350 °C for 2 h using hydrogen gas at 200 standard cubic centimetre per min (sccm) to produce Cu-ACF. The CNFs were grown on the prepared Cu-ACF, using chemical vapor deposition (CVD). The CVD was performed at 290 °C for 30 min, using acetylene as a carbon source to produce the micro-nano sized multiscale web of Cu-CNF/ACF.31 Next, the samples were ball milled (Restch, Germany) for 15 min to remove/detach the ACFs from the web, producing the Cu-CNFs (∼200 nm in length). The ball-milled mixture of the ACFs and Cu-CNFs was dispersed in water and separated using centrifugation. Some samples of the Cu-CNFs were ultrasonicated for 5 min in a 100 mL volume of 0.03 M HNO3 solution to remove the Cu NPs from the tips of the CNFs. The prepared CNF (without Cu) samples were washed several times with water until the pH of the surface was measured to be ∼7.0. The samples were then dried in an oven at 200 °C. Some samples of the ACFs and Cu-ACFs were also ball milled. The prepared CNFs, ACFs, and Cu-ACFs were used for comparison purposes. The Cu NPs (without a support) were synthesized from the nitrate precursor by calcination and reduction, to comparatively assess the translocation ability of the Cu micronutrients alone (without a CNF support) and their effects on plant growth. The Cu nitrate salt was calcined at 200 °C in a N2 atmosphere and then reduced using hydrogen (200 sccm) at 350 °C to prepare Cu in its metallic (zero valent) state. The prepared materials were dispersed in water and used as a micronutrient for comparison purposes in plant growth tests.
2.3. Cu metal release profiles
Release profiles of Cu from the Cu-ACFs and Cu-CNFs in water were determined using atomic absorption analysis (AAS) (Varian AA-240, USA). Approximately 20 mg of the Cu-ACF and Cu-CNF samples were transferred into different vials (15 for each material), each containing 10 mL Milli-Q water. The vials were kept at room temperature. The material-dispersed water samples were taken out at different time intervals over 15 days, using syringe filters. Approximately 5 mL volume of the filtered samples was mixed with 5 mL Milli-Q water and used for AAS analysis.2.4. Seed germination and plant growth
Germination of Cicer arietinum seed was carried out using the method described in the previous study,32 with some modifications. The Cicer arietinum seeds were disinfected for 10 min, using 70% (v/v) ethanol, and then dried in an oven at 70 °C for 3 h. Two sterile filter papers were kept at the bottom of the Petri dishes. The seeds were placed on the filter papers. Each dish contained ∼5 mL volume of water mixed with the CNFs at different concentrations (10–500 μg mL−1). Next, the seeds were incubated at 25 °C for 3 days. The emergence of a radicle from the seed coats was considered to be the criterion for germination. After 5 days, the plants were transferred to different vials containing approximately 5 mL of the Cu-CNF-dispersed water. The growth of the plants was monitored for 20 days. A similar procedure was repeated on the plants that were grown using ACF, Cu-ACF, and without any materials (serving as the control). The germination percentage and index were calculated as follows:2.5. Translocation of Cu in the plant samples
Tissues (root, shoot and leaf) of the plants separately grown using 500 μg mL−1 of the Cu, Cu-ACFs, and Cu-CNFs in water were used as the test samples. The samples were dried at 60 °C. The dried samples were ground using a pestle and mortar. Approximately 100 mg of the ground samples were transferred into different vials containing 2 mL HNO3, and digested for 24 h at room temperature. Approximately 0.2 mL of the digested samples was mixed with 10 ml of DI water and filtered using Millipore syringe filters. The procedure was repeated for the samples drawn over different time intervals (5, 10, 15 and 20 days). The metal content of the samples was determined using the AAS equipped with a graphite furnace (GTA 120, 200 series AA, Agilent Tech, USA).2.6. Measurement of chlorophyll contents
Chlorophyll contents of the leaf samples were determined using the procedure described in the previous study.4 Briefly, ∼300 mg of leaves were ground. The ground leaves were mixed with ∼10 mL of 80% acetone and the mixture was left overnight at 4 °C. The incubated sample was centrifuged at 1250g for 10 min. The supernatant was collected in a tube for determining the chlorophyll contents, using a UV-vis spectrophotometer (Varian Cary 100, Germany). The absorbance was measured at 645 and 663 nm wavelengths. The chlorophyll contents were determined as follows:2.7. Measurement of protein contents
Protein contents of shoots were determined using the previously described procedure.33 Approximately 500 mg of shoots were ground. The ground materials were mixed with ∼5 mL of PBS in a tube and incubated at room temperature for 1 h. The sample was centrifuged at 1250g for 30 min. The supernatant was collected in a tube for determining the protein contents. Approximately 1 mL of the supernatant was mixed with 5 mL of an alkaline-copper solution. Next, 500 μL of Folin reagents was added to the supernatant-mixed alkaline solution and the mixture was incubated in darkness at room temperature for 30 min. The protein in the solution was measured at 660 nm wavelength, using a UV-vis spectrophotometer. The entire procedure was repeated for a BSA solution, which served as the standard.2.8. Microscopic analysis
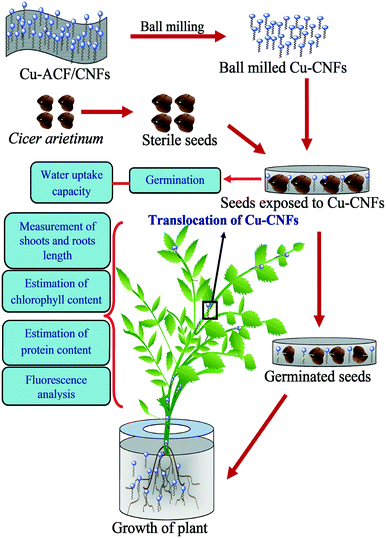
The bright field microscopy images of the plant root, shoot and leaf samples were taken to visually examine the translocation of the Cu-CNFs in the plant tissues. Nucleic acid contents in the plant tissues were determined using a fluorescence microscope (Leica, DM-2000, Germany) and PI dye. The tissues were immersed in 10 μg mL−1 solution of the dye in PBS and left to stain for 10 min. The images were taken at 555 nm wavelength, using a 10× magnification lens with a red filter.The above-described tests were also performed on the plants that were grown using the ACF substrate. A few tests were also performed on the plants that were grown without using any material (nutrient) for comparison purposes. Such plants served as the control in the study. All tests were performed in triplicate to determine the reproducibility. Fig. 1 shows a schematic representation of seed germination and plant growth using the Cu-CNFs.
2.9. Statistical analysis
The data are represented as mean ± standard deviation (SD) in triplicate for each concentration. The statistical significance between the material and the concentration groups was calculated using ANOVA, followed by the Bonferroni post-test using Graph-Pad software. The p-value < 0.05 was considered to be significant.3. Material surface characterization
The prepared materials (ACF, Cu-ACF, Cu-CNF and CNF) and the plants grown with/without the materials were characterized for their physicochemical properties, using different analytical techniques. The surface and cellular morphologies of the materials and plants were observed using a field emission scanning electron microscope (FE-SEM) (Supra 40 VP, Zeiss, Germany). Prior to SEM imaging, shoots were cut into thin longitudinal sections, using a sharp blade. The thin sections of the shoots were immersed in ∼5% glutaraldehyde–PBS buffer for 3 h at room temperature and then dehydrated using ethanol. The samples were dried using supercritical CO2 (Parr Instruments, U.S.A). The dried samples were then gold sputtered. The elemental analysis and mappings of the plant samples were taken at different locations (areas) of the shoot samples, using energy dispersive X-ray (EDX) (Oxford, Inca, Germany). The particle size distribution (PSD) of the ball-milled ACF, Cu-ACF, and Cu-CNF samples was determined using a particle size analyser (Microtrac, Bluewave model, Germany). The zeta potential (ζ) of the prepared materials was measured at pH ∼7.4, using a Zetasizer Nano ZS (Malvern, UK) instrument. Thermo-gravitational analysis (TGA) (Toledo-Mettler, USA) was performed to determine the moisture content or water uptake of the seeds exposed to different materials over the temperature range of 20–200 °C. The moisture content of the dry seeds was used as the reference. AAS analysis of the Cu salt solutions used for impregnating the ACFs was performed at 324.8 nm wavelength, using a C2H2 flame. The Cu-loading (∼398 mg g−1) in the ACFs was determined from AAS analysis of the pre- and post-impregnated solutions. The elemental carbon (EC), organic carbon (OC) and total carbon (TC) contents of the plants (shoots) grown with and without (control) Cu-CNFs were determined using the EC/OC analyser (Sunset Laboratory Inc, OC-EC, 5 L model, USA) and the National Institute of Occupational Safety and Health (NIOSH) 5040 protocol.34 Briefly, approximately 200 μg of the samples were dispersed/spread on a 1.5 cm2 area quartz-fiber filter. Pyrolysis (catalytic oxidation) was performed, with the sample temperature gradually increased to 900 °C. The oxidation was followed by reduction to convert the produced CO2 gas into methane. The OC and EC contents were measured using flame ionization.4. Results and discussion
4.1. SEM and EDX analysis
Fig. 2(a–a1) show the SEM images of the Cu-CNF samples. The shiny metal NPs were located at the tips of the CNFs. Some NPs were present in the middle of the fibers. Fig. 2(b–b1) show the SEM images of the control, i.e., the plant (shoot) grown without using the Cu-CNFs. Fig. 2(c–c1) show the images of the plants grown using the Cu-CNFs. A clear difference was observed between the morphology of these plants. The walls of the cellular compartments in the plants treated with the Cu-CNFs were well developed, indicating the growth of the healthy plants. The compartments in the former samples (control) were rather incomplete or not completely developed. The high magnification (10 KX) image of the plants that were grown using the Cu-CNFs showed the presence of the fibers in the shoot, confirming the translocations of the Cu-CNFs. No fibers were observed in the control samples.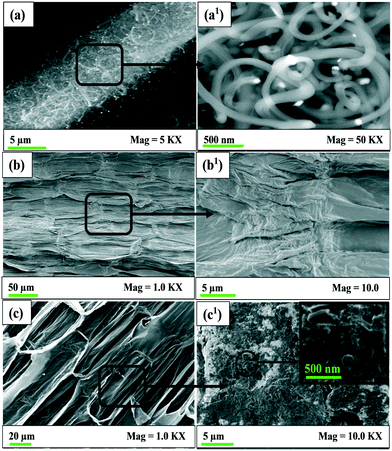 | ||
| Fig. 2 SEM images of (a) Cu-CNFs, (b) plant (shoot) grown without Cu-CNFs (control), and (c) with Cu-CNFs. | ||
Fig. 3(a–a1) show the elemental analysis data for the control samples and the plants grown with the Cu-CNFs. The data confirmed the increased amount of C in the Cu-CNF-grown plants, relative to that in the control plants (grown using without nutrients). Also, EDX analysis showed the presence of Cu in the Cu-CNF-grown plants. No Cu was detected in the control samples, indicating the translocation of the Cu-CNFs. The translocation occurred through the xylem tissues. The data showed a significant increase (∼30%) in carbon contents, relative to that in the control samples, and also, the presence of Cu in the plants grown with the Cu-CNFs. No Cu was detected in the control samples. Oxygen (O), sodium (Na), potassium (K), and chlorine (Cl) were detected in all samples. These elements are inherently present in the plant tissues. The elemental mapping shows the presence and an approximately uniform distribution of C (red dots) and Cu (green dots) in the shoots (Fig. 3b).
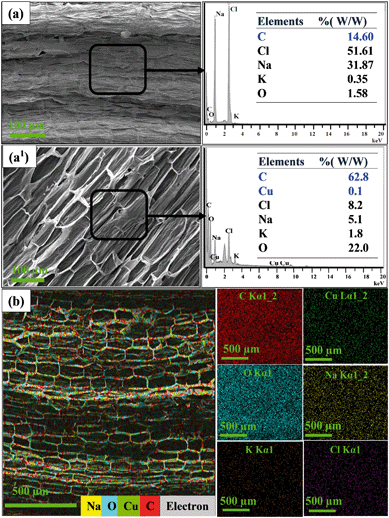 | ||
| Fig. 3 Elemental analysis of plant shoot (a) without and (a1) with Cu-CNFs, and (b) mapping of plant (shoot) grown using the Cu-CNFs. | ||
4.2. Elemental and organic carbon analysis
Fig. 4 shows the EC, OC and TC contents of different samples, including Cu-CNFs. There are three salient observations. (1) The major carbon contents in the Cu-CNFs are in elemental form (∼86%), attributed to the graphitic characteristics of the CNFs.35 The EC contents of similar carbon-based nanomaterials such as CNTs, fullerenes, and graphenes are also reported to be substantially high (∼90%).36 (2) The EC contents of the plants (control) grown without nutrients are negligible (<1%), the OC being the main constituent of TC in the samples. (3) A significant increase in both EC and OC is observed in the plants grown using the Cu-CNFs. Approximately 15% increase in the EC content of such samples, with respect to that in the control, clearly indicates the successful translocation of the CNFs in the shoots. Furthermore, the OC content also increased in the plants, which is attributed to the growth of the plants using the Cu-CNF micronutrients. These data are consistent with the SEM and EDX analysis discussed earlier.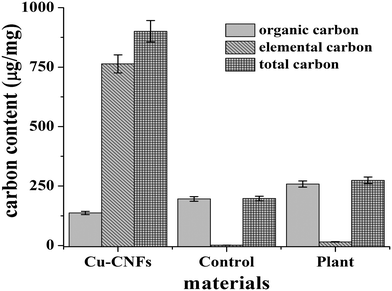 | ||
| Fig. 4 The EC, OC and TC contents of the Cu-CNFs, the control (without micronutrients), and the plant grown with the Cu-CNFs. | ||
4.3. Fiber size analysis
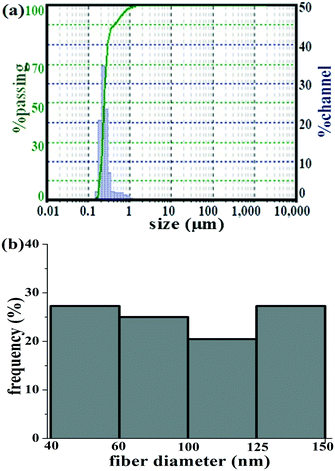
The average particle size of the Cu-CNFs used in this study was determined to be approximately 230 nm (Fig. 5a). The relatively smaller particle size facilitated the translocation of the materials in the plants, as shown by SEM and EDX analysis. It is worth mentioning that carbon-based materials including CNTs of ∼500 nm or less can easily be translocated in the plant tissues.37The size (diameter) of the Cu-CNFs is a critical parameter for the efficient (facile) translocation of the fiber, because it has to move across the root epidermis to cortex to the vascular bundle of the xylem and phloem. The micronutrients are then translocated to shoots and leaves via the intracellular plasmodesmata and cellular wall networks. Osmotic pressure and capillary actions are the driving forces of such translocation.38
The average diameter of the CNFs was determined from the SEM images of the material, using Image-J (1.48G version) software. Fig. 5b shows the histogram of the fiber diameter. The mean diameter of the Cu-CNFs was measured to be 95 ± 35 nm. Approximately 27% of the fibers were found to be in the size range of 40–60 nm. Therefore, the Cu-CNFs having a diameter less than 60 nm were translocated via plasmodesmata whose average pore size is between 50 and 60 nm, whereas the Cu-CNFs of greater than 60 nm size reached vascular tissues through the symplastic and apoplastic routes.1,37,38 Several studies have revealed that CNTs with a diameter ranging between 30 and 100 nm were translocated in vacuoles, nuclei, and plastids, whereas the relatively larger sized (more than 200 nm) CNTs were accumulated in the subcellular organelles of the plants.37,38
4.4. Zeta potential (ζ)
The surface charge of a material significantly affects its translocation through the xylem in plants. The ACFs, Cu-ACFs and Cu-CNFs exhibited ∼0.36, 2.03 and −17.46 mV, respectively. The Cu-CNFs possess π–π electrons in the graphitic layer. The CNFs also contain negatively charged functional groups such as carboxylic and hydroxyl groups, which make the surface negatively charged.25 The positively charged Cu-ACFs and neutral ACFs were accumulated on the surface of the plant roots, because of a strong electrostatic force between the ACFs, Cu-ACFs and the negatively charged polysaccharide present at the surface of the roots. In such cases, the translocation of the materials did not occur from the epidermis to the cortex and vascular bundles. On the contrary, the negatively charged Cu-CNFs were relatively less accumulated and could be translocated from the roots to the shoots through the xylem inside the plants, because of the electrostatic repulsion. The negatively charged CNFs also had the ability to penetrate the seed coat, like the CNTs do.13,394.5. Metal release profiles
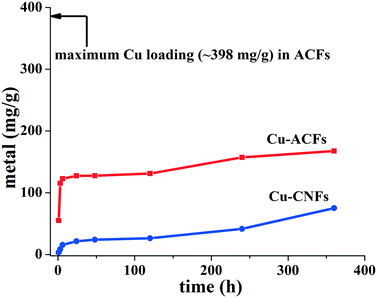
Fig. 6 describes the metal release profiles of the Cu-ACF and Cu-CNF samples. Approximately 30% of the total Cu metals impregnated in the ACFs were released within 6 h of the application. The release of the metal increased to ∼45% within 15 days. No such outburst of the metals was observed for the Cu-CNFs, with only ∼5% of the total metal contents in the material released within the first few hours. The latter release was slow, indicating that the Cu was firmly held at the tips of the Cu-CNFs. The metals at the tip of the nanofibers were relatively more exposed to the plant tissues. Yet the Cu NPs were slowly released. The NPs will be ionized as Cu2+ in aqueous solution.4.6. Water uptake capacity and seed germination
Fig. 7a and b show the TGA data for the seeds that were incubated for two days (at the incipience of germination) and exposed to different materials. The data are shown in weight percent (%) relative to the initial weight of the materials. Negligible change in the weight was observed in the dry seeds (Fig. 7a). The control samples (wet seeds without using nutrients) showed ∼40% weight loss. The seeds exposed to the Cu-CNF samples exhibited a significantly large weight loss, indicating the higher moisture content or water uptake capacity of the Cu-CNFs than that of the other materials (Fig. 7b). The metal NPs and CNFs improved the osmotic conditions, resulting in an increase in the water uptake capacity of the seeds.15,40 Moreover, the micron sized ACFs and Cu-ACFs could not penetrate the seed coat and were accumulated on the surface of the seeds, whereas the nano sized CNFs were able to penetrate the seed coat through its lipid membranes.11 A high water uptake capacity of the seeds is necessary for germination.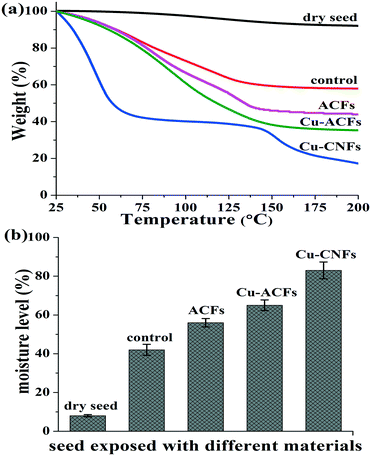 | ||
| Fig. 7 (a) TGA data, (b) moisture contents of the seeds incubated with or without nutrients. The data are presented with the mean and standard deviation (n = 3). | ||
Table 1 shows the effect of the prepared materials on seed germination, using different concentrations (50, 100 and 500 μg mL−1). The use of the Cu-CNFs showed the highest percentage germination (relative to the initial number of seeds). Approximately 98% germination was achieved using the Cu-CNFs at a 500 μg mL−1 dose. The table also summarizes the germination index for the different materials, indicating their relative effects on germination. Fig. 8 shows the photographic images of the five day germinated seeds and seven day seedling-grown plants. The relatively larger water uptake in the plant tissues using the Cu-CNFs possibly helped to achieve the complete hydration of proteins in the seeds, which could facilitate the restoration of the enzymatic activity, triggering the seed germination and growth at a relatively higher rate, as was also indicated in other studies.7,40
| Material | Germination (%) | Germination index (GI)a | ||||
|---|---|---|---|---|---|---|
| Concentration ( μg mL−1) | Concentration ( μg mL−1) | |||||
| 50 | 100 | 500 | 50 | 100 | 500 | |
| a Data are presented with mean and standard deviation and n (replicates) = 5. | ||||||
| Control | 62.5 ± 3 | 62.5 ± 3 | 62.5 ± 3 | 0.73 ± 0.1 | 0.73 ± 0.1 | 0.73 ± 0.1 |
| ACF | 65.0 ± 5 | 85.0 ± 4 | 66.0 ± 3 | 1.13 ± 0.2 | 1.16 ± 0.1 | 1.13 ± 0.1 |
| Cu-ACF | 70.0 ± 3 | 87.5 ± 2 | 74.0 ± 4 | 1.33 ± 0.3 | 1.33 ± 0.1 | 1.06 ± 0.3 |
| Cu | 76.0 ± 5 | 88.0 ± 4 | 72.0 ± 3 | 1.40 ± 0.2 | 1.46 ± 0.3 | 1.00 ± 0.3 |
| CNF | 78.0 ± 3 | 90.0 ± 3 | 92.0 ± 2 | 1.50 ± 0.3 | 1.63 ± 0.3 | 1.83 ± 0.5 |
| Cu-CNF | 82.5 ± 1 | 97.5 ± 2 | 98.0 ± 2 | 1.76 ± 0.1 | 1.90 ± 0.2 | 1.96 ± 0.3 |
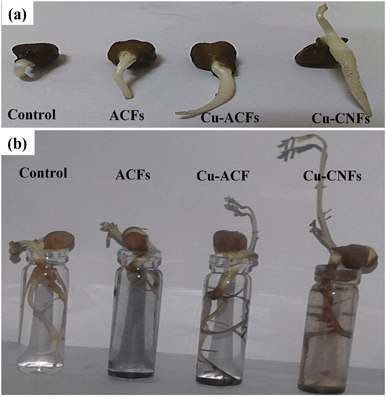 | ||
| Fig. 8 (a) Germination of the seeds exposed to different materials, (b) seedling growth after 7 days. | ||
4.7. Plant growth measurements
Fig. 9(a and b) describe the shoot and root lengths of the Cicer arietinum plants, grown using different materials. The lengths increased with increasing concentrations (doses) of the materials. There were two salient features of the growth. (1) The shoot and root lengths of the plant were significantly greater for the Cu-CNFs than those for the other materials, indicating the effectiveness of the Cu-CNFs as the growth stimulant. (2) A similar trend was observed for the CNFs, when comparing with the ACFs and Cu-ACFs, indicating the facile translocation of the CNFs in the plants. A significant decrease was observed in the shoot and root lengths of the plants grown using the ACFs and Cu-ACFs at high concentration (∼100 μg mL−1) doses.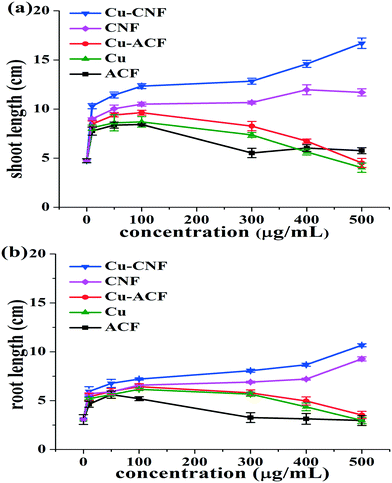 | ||
| Fig. 9 Shoot and root lengths of the Cicer arietinum plants grown using different materials. The data show the mean and standard deviation in the measurements (n = 3), with p-value = 0.0001. | ||
These results corroborated that most of the ACF or Cu-ACFs were accumulated on the seed coat and were unable to translocate. Also, an excessive release of the Cu NPs occurred at high concentrations of the Cu-ACF, which adversely affected the plant growth. The adverse effects of using excessive amounts of Cu metals on the root and shoot lengths in the P. radiatus and T. aestivum plants were earlier reported.28,29
A comparison of the shoot and root lengths of the plants grown using different nanomaterials as plant nutrients discussed in the literature was made when possible. Table S1† summarizes the comparative data.7,8,11,13,16,19,28,29,41–43 These include several Cu-based micronutrients such as Cu-chelated EDTA, Cu salts of fatty acids, Cu oxysulfate, and also, traditional CuSO4. The data clearly show that the growth rate of the Cicer aeritinum plants grown using the Cu-CNFs is greater than or comparable to the growth rate with other nanomaterials used as nutrients for different plants.
4.8. Metal content in plant tissues
Fig. 10 shows the total amounts of Cu accumulated in the plant (root, shoot, and leaf) over different time intervals (5, 10, 15 and 20 days). The data clearly indicate that (1) the metal accumulation expectedly increased with increasing exposure times (days) in all cases, (2) a significantly higher accumulation was observed in the roots than in the shoots and leaves of the Cu- and Cu-ACF-grown plants, unlike in the plants grown using the Cu-CNFs. In the latter case, the higher amounts of Cu in the leaf than in the shoot and root samples of the plant indicate the translocation ability of the CNFs carrying the Cu NPs. Notably, there are studies showing a relatively higher accumulation of the Cu NPs in the plant roots.19,44 The plant grown without any nutrients (Cu or Cu-ACF or Cu-CNF) expectedly did not show Cu, when the corresponding samples were subjected to AAS analysis.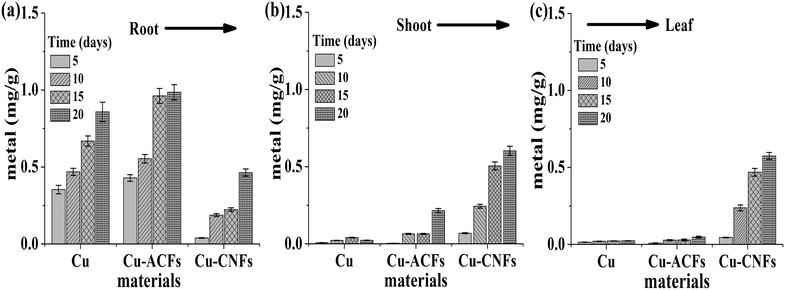 | ||
| Fig. 10 Total amounts of Cu in different tissues of the plant samples: (a) root, (b) shoot, (c) leaf. The data are presented with the mean and standard deviation (n = 3). | ||
The translocation factor (TF) is defined as the shoot to root concentration ratio of the metal. The TF values for Cu and Cu-ACFs were calculated to be approximately 0.02 and 0.008, respectively. The significantly higher TF value (1.76) for the Cu-CNFs re-corroborated the translocation potential of the micronutrient from roots to shoots.
The following salient observations are in order. (1) The plant growth using Cu alone was relatively smaller because such materials could not effectively be translocated to the plant and were accumulated on the roots (Fig. 10). (2) The germination rate using Cu was significant; however, it was smaller than that using Cu-CNFs (Table 1). (3) The root and shoot lengths of the plants grown using Cu alone were significantly smaller than those using Cu-CNFs and CNFs, corroborating the finding that most of the Cu was accumulated at the roots of the plants and could not be effectively translocated (Fig. 10). Therefore, the positive effects of Cu on the plant growth were limited to increasing the germination rate only. (4) This study used H2-reduced Cu in its metallic state (Cu NPs) to grow the CNFs. However, when released in an aqueous medium including plant tissues such materials were ionized to the Cu2+ state. Similarly, the Cu-based nutrients or fertilizers including CuO, Cu-EDTA, CuSO4 and CuO, discussed in the literature, are also ionized to the Cu2+ state (Table S1†).8,28,29,45
4.9. Chlorophyll and protein contents
Fig. 11(a and b) describe the chlorophyll contents of the plants that were grown using the different materials. The chlorophyll contents increased with increasing concentrations (doses) of the Cu-CNFs and CNFs, in comparison to the ACFs, Cu-ACFs, and controls. The increase was relatively higher in the plants grown using the Cu-CNFs. The largest chlorophyll contents (∼4 mg g−1) were observed in the plants grown using the Cu-CNFs at a 500 μg ml−1 dose. The contents in the CNF-grown plants were relatively smaller because of the small amount of Cu NPs in the sonicated samples. The chlorophyll contents were considerably small in the ACF- and Cu-ACF-grown plants.At a relatively higher dose of the materials, the chlorophyll contents sharply decreased in these plants. Similar trends were observed in the water uptake capacity and germination rates of the seeds. The Cu metal acted as the co-factor that enhanced the photosystem-II electron transfer activity and subsequently, the production of biosynthetic pigments. However, an excess amount of Cu induced oxidative stress, inhibiting the production of photosynthetic pigments.4,30,46 The corresponding data for the protein contents are presented in Fig. 11c and similar qualitative behaviour may be observed. The Cu-CNFs were able to provide carbon and Cu as the necessary structural components of proteins that regulated the enzymes required for the growth of plants.30 The CNFs (alone) also enhance the protein and chlorophyll contents, attributed to a relatively higher water uptake capacity of the CNFs, thereby causing the complete hydration of protein, and the biosynthesis of pigments, which subsequently augments the plant growth.30 In other words, the CNFs also act as a plant growth stimulant, although with less efficiency than the Cu-CNFs, as shown in Fig. 9 and 11.
A comparison has also been made, when possible, for the chlorophyll and protein contents in the plants grown using different nanomaterials discussed in the literature. The chlorophyll and protein contents in the Cicer aeritinum plants grown using the Cu-CNFs are found to be larger than or comparable to those achieved using various nanomaterials with different plants, viz., the Zn NPs used for Vigna radiate,7 the SiO2 NPs used for Zea mays,47 and the CNTs used for tomato.12 In the latter study,12 the quantum dots, however, caused an antagonist effect on the tomato leaf.12
4.10. Microscopic analysis
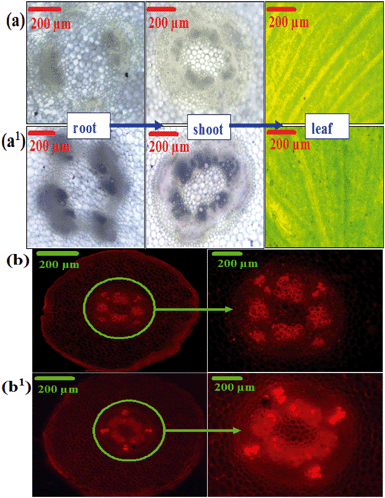
Fig. 12(a–a1) show the bright field microscopy images of root, shoot, and leaf samples of the plants grown using the control and the Cu-CNFs. The blackish regions/spots were clearly observed in the root, shoot, and leaf samples of the Cu-CNF grown plants, confirming the translocation of the Cu-CNFs from the roots to the shoots and leaves of the plant samples.Fig. 12(b–b1) show the fluorescence images of the plant roots, taken using the PI dye as the fluorescent probe to visually trace the nucleic acid contents (the higher the nucleic acid contents are, the more developed the plant is).48 The intensity of the fluorescence in the images of the Cu-CNF-grown plants was considerably higher with respect to the control, attributed to high nucleic acid contents.
5. Conclusions
A novel metal NP-carbon nanocomposite material (Cu-CNF) was synthesized and its dispersion in water was successfully used as an efficient growth stimulant for crops, with the material providing Cu as a nutrient to the plants. The efficient translocation of the Cu-CNFs (∼230 nm length × 95 nm diameter) in the plant was corroborated using different analytical techniques and was associated with the negatively charged surface of the material. The CNFs held the Cu NPs at their tips, thus acting as a carrier of the Cu NPs (micronutrients). The data clearly showed that the Cu-CNFs enhanced the water uptake capacity, germination rate, root and shoot lengths, and chlorophyll and protein contents of the plants. Considering that the method of preparation for the Cu-CNFs is facile and scalable, the micronutrients can be synthesized on a large scale. The use of the nano-sized Cu-CNFs as nanofertilizers on agricultural land may, however, require a suitable substrate or support. For example, a biodegradable polymer, viz., polyvinyl alcohol (PVA), can be used to encapsulate the Cu-CNFs. On dispersion of such a nanocomposite in water, the polymeric shell will dissolve releasing the Cu-CNF micronutrients. This aspect of the micronutrient delivery systems will be specifically addressed in a future study.Acknowledgements
The authors acknowledge the financial support received from the Council of Scientific & Industrial Research (CSIR) (New Delhi, India) in the form of a research grant (No: 9 22(4803)/14). The authors also acknowledge the provision of ACFs from Kynol Inc. (Tokyo, Japan).References
- A. Husen and K. S. Siddiqi, J. Nanobiotechnol., 2014, 12, 16 CrossRef PubMed.
- N. Sarlak, A. Taherifar and F. Salehi, J. Agric. Food Chem., 2014, 62, 4833–4838 CrossRef CAS PubMed.
- L. R. Khot, S. Sankaran, M. J. Maja, R. Ehsani and E. W. Schuster, Crop Prot., 2012, 35, 64–70 CrossRef CAS.
- S. Das, B. P. Wolfson, L. Tetard, J. Tharkur, J. Bazata and S. Santra, Environ. Sci.: Nano, 2015, 2, 203–212 RSC.
- D. Cui, P. Zhang, Y. Ma, X. He, Y. Li, J. Zhang, Y. Zhao and Z. Zhang, Environ. Sci.: Nano, 2014, 1, 459–465 RSC.
- P. Mahajan, S. K. Dhoke and A. S. Khanna, J. Nanotechnol., 2011, 2011, 696535 Search PubMed , 1–7.
- T. Samreen, Humaira, H. U. Shah, S. Ullah and M. Javid, Arabian J. Chem., 2013 DOI:0.1016/j.arabjc.2013.07.005.
- C. O. Dimkpa, J. E. McLean, D. E. Latta, E. Manangon, D. W. Britt, W. P. Johnson, M. I. Boyanov and A. J. Anderson, J. Nanopart. Res., 2012, 14, 1125 CrossRef , 1–15.
- S. Tripathi and S. Sarkar, Appl. Nanosci., 2015, 5, 609–616 CrossRef CAS.
- P. Begum, R. Ikhtiari and B. Fugetsu, Nanomaterials, 2014, 4, 203–221 CrossRef.
- A. Mondal, R. Basu, S. Das and P. Nandy, J. Nanopart. Res., 2011, 13, 4519–4528 CrossRef CAS.
- M. Alimohammadi, Y. Xu, D. Wang, A. S. Biris and M. V. Khodakovskaya, Nanotechnology, 2011, 22, 295101 CrossRef PubMed , 1–8.
- M. Khodakovskaya, E. Dervishi, M. Mahmood, Y. Xu, Z. Li, F. Watanabe and A. S. Biris, ACS Nano, 2009, 3, 3221–3227 CrossRef CAS PubMed.
- M. Saxena, S. Maity and S. Sarkar, RSC Adv., 2014, 4, 39948–39954 RSC.
- E. Patsikka, M. Kairavuo, F. Sersen, E. Aro and E. Tyystjarvi, Plant Physiol., 2002, 129, 1359–1367 CrossRef CAS PubMed.
- M. Bikshapathi, S. Singh, B. Bhaduri, G. N. Mathur, A. Sharma and N. Verma, Colloids Surf., A, 2012, 399, 46–55 CrossRef CAS.
- S. Tripathi, S. K. Sonkar and S. Sarkar, Nanoscale, 2011, 3, 1176–1181 RSC.
- H. Villagarcia, E. Dervishi, K. Silva, A. S. Biris and M. V. Khodakovskaya, Small, 2012, 8, 2328–2334 CrossRef CAS PubMed.
- S. D. Ebbs, S. J. Bradfield, P. Kumar, J. C. White, C. Musante and X. Ma, Environ. Sci.: Nano, 2016, 3, 114–126 RSC.
- J. Lv, S. Zhang, L. Luo, J. Zhang, K. Yang and P. Christie, Environ. Sci.: Nano, 2015, 2, 68–77 RSC.
- X. Ma, J. G. Lee, Y. Deng and A. Kolmakov, Sci. Total Environ., 2010, 408, 3053–3061 CrossRef CAS PubMed.
- P. Miralles, T. L. Church and A. T. Harris, Environ. Sci. Technol., 2012, 46, 9224–9239 CrossRef CAS PubMed.
- C. Peng, D. Duan, C. Xu, Y. Chen, L. Sun, H. Zhang, X. Yuan, L. Zheng, Y. Yang, J. Yang, X. Zhen, Y. Chen and J. Shi, Environ. Pollut., 2015, 197, 99–107 CrossRef CAS PubMed.
- S. Singh, M. Ashfaq, R. K. Singh, H. C. Joshi, A. Srivastava, A. Sharma and N. Verma, New Biotechnol., 2013, 30, 656–665 CrossRef CAS PubMed.
- S. Singh, A. Singh, V. S. S. Bais, B. Prakash and N. Verma, Mater. Sci. Eng., C, 2014, 38, 46–54 CrossRef CAS PubMed.
- M. Ashfaq, S. Khan and N. Verma, Biochem. Eng. J., 2014, 90, 79–89 CrossRef CAS.
- M. Ashfaq, N. Verma and S. Khan, Mater. Sci. Eng., C, 2016, 59, 938–947 CrossRef CAS PubMed.
- U. Habiba, S. Ali, M. Farid, M. B. Shakoor, M. Rizwan, M. Ibrahim, G. H. Abbasi, T. Hayat and B. Ali, Environ. Sci. Pollut. Res., 2015, 22, 1534–1544 CrossRef CAS PubMed.
- A. Szekely, P. Poor, I. Bagi, J. Csiszár, K. Gémes, F. Horváth and I. Tari, Acta Biol., 2011, 55, 159–164 Search PubMed.
- F. Perreault, M. Samadani and D. Dewez, Nanotoxicology, 2014, 8, 374–382 CrossRef CAS PubMed.
- M. Ashfaq, S. Singh, A. Sharma and N. Verma, Ind. Eng. Chem. Res., 2013, 52, 4672–4682 CrossRef CAS.
- Z. Wu, L. Song, S. Feng, Y. Liu, G. He, Y. Yioe, Q. S. Liu and D. Huang, J. Agric. Food Chem., 2012, 60, 8606–8615 CrossRef CAS PubMed.
- C. V. G. Lopez, M. D. C. C. García, A. G. A. Fernández, C. S. Bustos, Y. Chisti and J. M. F. Sevilla, Bioresour. Technol., 2010, 101, 7587–7591 CrossRef PubMed.
- T. Myojo, T. Oyabu, K. Nishi, C. Kadoya, I. Tanaka, M. O. Ogasawara, H. Sakae and T. Shirai, J. Nanopart. Res., 2009, 11, 91–99 CrossRef CAS.
- S. Gupta, A. Yadav and N. Verma, Chem. Eng. J., 2017, 307, 729–738 CrossRef CAS.
- C. M. Long, M. A. Nascarella and P. A. Valberg, Environ. Pollut., 2013, 181, 271–286 CrossRef CAS PubMed.
- G. Chichiricco and A. Poma, Nanomaterials, 2015, 5, 851–873 CrossRef CAS.
- S. Lin, J. Reppert, Q. Hu, J. S. Hudson, M. L. Reid, T. A. Ratnikova, A. M. Rao, H. Luo and P. C. Ke, Small, 2009, 10, 1128–1132 Search PubMed.
- Z. J. Zhu, H. Wang, B. Yan, H. Zheng, Y. Jiang, O. R. Miranda, V. M. Rotello, B. Xing and R. W. Vachet, Environ. Sci. Technol., 2012, 46, 12391–12398 CrossRef CAS PubMed.
- I. Amaya, M. A. Botella, M. Calle, M. I. Medina, A. Heredia, A. R. Bressan, P. M. Hasegawa, M. A. Quesada and V. Valpuesta, FEBS Lett., 1999, 457, 80–84 CrossRef CAS PubMed.
- A. R. Sheldon and N. W. Menzies, Plant Soil, 2005, 278, 341–349 CrossRef CAS.
- S. Sonmez, M. Kaplan, N. K. Sonmez, H. Kaya and I. Uz, Sci. Agric, 2006, 63, 213–218 CrossRef CAS.
- N. X. Cu, Earth Sci., 2008, 24, 113–117 Search PubMed.
- D. Zhang, T. Hua, F. Xiao, C. Chen, R. M. Gersberg, Y. Liu, W. J. Ng and S. K. Tan, Ecol. Eng., 2014, 70, 114–123 CrossRef.
- A. Obrador, D. Gonzalez, J. M. Alvarez and J. Agric, Food Chem., 2013, 61, 4692–4701 CrossRef CAS PubMed.
- A. Marichali, S. Dallali, S. Ouerghemmi, H. Sebei and K. Hosni, Ind. Crops Prod., 2014, 55, 248–257 CrossRef CAS.
- R. Suriyaprabha, G. Karunakaran, R. Yuvakkumar, P. Prabu, V. Rajendran and N. Kannan, J. Nanopart. Res., 2012, 14, 1294 CrossRef , 1–6.
- C. M. Rounds, E. Lubeck, P. K. Hepler and L. J. Winship, Plant Physiol., 2011, 157, 175–187 CrossRef CAS PubMed.
Footnote |
| † Electronic supplementary information (ESI) available. See DOI: 10.1039/c6en00385k |
| This journal is © The Royal Society of Chemistry 2017 |


