Is the rapid initial performance loss of Fe/N/C non precious metal catalysts due to micropore flooding?†
Ja-Yeon
Choi
a,
Lijun
Yang
b,
Takeaki
Kishimoto
c,
Xiaogang
Fu
a,
Siyu
Ye
b,
Zhongwei
Chen
*a and
Dustin
Banham
*b
aDepartment of Chemical Engineering, University of Waterloo, 200 University Ave. W., Waterloo, ON, Canada N2L 3G1. E-mail: zhwchen@uwaterloo.ca
bBallard Power Systems, 9000 Glenlyon Parkway, Burnaby, BC, Canada V5J 5J8. E-mail: dustin.banham@ballard.com
cNisshinbo Holdings Inc., Business Development Department, 1-2-3 Onodai, Midori-ku, 267-0056, Chiba, Japan
First published on 7th December 2016
Abstract
The activity of non-precious metal catalysts (NPMCs) has now reached a stage at which they can be considered as possible alternatives to Pt for some proton exchange membrane fuel cell (PEMFC) applications. However, challenges still remain in achieving acceptable stability (performance during potentiostatic or galvanostatic experiments). The most widely reported hypotheses for the instability of NPMCs include de-metalation, protonation/anion binding, and generation of H2O2. Recently, it has been proposed that the largest contribution to the instability of NPMCs is from flooding of micropores within the catalyst particles leading to significant mass transport limitations. While indirect evidence has been obtained that appears to support this hypothesis, no study has yet been performed to directly target micropore flooding. In this work, a systematic study is performed to investigate micropore flooding in situ before and after stability testing. The results do not support micropore flooding as being a large contributor to instability, at least for the family of NPMCs evaluated in this work. The protocol outlined here can be used by other researchers in the NPMC community to diagnose micropore flooding in their own respective catalysts.
Broader contextDue largely to environmental concerns, many countries are shifting towards electrifying their transportation system through the use of either battery electric vehicles and/or hydrogen fuel cell electric vehicles (HFCVs). Specifically, HFCVs are able to generate clean power while offering great advantages in terms of refueling time and driving range. However, HFCVs contain expensive platinum group metal (PGM) catalysts, particularly at the cathode, to facilitate the notoriously sluggish oxygen reduction reaction (ORR). To reduce cost, non-precious metal catalysts (NPMCs) have been developed, some of which have demonstrated excellent activity. Unfortunately, the most active NPMCs often suffer from poor stability, with the exact mechanism still not fully understood. While never directly measured, many researchers in the NPMC community have recently suggested that this instability could be due to flooding of micropores in the NPMC, leading to enhanced mass transport losses. Here, we propose a simple set of in situ experiments to evaluate this mechanism of performance loss, and conclude (at least for the model NPMC used here) that micropore flooding is not a major contributor to instability. Importantly, this approach is broadly applicable to all NPMCs, and can be used by the research community to help screen for this mechanism of performance loss. |
Introduction
Over the past 5 years, proton exchange membrane fuel cells (PEMFCs) have begun to make real and measured progress towards commercial viability in markets such as backup power and materials handling. While these markets are certainly growing, and represent an excellent commercial opportunity for PEMFCs, ultimately the biggest market will be automotive. In 2015, Toyota and Hyundai both launched small scale PEMFC automotive fleets, with plans from many other automotive OEMs to do the same by 2020. This exciting result is due to the great achievements made over the past decades on reducing cost and improving the durability of PEMFCs.However, despite the unquestionably impressive advances in PEMFC technology, the wide-spread adoption of PEMFCs for automotive applications will require further reductions in cost. In particular, a reduction in the total platinum group metals (PGMs) currently used to catalyze the hydrogen oxidation reaction (HOR) at the anode, and the oxygen reduction reaction (ORR) at the cathode, is required for PEMFCs to become cost competitive in the long term. The largest opportunity for reducing PGM loading is currently at the cathode, which typically contains ∼80% of the total PGM loading in the membrane electrode assembly (MEA) due to the sluggish kinetics of this reaction (105 slower than the HOR1).
One approach to reducing PGM loadings has been to develop non-precious metal catalysts (NPMCs). Of the NPMCs that have been developed, the most promising to date appear to be the M/N/C (M = Fe, Co, Mn) class.2–6 In fact, the significant improvement in activity/performance of these catalysts that have been demonstrated in recent years has advanced these catalysts to a stage at which they can start to be considered as viable alternatives to Pt/C for certain PEMFC applications. While this is very encouraging, it has been recognized that the durability/stability of these catalysts must be further improved before they can truly compete under the harsh operating conditions of PEMFCs.7
Certainly over the past several decades, the primary research focus in the NPMC field has been to improve performance/activity. Thus, it is no surprise that the research community mostly agrees upon the main active sites/design parameters required to achieve high performance as a result of many detailed studies aimed at characterizing and understanding the active sites in these catalysts.8–12 However, the same cannot be said for stability/durability limitations, which have only recently become a higher priority within the research community. To aid in this discussion, our group recently wrote a review paper in which we clearly defined and separated ‘durability’ and ‘stability’ in the context of PEFMC testing.7 Durability was defined as performance loss following voltage cycling, and stability was defined as performance loss following constant voltage/constant current experiments. Certainly the majority of work in the literature has focused on stability, with only limited studies on voltage cycling durability.13–17 This is likely due to the fact that only recently have NPMCs demonstrated sufficient performance to warrant durability/voltage cycling experiments. However, the stability of the catalyst is inevitably tested during routine performance measurements, and thus significantly more data has been obtained for this mode of degradation. Using the extensive data set available in the literature, it quickly becomes clear that there are two distinct time-frames involved in stability loss during MEA testing: (1) a rapid initial loss in the first few hours, and (2) a more gradual but persistent loss with continued testing.7 Due to the rapid nature and magnitude of the initial performance loss, understanding and mitigating this problem is of critical importance.
A survey of the literature7 shows that stability losses of NPMCs have largely be attributed to one of three mechanisms: (1) leaching of the nonprecious metal catalyst,18–22 (2) attack by H2O223,24 (and/or free radicals),25 (3) protonation of the active site,26 or protonation of a N species neighbouring the active site, followed by anion adsorption.27 Evidence for each one of these mechanisms has been reported, and it is possible (likely) that all three mechanisms impact the stability of NPMCs. Recently, a new mechanism concerning micropore flooding has been suggested as an explanation for the rapid initial performance loss.28–31
Extensive work by Dodelet's group over the past decade has provided convincing evidence that the most active catalytic sites are hosted within micropores.32–34 Thus, it is reasonable to conclude that flooding of micropores would negatively impact performance by causing additional mass transport losses to the active sites hosted within these pores. Recent work by Dodelet's group has shown that this mechanism of instability does appear to explain several previously observed results including (1) the stability of NPMC has a negative correlation with the percentage of micropores, (2) the stability observed in rotating disk electrode (RDE) experiments do not match that observed in an MEA, which the authors suggest is because the micropores in RDE tests should already be flooded.28 While some preliminary tests have been performed to help support this hypothesis, further experiments are required to confirm the degree to which micropore flooding can explain the instability of most NPMCs. Fortunately, of all hypotheses for NPMC instability that have been proposed, flooding of micropores should be relatively straight forward to test experimentally.
Before proposing how to experimentally test this hypothesis, it is important to first clarify the difference between standard catalyst layer flooding and the mechanism of seemingly irreversible micropore flooding that has been proposed.29,30 Catalyst layer flooding is a well-known phenomenon that can occur at high relative humidities/current densities and leads to performance loss due to mass transport limitations. In fact, preventing catalyst layer flooding is a strong consideration when designing any MEA, and many mitigation strategies have been developed at all levels (catalyst layer, MEA, stack, and system) of PEMFC products. This mode of flooding is not specific to micropores within the catalyst, but extends to the entire hierarchy of pore sizes within the catalyst layer and GDL. However, a key aspect of this type of cathode catalyst layer (CCL) flooding is that it is reversible, and performance can be recovered by changing the operating conditions. This is contrary to (and a key distinction from) the proposed mechanism of micropore flooding in NPMCs. In the most comprehensive study on this topic yet published,28 it is stated that the micropores in NPMCs initially are hydrophobic, and thus do not contain any water. During operation, carbon oxidation is said to lead to the micropores becoming hydrophilic, at which point they fill with water. Since this surface oxidation cannot be reversed by simply returning to dry conditions, the performance loss is irreversible (unlike conventional catalyst layer flooding). It is also stated that this surface oxidation leads not only to a mass transport loss (from micropore flooding) but also to a kinetic loss due to either oxidation of active sites or a loss in electronic conductivity through the catalyst.28 Several studies have provided indirect support for this mechanism,29,30 or worked to eliminate competing hypotheses.28 However, to date there has been no clear study to directly measure the degree of micropore flooding and its possible effect on the stability of NPMCs.
Thus, the goal of the present study was to devise a series of experiments to directly quantify both the degree of micropore flooding that may occur, and the resulting impact on NPMC stability. This was achieved through comparing air/O2 polarization curves at various relative humidities, as well as evaluating changes in the double layer capacitance (obtained by cyclic voltammetry) before and after stability testing. In devising the experiments in this study, two separate cases of micropore flooding were considered: (1) the micropores are initially not wetted, but fill over time resulting in mass transport limitations, (2) micropores are initially partially wetted, but then completely fill when current is generated in the catalyst layer. There is of course a third case where the micropores could be fully filled at beginning of life (BOL). However, this possibility clearly could not lead to additional transport losses during operation of the fuel cell as no additional flooding of the micropores would be possible. Since the goal of the present work is to develop a method for studying micropore flooding, and to utilize this method to study one particular NPMC, the case of fully filled micropores at BOL has been omitted since no additional transport losses from micropore flooding would be expected.
Experimental
Catalyst synthesis
Fe–N–C–PANI–Phen catalyst was prepared according to the synthesis method reported by Fu et al.,35 which was modified from the synthesis originally reported by Wu et al.5 and Proietti et al.2 Briefly, 500 mg of 1,10-phenanthroline and 30 mg of Fe(Ac)2 and 500 mg of Ketjen Black 600JD carbon powder were dispersed in 100 mL of ethanol, followed by complete evaporation of the solvent at 80 °C while stirring. The residue was ball-milled for 3 hours and the resulting powder was mixed with 1.5 mL of aniline, 5 g of FeCl3 and 2.5 g of ammonium peroxydisulfate in 0.5 M HCl. The solvent was again removed by evaporation after 48 hours of stirring, followed by pyrolysis at 900 °C for an hour in argon, acid-leaching in 0.5 M H2SO4 for 8 hours, and then two steps pyrolysis in argon and in NH3 for 3 hours and 15 minutes, respectively, to get the final product.Physicochemical characterization
Porous structure and surface properties of the catalyst was analyzed by nitrogen adsorption technique using Micromeritics ASAP 2020 surface area and porosimetry system. From the obtained isotherm, Brunauer–Emmett–Teller (BET) surface area was calculated and the microporous surface area was obtained by the t-plot method. Transmission electron microscopy (TEM) was utilized to investigate the morphology of the catalyst, and scanning electron microscopy (SEM) was used to observe the cross-sectional image of the cathode catalyst layer in the MEA. The elemental composition of the catalyst was determined by energy dispersive X-ray (EDX) analysis.MEA preparation
To prepare catalyst ink, 40 mg of Fe–N–C–Phen–PANI catalyst was mixed with deionized water, isopropanol and 5% Nafion dispersion to achieve the ionomer to catalyst (I/C) ratio of 0.54 corresponding to 35 wt% Nafion. The homogenized catalyst ink was deposited onto Nafion 211 membrane in 5 cm2 square area and the catalyst loading was determined by comparing the weight before and after the catalyst layer coating. The catalyst coated membrane along with the gas diffusion layer (SGL 29 BC) on the cathode side and a gas diffusion electrode with 0.2 mg cm−2 Pt loading as anode were pressed together at 130 °C for 5 minutes, using a pressure of 1000 psi.MEA testing protocol
The MEA was evaluated in a single cell using a Scribner 850e fuel cell test station. A series of experiments was performed in a sequence of conditions as illustrated in Fig. 1, namely 60% RH, 100% RH, a stability test, 100% RH, 60% RH, an extreme dry-out protocol and 60% RH, consecutively. For both the 60% and 100% RH test cases, cyclic voltammetry (CV) was conducted before and after taking polarization in air and oxygen, in an order of CV, air polarization, oxygen polarization and CV in the voltage range from 0.1 to 0.8 V at 20 mV s−1 scan rate with N2 purge in cathode and H2 in anode. The cell temperature was kept at 80 °C while anode and cathode gases were humidified at different temperatures to obtain the desired relative humidity values. The stability test was performed at 100% RH in air by keeping the voltage at 0.4 V for 4 hours while monitoring the current. For the dry-out step, the cell temperature was maintained at 80 °C for 5 hours while nitrogen was purged in both anode and cathode at room temperature to remove moisture and residual reactants in the MEA. The flow rates for air, O2, H2 and N2 were all kept at 200 sccm throughout the experiments and the backpressure for both electrodes were maintained at 15 psi g.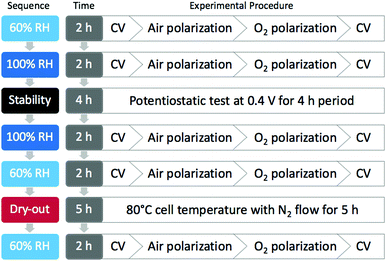 | ||
| Fig. 1 Diagram outlining the experimental sequence for MEA test and the corresponding procedure for each step. | ||
Results and discussion
Defining and characterizing Case 1 and Case 2
Fig. 2 highlights the differences in the water distribution in the catalyst for both Case 1 (micropores initially not wetted) and Case 2 (micropores only partially wetted). In both cases, it is assumed that the ionomer cannot penetrate into the micropores (d < 2 nm). This assumption is based on the fact that Nafion micelles range in size from 1–5 nm,36,37 making it extremely challenging for Nafion to penetrate into pores <2 nm in diameter. This is supported by previous work in the literature which has also indicated that Nafion penetration into pores <2 nm is extremely unlikely to occur.38–40 Aside from this point, there is a key difference between these two cases that must be highlighted.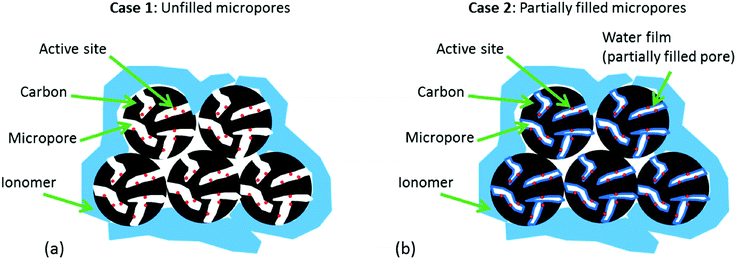 | ||
| Fig. 2 Schematic representation of the two possible cases: (a) Case 1: micropores are unfilled at BOL, (b) Case 2: micropores are partially filled at BOL. | ||
In Case 1, it is assumed that the pores are initially not wetted. This initially appears to be in line with the recent work published on the impact of micropore flooding on apparent stability, where it is stated that at beginning of life (BOL) the catalyst is hydrophobic and thus any water in the catalyst layer is not trapped in the micropores.28 However, when bearing in mind that the majority of the active sites are believed to reside inside micropores,32–34 it quickly becomes apparent that this case is extremely unlikely. Without ionomer inside the micropores, the only possibility for proton transport to the active sites (required for the ORR to occur) would be through water. Without water already present in the pores, these sites would be inactive and the NPMC would show very poor BOL activity (low BOL activity is not generally observed). Additionally, no water would be formed in these pores during operation of the fuel cell as there would be no opportunity for the ORR to occur. Furthermore, it is suggested that during operation of the fuel cell, the carbon becomes oxidized resulting in carbon functionalities that render the carbon surface hydrophilic and thus allow water to become trapped in the micropores. Since the electrochemical oxidation of carbon (eqn (1)) also requires the presence of water, any ‘water-free’ micropores would suffer no oxidation and thus should remain hydrophobic during operation of the fuel cell.
| C + 2H2O → CO2 + 4H+ + 4e− | (1) |
Thus, it quickly becomes apparent that not only is Case 1 quite unlikely, but even if it were to occur, no additional mass transport losses from micropore flooding would be expected as these pores would remain inactive.
Fortunately, cyclic voltammetry provides a simple and reliable approach for evaluating whether or not Case 1 does occur. Specifically, the double layer capacitance of the electrode is directly proportional to the electrochemically accessible surface area of the conductive catalyst particles41 (eqn (2)).
 | (2) |
Where C is the capacitance, ε is the dielectric constant of the medium, ε0 is the permittivity of free space, A is the electrochemically accessible surface area and d is the thickness of the double layer. If we assume that the micropores are initially not wetted, and then gradually wet during operation of the fuel cell, the double layer charging current would be expected to increase as the electrochemical surface area gradually increases. In fact, since these catalysts are highly microporous, the growth in double layer charging current would be expected to be quite large as ‘flooding’ of these pores occurred. This should be clearly observable by comparing in situ cathode CVs obtained throughout the stability test.
The key difference with Case 2 is that a thin water film is already present in the pores. This significantly changes the argument, as now it is conceivable that additional water could be generated in these pores during operation of the fuel cell leading to flooding. Also, the surface of the pores could now be oxidized through eqn (1) leading to an increase in hydrophilicity which in turn would further enhance micropore flooding. However, if a thin water film does indeed cover the surface of the micropores, this would render the walls hydrophilic, and due to the high energetics of micropore adsorption,42 the pores would be immediately filled at even moderate relative humidities. Nonetheless, overlooking this admittedly concerning problem with the hypothesis, Case 2 at least provides the possibility for flooding to occur in the micropores, and thus could lead to additional mass transport losses.
Characterizing Case 2 purely through observing changes in the double layer charging current is not as simple as in Case 1. If the micropores are partially/fully wetted by a thin water film at the beginning of the test, then little to no change in double layer charging current would be expected during operation of the fuel cell as little/no change in the electrochemical surface area would be observed. However, it should be emphasized again that if no change in double layer charging current is observed, this would suggest that the pores are in fact fully wetted by a thin water film at BOL, and it would thus be highly surprising if water did not immediately condense into these pores due to the highly favourable energetics of micropore filling.42 If some unknown mechanism did somehow prevent this from occurring, another diagnostic tool would be required to evaluate whether micropore flooding did indeed occur over the duration of the stability test. Fortunately, it is already known that comparing polarization curves obtained under air and O2 can greatly aid in diagnosing mass transport limitations. Specifically, mass transport limitations will occur at much earlier current densities under air than under O2 due to the ∼5× lower oxygen concentration in air vs. pure O2. Thus, if the active sites remain stable, but become less accessible due to flooding of the micropores, then polarization curves under air will show significantly more ‘loss’ than polarization curves under O2. However, if the active sites are actually degrading with time, then a kinetic loss (parallel shift to lower voltages at every current density) would be observed when comparing subsequent O2 polarization curves obtained at different times during the stability test.
Overall, by utilizing in situ CVs and air/O2 polarization curves, it should be straightforward to (1) differentiate between Case 1 and Case 2, and (2) determine whether either of these cases is actually responsible for the loss in performance that is observed during the stability testing. The protocol described in the Experimental section was specifically designed to answer these questions, and could be used as a diagnostic protocol by other researchers in this field to help address the impact of micropore flooding in their specific catalyst.
Physical characterization of NPMCs
Nitrogen sorption was used to evaluate the surface area and pore characteristics of the Fe–N–C catalyst used in this study as outlined in Table 1. The catalyst exhibits a BET surface area of 1244 m2 g−1 and a very high micropore area of 1149 m2 g−1 obtained by t-plot analysis, showing that over 92% of the total surface area of the catalyst is due to micropores. The shape of the isotherm (Fig. S1a, ESI†) and the pore size distribution (Fig. S1c, ESI†) also indicate that the catalyst is highly microporous. The large amount of micropores can be attributed to the presence of micropores within the carbon structures as well as inter-particle porosity. Since our aim is to examine the correlation between the micropore flooding and the resulting impact on the stability, the high microporosity of this Fe–N–C catalyst makes it an excellent candidate to be used in this study.| Fe–N–C–Phen–PANI | |
|---|---|
| BET surface area | 1244 m2 g−1 |
| t-Plot micropore area | 1149 m2 g−1 |
| t-Plot external surface area | 94 m2 g−1 |
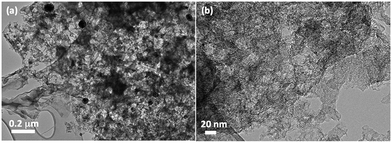
The TEM images (Fig. 3) illustrate the porous nature of the catalyst, showing an agglomerate of small carbon particles and porous graphite/graphene structures. Larger (10–20 nm) interparticle pores can also be observed (Fig. 3b), which could be beneficial for mass transport at high current densities when operating in an MEA.13
The elemental composition of the catalyst obtained by EDX is outlined in Table S1 (ESI†), and the catalyst loading in the MEA used in this study was measured to be 3.8 mg cm−2. The cross-sectional image of the MEA after testing along with the cathode catalyst layer thickness measurement is shown in Fig. S2 (ESI†). The thickness of the layer is around 95 μm, which is in agreement with reported thicknesses for NPMC CCLs having a loading of ∼0.4 mg cm−3.2,43
In situ evaluation
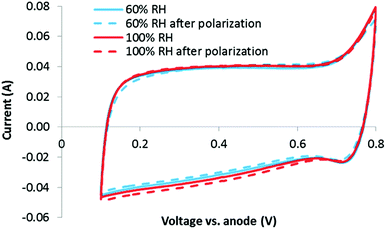
Relative humidities of 60 and 100% were evaluated to probe the impact of RH on micropore flooding. In each case, a CV was obtained before and after performing air and O2 polarization curves. If micropore flooding occurred during the stability test, an increase in capacitance would be expected, as explained with eqn (2). However, as shown in Fig. 4, there is no clear change in the double layer charging current between the CVs obtained at 60 or 100% RH, before or after the polarization curves. This indicates that the micropores are already partially filled (Case 2) or fully filled, and that this process occurs immediately. Another possibility is that any micropores which are not initially filled do not flood during the polarization curves.While the overlapping CVs in Fig. 4 clearly indicate that no additional wetting of the carbon surface occurs due to water being generated during polarization, it is not initially obvious what fraction of the total carbon surface is wetted (i.e. are the micropores fully wetted at this early stage of the analysis). Fortunately, an estimate can be made by examining the area specific capacitance (F m−2) of the carbon catalyst obtained by the CVs.
 | (3) |
Clearly the area specific capacitance of a carbon material will be greatly impacted by the density of electroactive pseudocapacitive groups on its surface. However, it is known that for a wide range of carbons, this value falls between 0.05 F m−2 (highly graphitic carbons) to 0.15 F m−2 (highly functionalized carbons).44 As the carbon catalysts used in this work are relatively amorphous, and do not appear to have a high density of pseudocapacitive groups (Fig. 4), it would be reasonable to expect a specific capacitance value of ∼0.1 F m−2. This is in fact what is observed, with a specific capacitance of ∼0.09 F m−2 calculated from the CVs in Fig. 4. The only way to achieve this is if the majority of the surface area is fully accessed/wetted at BOL, and contributing to the double layer. This is an important finding when keeping in mind that the catalysts are ∼90% microporous (Table 1), and clearly indicates that even at BOL, the micropores are easily wetted. Thus, even at this early stage of the analysis, it seems likely that Case 1 is improbable, and if any micropore flooding is occurring, it must be starting with Case 2. However, due to the uncertainties in this estimate, no firm conclusions can be made at this stage of the analysis.
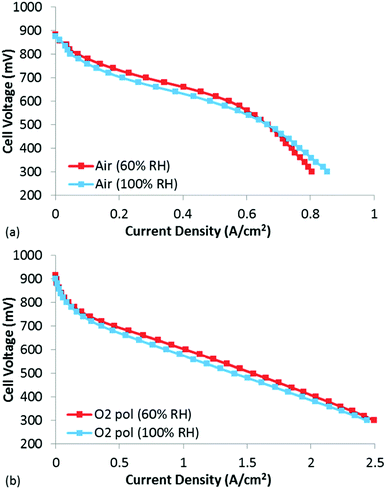
To evaluate whether traditional catalyst layer flooding was occurring in these CCLs at BOL, polarization curves were obtained under air and O2 at both 60 and 100% RH (Fig. 5). The BOL high current density performance at 100% RH was not found to be significantly lower than at 60% RH, indicating that catalyst layer flooding was not occurring in this MEA. In fact, under air, the performance at 60% RH is slightly higher than that under 100% RH until a current density of ∼0.6 A cm−2, at which point the performance at 60% RH becomes mass transport limited. Clearly this mass transport limitation is not due to catalyst layer flooding, which would actually be worse at 100% RH vs. 60% RH. Thus, it is likely that the mass transport limitations observed at 60% RH are due to drying of the CCL, leading to increased resistance to proton transport within the CCL. Unlike proton transport resistance in the membrane which are manifested as an Ohmic loss, proton transport limitations in the CCL lead to distributed potentials which are distinctly non-linear performance losses. When examining the O2 polarization curve at 60% RH (Fig. 5(b)), the mass transport losses that were observed under air at 60% RH are absent, likely due to the significantly higher [O2], which pushes the reaction boundary much closer to the membrane thus minimizing any proton transport losses in the CCL.45 In this case with O2, it is clear that the 60% RH data is slightly higher than the 100% RH data, and that this shift is mostly kinetic. As this small performance difference is clearly a kinetic loss, it is hypothesized that some of the active sites were degraded during the 60% RH testing, leading to lower performance when tested under 100% RH. In fact, it is well known that NPMC instability is most rapid during the first few hours of testing,3,46,47 so it would not be surprising if some activity was already lost following the several hours required for the diagnostics at 60% RH.
To evaluate stability, a potentiostatic experiment was performed by keeping the MEA at 0.4 V while monitoring the current that was generated (Fig. 6). As is clearly observed, the performance is significantly decreased over a 4 h period. This is not an uncommon finding, with many researchers showing significant performance loss within the first few hours of operation,3,46,47 which is often attributed to any of the previously mentioned mechanisms. It should be noted that, despite the similarities in synthesis approach, this catalyst demonstrated far more rapid performance loss than that of Wu et al.5 Possible reasons for this difference are highlighted in a separate publication.35 However, the primary question being addressed in the present work is not about understanding exactly what mechanism is causing this loss, but rather, whether or not it is in fact due to micropore flooding. Fortunately, by previously obtaining the BOL CVs, air polarization curves, and O2 polarization curves, this question should be relatively easy to answer.
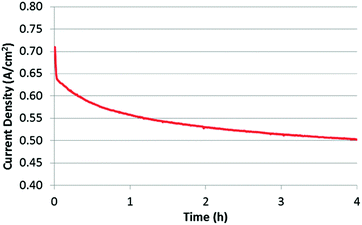 | ||
| Fig. 6 Stability test for 4 hours under a constant voltage of 0.4 V at 100% RH. Cell temperature: 80 °C; H2/air flow rate: 200 sccm. | ||
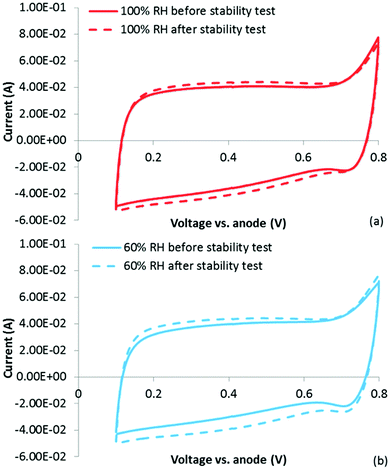
Immediately following the stability test, a CV was obtained at 100% RH. In Fig. 7(a), this CV is overlaid on top of the CV obtained at 100% RH prior to the stability test. It is clear that following the stability test, a small (∼8%) increase in the double layer charging current is observed (a similar increase was observed at 60% RH). While no distinct pseudocapacitive peaks are observed, it is still possible that some surface oxidation occurred leading to either/or: (1) pseudocapacitive groups forming over a range of potentials or (2) an increase in surface area due to loss of carbon. Alternatively (and possibly due to surface oxidation leading to increased hydrophilicity), it is possible that this increase is due to increased catalyst layer wetting. If this is true, then the question is whether this is simply CCL wetting in the traditional sense (i.e. wetting of a higher percentage of the total catalyst layer and not just micropores), or whether this is evidence for the irreversible ‘micropore flooding’ mechanism purportedly responsible for the low stability of NPMCs.
Based on the specific capacitance calculation performed previously, the majority of the micropores were already wetted at BOL. However, as discussed previously, the double layer charge can only be used to examine surface wetting, and it could still be possible that the partially filled micropores (Case 2, Section 3.1) have fully filled with water, and that this has led to the observed decrease in performance.
To examine this possibility, polarization curves under both air and O2 were obtained (Fig. 8). The goal of this experiment was to help understand whether actual kinetic losses (loss and/or deactivation of active sites) had occurred or if the losses could be explained due to reduced mass transport in the now flooded micropores. If the active sites were actually destroyed/de-activated during the stability test, a purely kinetic loss would be expected. However, if the loss in performance was due to micropore flooding, no change in the low current density performance would be expected, but significantly higher mass transport losses would be present even for the O2 polarization curve, as O2 would be forced to transport through the liquid water to the active sites as opposed to through the open micropores.
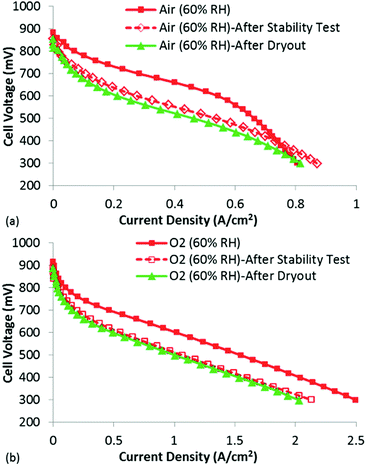 | ||
| Fig. 8 Polarization curves (after performing the stability test) at 60% RH under (a) air and (b) O2. The polarization curves following the extreme dry-out are shown in green triangles. | ||
Looking first at the results under air at 60% RH, it is clear that significant decrease in performance has occurred following only 4 h at 0.4 V. The losses appear largely kinetic, but it is also clear that the polarization curve obtained after the stability test does not suffer as severely from mass transport losses. In fact, at current densities >0.8 A cm−2, the polarization curve obtained after the stability test actually shows higher performance than that obtained before the stability test. The reason for this is not entirely certain, but could be due to conditioning of the membrane/ionomer during the stability test. Importantly, this result does not show higher mass transport losses following the stability test, as would be expected if micropore flooding was indeed responsible for the low performance. This is further confirmed by analyzing the O2 polarization curves, which show a kinetic loss following the stability test. This is a very different result than what would be expected if micropore flooding were the primary factor in reducing performance, and provides strong evidence that active site loss/de-activation has occurred. In fact, based on the change in the performance under O2, the fraction of active site loss can be estimated using eqn (4):
 | (4) |
In eqn (4), Δη is the difference in voltage at a given current density in the performance plots shown in Fig. 8(b), R is the universal gas constant, T is the temperature in Kelvin, α is the charge transfer coefficient and F is Faraday's constant. This equation relates the difference in performance to the total activity of the catalyst layer (assuming Butler Volmer kinetics). The results in Fig. 8(b) show an approximately 60 mV loss in performance, which would suggest a 10× reduction in activity (loss of, or de-activation of, 90% of the active sites) of the catalyst layer following the stability test. This is a significant loss, and does not appear to be simply a mass transport limitation due to flooded micropores.
While the data shown in the manuscript provides convincing evidence that the instability of this NPMC cannot be attributed to micropore flooding, and additional experiment was performed to rule out conventional catalyst layer flooding. Specifically, an extreme dry-out protocol was performed following the stability testing, which was designed to remove any water filling the macropores of the catalyst layer. This consisted of holding the cell temperature at 80 °C while purging nitrogen gas in anode and cathode for 5 hour period. Despite this fairly aggressive dry-out, no performance gain was achieved. In fact, slightly lower performance was observed following the dry-out, which clearly appears to be a kinetic loss (Fig. 8). It is believed this is due to even further degradation of the active sites during the 5 h over which the dry-out occurred. While this does not itself prove that micropore flooding did not occur (for reasons clearly outlined in recent work28), when combined with the complete data set from this study, it does cast doubt on the micropore flooding mechanism for this particular catalyst.
Finally, it should be noted that this test protocol was designed specifically to look at the role of micropore flooding (assumed to occur steadily within the first few hours of operation). Longer term testing would almost certainly reveal additional performance loss mechanisms (e.g. oxidation from H2O2), but as this was not the focus of the present work, the stability test was relatively short (4 h).
Most likely cause(s) of rapid degradation
The goal of this work was to determine whether or not micropore flooding28–31 could be responsible for the observed instability of NPMCs (particularly within the first several hours), and in that respect, it was successful with the ‘micropore flooding’ mechanism found to be very unlikely. However, this only leads to a more urgent question: if not micropore flooding, then what mechanism is responsible for the significant loss in performance that was observed? While answering this question lies beyond the scope of this work, these findings would nevertheless feel incomplete without some commentary on likely mechanisms for instability.As mentioned in the introduction, several of the co-authors have already written a comprehensive review on the stability and durability of NPMCs.7 In that work, three main mechanisms for NPMC instability were identified. Since this time, the ‘micropore flooding’ mechanism has emerged, giving us four possible degradation mechanisms: (1) demetalation of the NPMC,18–22 (2) attack by H2O223,24 (and/or free radicals),25 (3) protonation of the active site,26 or protonation of a N species neighbouring the active site, followed by anion adsorption,27 (4) micropore flooding.28–31 However, it should be stated that, based on the findings from the present work, it appears likely that the first three mechanisms remain the most likely, with ‘micropore flooding’ having a minor contribution, if at all, to NPMC stability.
In the present work, the observed kinetic losses were attributed to ‘loss’ and/or ‘deactivation’ of active sites. Clearly these terms will have different meanings, which must now be clarified. Loss of an active site would most likely come about from irreversible oxidation of the active site. This is the type of degradation predicted by Mechanisms 1 and 2. Deactivation is associated with a change in the chemical nature of (including change in oxidation state of pseudocapacitive groups), or inaccessibility of reactants to, the active site. In either case, it is more likely to be reversible. With this in mind, Mechanisms 1 and 2 would lead to ‘loss’, whereas Mechanism 3 and 4 would lead to ‘deactivation’.
While it is very difficult to rule out Mechanism 3, it is the authors' opinion that active site loss as opposed to deactivation, is the most likely reason for NPMC instability. This is based on our own observations that these performance losses are irreversible. This leaves either demetalation (Mechanism 1) or attack by H2O2/radicals (Mechanism 2) as the most likely causes. Recently, operando spectroscopy has been used to directly characterize demetalation during operation of NPMC-based MEAs.20,22 Through this important work, it was determined that while demetalation will occur, it is not responsible for the rapid performance loss that is typically observed with the first several hours. This is in agreement with previous work by Zelenay et al. who also reached the conclusion that demetalation will occur, but that it is not strongly correlated with performance loss.48
This leaves oxidation of the carbon/active sites as the most likely cause. At potentials relevant for most stability tests (<0.6 V),14,25,48–50 it is unlikely that carbon corrosion is occurring electrochemically at a significant rate. Thus, attack of the carbon/active sites by H2O2/radicals currently is our leading hypothesis for the rapid performance decay observed in most NPMCs. In fact, direct evidence for this mechanism has previously been demonstrated.24,50
Unfortunately, this mechanism is far more difficult to characterize through conventional electrochemical methods than the micropore flooding mechanism studied in the present manuscript. While growth the carbon double layer charge under N2 would occur with oxidation of the carbon surface, it is not clear how oxidation of active sites would impact the CV response, nor is it clear what the relationship would be between growth of the carbon double layer and observed performance loss. It is our opinion that characterizing, understanding, and overcoming this problem should be a large focus in the coming years within the NPMC community.
Conclusions
A systematic study was designed and performed to investigate the emerging hypothesis that the largest contribution to the instability of NPMCs is from the flooding of micropores. This was achieved by comparing the degree of micropore flooding in situ with the observed instability of a NPMC-based MEA. As a means to evaluate the degree of micropore flooding, the changes in the double layer capacitance following cyclic voltammetry were monitored throughout the test protocol and compared to the changes in air/O2 polarization curves at various conditions. The CVs and specific capacitance calculation clearly show that the majority of the micropores are wetted at BOL, and although some degree of additional catalyst layer wetting occurs during the stability test, such a small increase cannot explain the significant performance loss that is observed. In addition, the loss in performance appears primarily kinetic and the mass transport loss due to flooded micropores appears relatively insignificant. Overall, the findings in the present study do not support micropore flooding as being the major contributor to the stability loss, at least for the family of NPMCs evaluated in this work. Importantly, the protocol outlined here can be utilized by other researchers in the NPMC community as a simple but highly effective method to diagnose micropore flooding in NPMCs and its impact on the stability of their catalysts. This should help guide researchers as they strive to develop more stable NPMCs which will be required for commercialization.Acknowledgements
This work was supported by the University of Waterloo and the Waterloo Institute for Nanotechnology. This research was conducted as part of the Catalysis Research for Polymer Electrolyte Fuel Cells (CaRPE-FC) network administered from Simon Fraser University and supported by Automotive Partnership Canada (APC) Grant no. APCPJ 417858-11 through the Natural Sciences and Engineering Research Council of Canada (NSERC).References
- F. Barbir, PEM Fuel Cells: Theory and Practice, Elsevier Academic Press, 2005 Search PubMed.
- E. Proietti, F. Jaouen, M. Lefèvre, N. Larouche, J. Tian, J. Herranz and J.-P. Dodelet, Nat. Commun., 2011, 2, 416 CrossRef PubMed.
- M. Lefèvre, E. Proietti, F. Jaouen and J.-P. Dodelet, Science, 2009, 324, 71–74 CrossRef PubMed.
- A. Serov, K. Artyushkova, E. Niangar, C. Wang, N. Dale, F. Jaouen, M.-T. Sougrati, Q. Jia, S. Mukerjee and P. Atanassov, Nano Energy, 2015, 16, 293–300 CrossRef CAS.
- G. Wu, K. L. More, C. M. Johnston and P. Zelenay, Science, 2011, 332, 443–447 CrossRef CAS PubMed.
- P. Zamani, D. C. Higgins, F. M. Hassan, X. Fu, J.-Y. Choi, M. A. Hoque, G. Jiang and Z. Chen, Nano Energy, 2016, 26, 267–275 CrossRef CAS.
- D. Banham, S. Ye, K. Pei, J.-I. Ozaki, T. Kishimoto and Y. Imashiro, J. Power Sources, 2015, 285, 334–348 CrossRef CAS.
- L. Birry, J. H. Zagal and J.-P. Dodelet, Electrochem. Commun., 2010, 12, 628–631 CrossRef CAS.
- M. Lefèvre, J. P. Dodelet and P. Bertrand, J. Phys. Chem. B, 2002, 106, 8705–8713 CrossRef.
- J. Herranz, F. Jaouen and J.-P. Dodelet, ECS Trans., 2009, 25, 117–128 CAS.
- N. R. Sahraie, U. I. Kramm, J. Steinberg, Y. Zhang, A. Thomas, T. Reier, J. P. Paraknowitsch and P. Strasser, Nat. Commun., 2015, 6, 8618 CrossRef CAS PubMed.
- E. F. Holby and C. D. Taylor, Sci. Rep., 2015, 5, 9286 CrossRef PubMed.
- A. Serov, M. H. Robson, K. Artyushkova and P. Atanassov, Appl. Catal., B, 2012, 127, 300–306 CrossRef CAS.
- R. Bashyam and P. Zelenay, Nature, 2006, 443, 63–66 CrossRef CAS PubMed.
- X. Li, G. Liu and B. N. Popov, J. Power Sources, 2010, 195, 6373–6378 CrossRef CAS.
- J.-Y. Choi, D. Higgins and Z. Chen, J. Electrochem. Soc., 2011, 159, B86–B89 Search PubMed.
- H. Peng, Z. Mo, S. Liao, H. Liang, L. Yang, F. Luo, H. Song, Y. Zhong and B. Zhang, Sci. Rep., 2013, 3, 1765 Search PubMed.
- B. Wang, J. Power Sources, 2005, 152, 1–15 CrossRef CAS.
- D. Deng, L. Yu, X. Chen, G. Wang, L. Jin, X. Pan, J. Deng, G. Sun and X. Bao, Angew. Chem., Int. Ed., 2013, 52, 371–375 CrossRef CAS PubMed.
- C. H. Choi, C. Baldizzone, G. Polymeros, E. Pizzutilo, O. Kasian, A. K. Schuppert, N. Ranjbar Sahraie, M.-T. Sougrati, K. J. J. Mayrhofer and F. Jaouen, ACS Catal., 2016, 6, 3136–3146 CrossRef CAS.
- J. A. Varnell, E. C. Tse, C. E. Schulz, T. T. Fister, R. T. Haasch, J. Timoshenko, A. I. Frenkel and A. A. Gewirth, Nat. Commun., 2016, 7, 12582 CrossRef CAS PubMed.
- C. H. Choi, C. Baldizzone, J.-P. Grote, A. K. Schuppert, F. Jaouen and K. J. J. Mayrhofer, Angew. Chem., Int. Ed., 2015, 54, 12753–12757 CrossRef CAS PubMed.
- H. Schulenburg, S. Stankov, V. Schünemann, J. Radnik, I. Dorbandt, S. Fiechter, P. Bogdanoff and H. Tributsch, J. Phys. Chem. B, 2003, 107, 9034–9041 CrossRef CAS.
- V. Goellner, V. Armel, A. Zitolo, E. Fonda and F. Jaouen, J. Electrochem. Soc., 2015, 162, H403–H414 CrossRef CAS.
- M. Lefèvre and J.-P. Dodelet, Electrochim. Acta, 2003, 48, 2749–2760 CrossRef.
- G. Liu, X. Li and B. Popov, ECS Trans., 2009, 25, 1251–1259 CAS.
- J. Herranz, F. Jaouen, M. Lefèvre, U. I. Kramm, E. Proietti, J.-P. Dodelet, P. Bogdanoff, S. Fiechter, I. Abs-Wurmbach, P. Bertrand, T. M. Arruda and S. Mukerjee, J. Phys. Chem. C, 2011, 115, 16087–16097 CAS.
- G. Zhang, R. Chenitz, M. Lefèvre, S. Sun and J.-P. Dodelet, Nano Energy, 2016, 29, 111–125 CrossRef CAS.
- M. Shao, Q. Chang, J. P. Dodelet and R. Chenitz, Chem. Rev., 2016, 116, 3594–3657 CrossRef CAS PubMed.
- L. Yang, N. Larouche, R. Chenitz, G. Zhang, M. Lefèvre and J.-P. Dodelet, Electrochim. Acta, 2015, 159, 184–197 CrossRef CAS.
- Y.-C. Wang, Y.-J. Lai, L. Song, Z.-Y. Zhou, J.-G. Liu, Q. Wang, X.-D. Yang, C. Chen, W. Shi, Y.-P. Zheng, M. Rauf and S.-G. Sun, Angew. Chem., Int. Ed., 2015, 54, 9907–9910 CrossRef CAS PubMed.
- F. Jaouen, M. Lefèvre, J.-P. Dodelet and M. Cai, J. Phys. Chem. B, 2006, 110, 5553–5558 CrossRef CAS PubMed.
- F. Jaouen and J.-P. Dodelet, Electrochim. Acta, 2007, 52, 5975–5984 CrossRef CAS.
- F. Jaouen, J. Herranz, M. Lefèvre, J.-P. Dodelet, U. I. Kramm, I. Herrmann, P. Bogdanoff, J. Maruyama, T. Nagaoka, A. Garsuch, J. R. Dahn, T. Olson, S. Pylypenko, P. Atanassov and E. A. Ustinov, ACS Appl. Mater. Interfaces, 2009, 1, 1623–1639 CAS.
- X. Fu, P. Zamani, J. Y. Choi, F. Hassan, G. Jiang, D. C. Higgins, Y. Zhang and Z. Chen, Adv. Mater., 2016 DOI:10.1002/adma.201604456.
- D. B. Spry, A. Goun, K. Glusac, D. E. Moilanen and M. D. Fayer, J. Am. Chem. Soc., 2007, 129, 8122–8130 CrossRef CAS PubMed.
- T. D. Gierke, G. E. Munn and F. C. Wilson, J. Polym. Sci., Polym. Phys. Ed., 1981, 19, 1687–1704 CrossRef CAS.
- E. Antolini, Appl. Catal., B, 2009, 88, 1–24 CrossRef CAS.
- M. Uchida, Y. Fukuoka, Y. Sugawara, N. Eda and A. Ohta, J. Electrochem. Soc., 1996, 143, 2245–2252 CrossRef CAS.
- K. Shinozaki, H. Yamada and Y. Morimoto, J. Electrochem. Soc., 2011, 158, B467–B475 CrossRef CAS.
- J. Bockris, A. Reddy and M. Gamboa-Aldeco, Modern Electrochemistry 2A Fundamentals of Electrodics, Kluwer Academic/Plenum Publishers, New York, 2nd edn, 2000 Search PubMed.
- S. Lowell, J. E. Shields, M. A. Thomas and M. Thommes, Characterization of Porous Solids and Powders: Surface Area, Pore Size and Density, Springer, Dordrecht, Netherlands, 1st edn, 2006 Search PubMed.
- S. Komini Babu, H. T. Chung, G. Wu, P. Zelenay and S. Litster, ECS Trans., 2014, 64, 281–292 CrossRef CAS.
- D. Banham, F. Feng, J. Burt, E. Alsrayheen and V. Birss, Carbon, 2010, 48, 1056–1063 CrossRef CAS.
- A. Young, J. Stumper, S. Knights and E. Gyenge, J. Electrochem. Soc., 2010, 157, B425–B436 CrossRef CAS.
- N. Larouche, R. Chenitz, M. Lefèvre, E. Proietti and J.-P. Dodelet, Electrochim. Acta, 2014, 115, 170–182 CrossRef CAS.
- J. Maruyama and I. Abe, Chem. Mater., 2005, 17, 4660–4667 CrossRef CAS.
- M. Ferrandon, X. Wang, A. J. Kropf, D. J. Myers, G. Wu, C. M. Johnston and P. Zelenay, Electrochim. Acta, 2013, 110, 282–291 CrossRef CAS.
- G. Faubert, G. Lalande, R. Côté, D. Guay, J. P. Dodelet, L. T. Weng, P. Bertrand and G. Dénès, Electrochim. Acta, 1996, 41, 1689–1701 CrossRef CAS.
- G. Wu, K. Artyushkova, M. Ferrandon, A. J. Kropf, D. Myers and P. Zelenay, ECS Trans., 2009, 25, 1299–1311 CAS.
Footnote |
| † Electronic supplementary information (ESI) available. See DOI: 10.1039/c6ee03005j |
| This journal is © The Royal Society of Chemistry 2017 |

