Quantifying the thickness of the electrical double layer neutralizing a planar electrode: the capacitive compactness†
Received
10th August 2017
, Accepted 21st November 2017
First published on 5th December 2017
Abstract
The spatial extension of the ionic cloud neutralizing a charged colloid or an electrode is usually characterized by the Debye length associated with the supporting charged fluid in the bulk. This spatial length arises naturally in the linear Poisson–Boltzmann theory of point charges, which is the cornerstone of the widely used Derjaguin–Landau–Verwey–Overbeek formalism describing the colloidal stability of electrified macroparticles. By definition, the Debye length is independent of important physical features of charged solutions such as the colloidal charge, electrostatic ion correlations, ionic excluded volume effects, or specific short-range interactions, just to mention a few. In order to include consistently these features to describe more accurately the thickness of the electrical double layer of an inhomogeneous charged fluid in planar geometry, we propose here the use of the capacitive compactness concept as a generalization of the compactness of the spherical electrical double layer around a small macroion (González-Tovar et al., J. Chem. Phys. 2004, 120, 9782). To exemplify the usefulness of the capacitive compactness to characterize strongly coupled charged fluids in external electric fields, we use integral equations theory and Monte Carlo simulations to analyze the electrical properties of a model molten salt near a planar electrode. In particular, we study the electrode's charge neutralization, and the maximum inversion of the net charge per unit area of the electrode-molten salt system as a function of the ionic concentration, and the electrode's charge. The behaviour of the associated capacitive compactness is interpreted in terms of the charge neutralization capacity of the highly correlated charged fluid, which evidences a shrinking/expansion of the electrical double layer at a microscopic level. The capacitive compactness and its first two derivatives are expressed in terms of experimentally measurable macroscopic properties such as the differential and integral capacity, the electrode's surface charge density, and the mean electrostatic potential at the electrode's surface.
1 Introduction
The surface of an electrode or a colloidal particle can become charged when it is immersed in a liquid solvent. The ionic cloud neutralizing this electrified interface is the so-called electrical double layer. The spatial distribution of the electrical double layer determines the electrostatic and electrokinetic properties of charged particles or surfaces dissolved in coulombic fluids. These properties are crucial in diverse technological applications involving, e.g., the colloidal stability of charged solutions,1–12 the storage capacity of electrical energy in batteries or supercapacitors,13,14 or the recovery and transfer of inorganic macroions and biomolecules in the presence of oil/water interfaces.15
According to the linearized Poisson–Boltzmann theory of point ions, the spatial extension of the electrical double layer neutralizing an infinite planar electrode can be characterized by a single parameter, namely, the Debye length of the surrounding charged fluid in the bulk.16,17 In spite of the wide use of the Debye length as a practical measure to characterize the thickness of the electrical double layer (due probably to its simplicity), this iconic length does not take into account important characteristics of ionic fluids such as electrostatic ion correlations, ionic excluded volume, image charges, short-range van der Waals specific interactions, and colloidal charge.18–48 Thus, in order to incorporate several of these features, some authors have proposed mean field approaches including the influence of the colloidal charge and the excluded volume effects of ions.49 In this kind of study, the extension of the electrical double layer associated with a binary electrolyte in the presence of a planar electrode is characterized by an “effective thickness” x1/2. The thickness x1/2 is defined therein as the distance from the electrode's surface at which the concentration of excess counterions drops to half of its value regarding its concentration at the electrode's surface. However, even if the excluded volume of ions and solvent molecules is taken into account via a three-dimensional cubic lattice using statistical mechanics methods, electrostatic ion correlations are missing in this approach. Another possibility to characterize the spatial extension of the electrical double layer could be via the effective charge of a colloid. If the colloidal charge and the diffuse charge of ions are integrated up to a distance at which this quantity is equal to the effective charge of the colloid, this distance could be used, in principle, as a measure of the thickness of the electrical double layer. However, it is worth mentioning two important limitations if this approach is used. In the literature, there is not a unique manner to define or calculate the effective charge of a colloid. For instance, the effective charge of a spherical macroion immersed in an electrolyte could be calculated as the net charge (of the macroion plus the ionic species) up to a radial distance at which either (i) the electrostatic energy of counterions is equal to the thermal energy of the electrolytic bath or (ii) the counterions' concentration is equal to the average ionic concentration in the bulk.50,51 In addition, there are other criteria to calculate the effective colloidal charge of macroions in salt-free and added salt systems, such as the Alexander prescription52 or the recently proposed Extrapolated Point Charge method,53 just to mention a few. Thus, such a definition of the spatial extension of the electrical double layer would be dependent on the criterion used to calculate the effective colloidal charge. Another more critical problem would arise if the profiles of counterions are nonmonotonic: in such a scenario, it would be possible to observe several distances at which the electrostatic energy of counterions is equal to the thermal energy or at which the counterions' concentration might be equal to the average concentration of counterions in bulk at high ionic volume fractions.
In the present study, we would like to follow a different path to characterize the spatial extension of the electrical double layer. Specifically, we generalize here a previous proposal to quantify the spatial extension, or thickness, of the ionic cloud surrounding a small spherical macroion54 to study now the behaviour of the electrical double layer around an infinite planar electrode. Specifically, we propose here that the role of the Debye length, as a measure to characterize the thickness of the electrical double layer, be replaced by the corresponding capacitive compactness of the associated ionic fluid. The capacitive compactness has the advantage of being able to take into account consistently important characteristics of charged fluids such as electrostatic ion correlations, ionic excluded volume, image charges, and short-range van der Waals specific interactions, as well as the surface charge density of the solute. Even though our approach is general, we would like to study here the capacitive compactness of strongly coupled charged fluids. In this sense, molten salts are constituted by ionic particles with high electrostatic correlations in the liquid phase. Molten salts are relevant for several technological applications including electricity storage devices,55 coolants in nuclear reactors,56 or pyrochemical treatment of nuclear waste.57
Thus, we have chosen to analyze the electric properties of a divalent model molten salt near a planar charged electrode via Monte Carlo simulations and integral equations theory, in an approach that goes well beyond the classical Poisson–Boltzmann picture. Our main aim is to demonstrate the advantages of using the capacitive compactness to characterize the spatial extension of the ionic cloud neutralizing a charged electrode, instead of the widely used Debye length of the supporting bulk ionic fluid. In particular, in this work we relate the behaviour of the integrated surface charge density (or net charge per unit area) of the electrode-molten salt system to the behaviour of the capacitive compactness, under several conditions of surface charge density and ionic concentration. We also establish here explicit connections between the capacitive compactness and its first two derivatives, and physically measurable quantities such as the differential and integral capacities, the colloidal charge density, and the mean electrostatic potential at the electrode's surface. On the other hand, counter-intuitive phenomena such as the inversion of the integrated charge in regions close to the colloidal surface can be observed under strong electrostatic coupling conditions. In this regard, the appearance and the behaviour of the maximum inversion of the integrated surface charge density are investigated here in different regimes.
The structure of the present study is as follows. First, the derivation of the capacity compactness, and the relationship of its first two derivatives with the integral and differential capacities in planar geometry are presented. With the purpose of illustrating the adequacy of the capacity compactness to characterize the thickness of a strongly charged fluid, a model system constituted by a divalent molten salt near an electrified planar electrode is introduced. A brief description of the Monte Carlo simulations and the integral equations theory used in this work is also provided. Then, the accuracy of our integral equations scheme is tested against simulation data collating (i) microscopic properties such as the ionic profiles and mean electrostatic potential close to the electrode's surface, and (ii) macroscopic properties of the electrical double layer such as the differential capacity and the capacitive compactness. Afterwards, the behaviour of the capacitive compactness is analyzed as a function of the microscopic ionic structure via the integrated surface charge density, and the net ionic volume charge density. The appearance and behaviour of the maximum inversion of the integrated surface charge density are analyzed as a function of the electrode's charge and the ionic concentration of the molten salt, to finish with some concluding remarks.
2 Theory, model, and numerical methods
2.1 The capacitive compactness of a charged fluid in planar geometry
In 2004, González-Tovar et al. proposed the concept of compactness to characterize the extension of the ionic cloud surrounding a spherical macroion of radius R and charge Q0 as the centroid of the diffuse charge of an equally sized binary electrolyte using electrostatic arguments.54 In brief, the compactness idea was derived in ref. 54 starting from the exact equation for the mean electrostatic potential at the macroion's surface, ψsphere0, which can be written as:| |  | (1) |
where a is the diameter of all ionic species,  is the net volume charge density of the electrolyte at a distance r measured from the macroion's center, ρj(r) is the local number of ions per unit volume of valence zj, ε is the dielectric constant of the solvent, ε0 is the vacuum permittivity, and e is the proton charge. Defining
| |  | (2) |
eqn (1) can be re-written as| |  | (3) |
From eqn (3), the quotient Q0/ψsphere0 can be physically interpreted as the capacitance of a spherical capacitor with one electrode, of charge Q0, located at R and the other one, of charge −Q0, placed at τspherec.
Naturally, the compactness associated with an infinite charged electrode can be obtained from τspherec in the limit case of a spherical macroion with infinite radius. However, we would like to propose here an alternative and more simple derivation of the compactness in planar geometry. This will be done by using the concept of a parallel plate capacitor that is equivalent to a single charged electrode and its associated electrical double layer.
Let us start by considering an infinite electrode immersed in a binary charged fluid with valences z+ and z−, bulk concentrations ρbulk+ and ρbulk−, temperature T, and dielectric constant ε. According to the bulk electroneutrality condition, the charged fluid satisfies the condition z+ρbulk+ + z−ρbulk− = 0 in bulk. Formally, the inhomogeneous ionic profiles around the charged electrode can be written as
| | ρi(x) = ρbulkigi(x) = ρbulki![[thin space (1/6-em)]](https://www.rsc.org/images/entities/char_2009.gif) exp−Wi(x)/kBT, exp−Wi(x)/kBT, | (4) |
where
gi(
x) = exp
−Wi(x)/kBT,
kB is the Boltzmann constant, and
Wi(
x) is the potential of mean force of a charged particle of species
i (with
i = +, −) located at a distance
x from the electrode's surface.
58 Note that the potential of mean force,
Wi(
x), is the required work to bring a charged particle of species
i from infinity up to a distance
x (measured from the electrode's surface) in the presence of other charged particles and the electrode (in all possible configurations consistent with a temperature
T). Even if this statistical mechanics relationship is exact, in practice, several approximations are usually assumed in the explicit calculation of
gi(
x) or
Wi(
x), as we will illustrate below. If the electrode has a constant surface charge density,
σ0, then a mean electrostatic potential at the electrode's surface,
ψ0, can be observed as a boundary condition. Very far away from the electrode's surface, the mean electrostatic potential and the electric field vanish due to the electroneutrality condition and the Gauss law. Let us suppose now that the ionic profiles (or the associated ionic potentials of mean force) are known for both ionic species. Therefore, several properties of the electrical double layer such as the mean electrostatic potential,
ψ(
x), the integrated surface charge density,
σ(
x), and the electric field,
E(
x), can be calculated from the ionic singlets,
gi(
x), as we show explicitly below.
In order to pose our alternative derivation for the capacitive compactness τc in planar geometry, let us consider for a moment a pair of infinite parallel electrodes separated by a distance τc and with surface charge densities σ0 and −σ0, which are immersed in a continuous solvent with dielectric constant ε (in the absence of charged particles) as it is shown in Fig. 1(a). The difference in the mean electrostatic potential between both electrodes can be written as:
| |  | (5) |
On the other hand, let us consider now a single charged electrode with surface charge density
σ0 in the presence of a binary charged fluid (see
Fig. 1(b)). Due to the electroneutrality condition for the whole system, the net charge per unit area of the electrical double layer is −
σ0, which has exactly the same magnitude but opposite sign regarding the electrode's surface charge density. Hence, an effective planar capacitor can be defined if the net charge per unit area of the electrical double layer is placed at a certain distance from the electrode's surface. Moreover, if the difference in the mean electrostatic potential between the plates of this effective capacitor in
eqn (5) is equated to the mean electrostatic potential at the surface of an electrode immersed in a charged fluid, that is, Δ
Ψ =
ψ0, then
τc can be defined as:
| |  | (6) |
Eqn (6) shows clearly why we propose to call
τc the capacitive compactness of the planar electrical double layer:
τc is a natural measure of the spatial extension of the electrical double layer since it represents the distance at which the net charge of the ionic cloud (neutralizing the electrode) should be placed in order to have an effective planar capacitor with a difference in the electrostatic potential
ψ0 between the plates. Moreover,
eqn (6) is an exact relationship among the capacitive compactness, the colloidal surface charge density, and the mean electrostatic potential at the electrode's surface. One significant difference between the Debye length of a charged fluid in the bulk,
λD, and the capacitive compactness,
τc, to characterize the extension of the electrical double layer is that
τc can include effects due to electrostatic ion correlations, ionic excluded volume, image charges, and short-range specific attractions (such as van der Waals forces)
via its relationship with the mean electrostatic potential at the electrode's surface
ψ0. Besides, for a given ionic strength the Debye length is a constant, and thus the thickness of the electrical double layer is completely independent of the surface charge density on the electrode. In contrast, the thickness of the electrical double layer quantified
via the capacitive compactness,
τc, explicity depends on
σ0, and also depends implicitly on
σ0via ψ0(
σ0) (see,
e.g.,
Fig. 6).
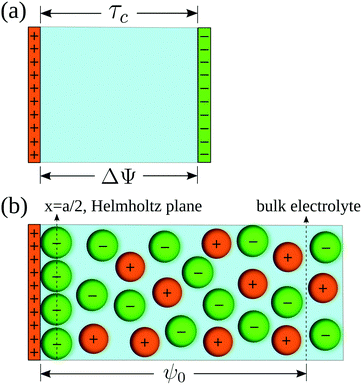 |
| | Fig. 1 (a) Equivalent planar capacitor. (b) Schematic representation of the model system. | |
Notice that eqn (6) is a general result for a charged fluid in the presence of an infinite planar electrode. This can be seen directly starting from the definition of the mean electrostatic potential at the electrode's surface
| |  | (7) |
where
hi(
x) =
gi(
x) − 1. Considering the bulk electroneutrality of the charged fluid and the global electroneutrality of the whole system,
eqn (7) can be written as
| | 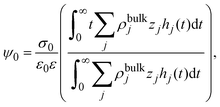 | (8) |
and identifying the capacity compactness as
| | 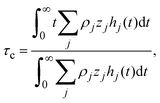 | (9) |
then
eqn (6) is recovered. One advantage of
eqn (9) is that it displays explicitly the connection between the capacity compactness, which is a macroscopic property of the electrical double layer, with the microscopic structure of the charged fluid from first principles.
From the definition of the integral capacitance of a charged electrode
| |  | (10) |
it is straightforward to show that the capacitive compactness is inversely proportional to the integral capacitance
| |  | (11) |
On the other side, let us ponder now the special case in which there is a common closest approach distance between all charged particles and the planar electrode's surface, as occurs in the restricted primitive model where all ionic species are equally sized. In this instance, the capacitive compactness and the integral capacity can be written as:
| |  | (12) |
and
| |  | (13) |
where
a/2 is the radius of the ionic species. The closest approach distance between the charged particles and the electrode's surface (located at
x = 0) defines the so-called Helmholtz plane (see
Fig. 1(b)), and
ψH =
ψ(
x =
a/2) is the mean electrostatic potential at the Helmholtz plane.
As an important illustration of the use of eqn (9), let us consider the case of the linearized Poisson–Boltzmann theory. In this mean field approach, the capacitive compactness reduces to the Debye length of the supporting charged fluid in bulk. This result can be easily obtained as follows. First, let us approximate the ionic potential of mean force by the corresponding electrostatic energy, Wi(x) ≈ zieψ(x), in eqn (4). If these ionic profiles are substituted in the Poisson equation, ψ′′(x) = −ρel(x)/(ε0ε), one obtains the non-linear Poisson–Boltzmann equation:
| |  | (14) |
Linearizing the exponential term,
eqn (14) reduces to the linearized Poisson–Boltzmann equation:
| |  | (15) |
where
| |  | (16) |
and
λD = 1/
κD is the Debye length. From the solution of this equation and the electroneutrality condition, it is straightforward to show that the surface charge density is proportional to the mean electrostatic potential at the surface:
Inserting
eqn (17) in
eqn (6) shows that
τc =
λD, that is, the capacity compactness effectively reduces to the Debye length of the supporting charged fluid in the bulk in this mean field approach. From
eqn (6), (10) and (17) it is possible to observe that, in the linearized Poisson–Boltzmann equation, the integral capacitance is proportional to
κD and the capacitive compactness is inversely proportional to the integral capacitance, satisfying
eqn (11).
On the other hand, from the fundamental definition of the capacitive compactness (see eqn (6)), it is possible to write, in general, the differential capacity as
| |  | (18) |
which implies that
Cdiff−1 explicitly depends on the capacitive compactness and its first derivative. Using the definition of the integral capacity (see
eqn (10)),
eqn (18) can be also written as
| | | Cdiff−1 = CΔ−1 + Cint−1, | (19) |
where
| |  | (20) |
In general, τc depends on the colloidal surface charge density σ0. However, if τc is independent of σ0 then  and Cdiff = Cint, which occurs precisely in the linearized Poisson–Boltzmann theory. Such an approximation is valid only in the limit of very dilute electrolytes with low electrostatic coupling and in the presence of very weakly charged colloids or electrodes.
On the other side, if the differential and integral capacities are known from experiments, simulations, or theory, the first derivative of the capacitive compactness can be calculated as
| |  | (21) |
Note that eqn (21) is trivially fulfilled in the linearized Poisson–Boltzmann theory given that Cdiff = Cint in such a theoretical approach.
In addition, the second derivative of the capacitive compactness can be written as
| |  | (22) |
or equivalently:
| |  | (23) |
2.2 Model system
For simplicity, a molten salt is modeled here using the so-called restricted primitive model. In this representation, the ionic particles are mimicked by equally-sized hard spheres of diameter a with point charges qi = zie embedded at their centers, such that zi is the valence of the ionic species i and e is the proton charge. An infinite and impenetrable charged wall is in contact with a molten salt, which is additionally characterized by a dielectric constant ε at a temperature T (a schematic representation is shown in Fig. 1(b)).
The pair interaction potential between any pair of ionic particles, used in simulations and theory, is given by:
| |  | (24) |
where the subscripts
i,
j = +, −;
r denotes the distance between the centers of two charged hard particles of type
i and
j, and
ε is the dielectric constant in all space, including the interior of the solid electrode. As a result, polarization effects are not taken into account in the present study.
The interaction potential between a hard ionic particle of type i and the infinite and impenetrable charged electrode is given by:
| |  | (25) |
where
σ0 is the surface charge density on the electrode's surface. The electrode's surface is placed at
x = 0, and the closest approach distance between the ionic particles of diameter
a and the hard electrode is located at
xH = (
a/2), which defines the so-called Helmholtz plane (see,
e.g.,
Fig. 1(b)).
2.3 Monte Carlo simulations
Monte Carlo simulations of a molten salt in the presence of a charged electrode have been performed in a rectangular simulation cell. Periodic boundary conditions are used in two directions (y- and z-axis), and a finite length along the x-axis is considered. Two infinite and impenetrable charged walls with surface charge density σ0 are placed in both sides of the simulation cell. The width and length of the simulation cell are W = 50.63 and L = 58.00 Å, respectively. During all simulations, the surface charge density on the electrodes is neutralized by the presence of an excess of counterions. For efficiency, Monte Carlo simulations in the grand canonical ensemble have been performed at low ionic concentrations, whereas NVT canonical simulations have been done at large ionic volume fractions. The ionic profiles are quantified via singlet distribution functions gi(x) for each ionic species i = +, −. The method of interpolation of polynomials59 is applied to calculate the differential capacitance Cdiff in the simulations. A fifth-order polynomial has been used to fit a series of mean electrostatic potentials at the electrode's surface, and the associated surface charge density. Electrostatic interactions are calculated via the charge-sheets method proposed by Valleau and Torrie,60 in which an infinite charged plane with a square hole is considered in the simulation cell. More details about the Monte Carlo simulations can be found elsewhere.61–64
2.4 Integral equations theory
The ionic profiles around an infinite charged hard wall, including ion correlations and excluded volume effects, can be calculated via the Ornstein–Zernike equation suplemented with the hypernetted-chain/mean spherical approximation (HNC/MSA) closures. The HNC/MSA description of the planar electrical double layer initiates with the Ornstein–Zernike equations describing the ionic cloud around a single spherical macroion, which can be written as| |  | (26) |
for j = −, +; where hMj(r) = gMj(r) − 1 are the total ionic correlation functions between a single spherical macroion M and the ionic species j, and gMj(r) are the ionic pair distribution functions. The direct correlation functions between ions and the spherical colloid are specified using the hypernetted-chain (HNC) closure cMj(r) = −βUMj(r) + hMj(r) − ln[hMj(r) + 1]. The ion–ion direct correlation functions ckj(|![[r with combining right harpoon above (vector)]](https://www.rsc.org/images/entities/i_char_0072_20d1.gif) −
− ![[t with combining right harpoon above (vector)]](https://www.rsc.org/images/entities/i_char_0074_20d1.gif) |) are approximated by the analytical mean spherical approximation (MSA) expressions for a bulk electrolyte at a concentration ρk.65,66 The planar limit of the HNC/MSA integral equations was obtained by Carnie et al.67 in a study of the electrical double layer of equally-sized ions next to an infinite and impenetrable charged wall. The detailed derivation of these equations for the planar instance is given in the ESI.† The final equations are the following:
|) are approximated by the analytical mean spherical approximation (MSA) expressions for a bulk electrolyte at a concentration ρk.65,66 The planar limit of the HNC/MSA integral equations was obtained by Carnie et al.67 in a study of the electrical double layer of equally-sized ions next to an infinite and impenetrable charged wall. The detailed derivation of these equations for the planar instance is given in the ESI.† The final equations are the following:| | 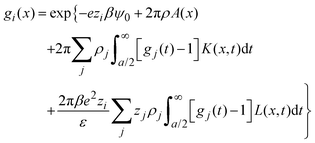 | (27) |
for  , ψ0 = ψ(x = 0), and i,j = −, +, where
| |  | (28) |
if  , and A(x) = 0 if
  ;
;| |  | (29) |
if x − a ≤ t ≤ x + a, and K(x,t) = 0 if t < x − a or x + a < t; and| |  | (30) |
if x − a ≤ t ≤ x + a; L(x,t) = −2t if t < x − a; and L(x,t) = − 2x if x + a < t.
In terms of the total correlation functions, eqn (27) can be written as
| | 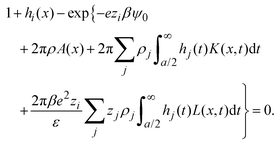 | (31) |
These equations are a complete set of integral equations that are solved numerically via an efficient finite element method.68
Once the ionic singlet profiles gi(x) have been determined, from theory or simulation, it is possible to calculate the mean electrostatic potential and the integrated surface charge density as a function of the distance to the electrode's surface, respectively, as:
| |  | (32) |
and
| |  | (33) |
Charge reversal occurs when
σ(
x)/
σ0 < 0, that is, when the integrated surface charge density displays an opposite sign regarding the sign of the native surface charge density on the electrode,
σ0. Physically, this behaviour can be promoted by a strong adsorption of counterions to a colloidal surface producing, in turn, a local overcompensation of the native charge on the colloid.
69
The bare surface charge density of the electrode can also be calculated in terms of the total ionic adsorption of each ionic species, Γi, as
| |  | (34) |
where
19| |  | (35) |
On the other hand, if the ionic adsorption is now defined locally as a function of the distance to the electrode's surface, namely
| |  | (36) |
and due to the global electroneutrality, the local integrated surface charge density can then be put in the form
| |  | (37) |
Based on the above, since the electric field is proportional to σ(x), the capacity compactness can also be recast as
| |  | (38) |
From the previous equation we deduce that the determination of the capacity compactness is indeed possible if the integrated surface charge density or the generalized local ionic adsorptions, dependent on the distance to the electrode's surface, are available.
3 Results and discussion
3.1 Comparisons between integral equations and Monte Carlo data
The integral equations approach based on the HNC/MSA closure has been successfully employed in a large number of investigations of monovalent, and divalent aqueous electrolytes in the bulk, and near charged interfaces with different geometries.69–72 However, to the best of our knowledge, this theoretical scheme has not been used to study strongly coupled charged fluids such as molten salts or ionic liquids. Thus, in order to validate the accuracy and limitations of the HNC/MSA integral equations in such conditions, we present first a series of comparisons with Monte Carlo simulations of a primitive model charge-asymmetric 2![[thin space (1/6-em)]](https://www.rsc.org/images/entities/char_2009.gif) :
:![[thin space (1/6-em)]](https://www.rsc.org/images/entities/char_2009.gif) 1 molten salt near a planar charged electrode.61 In this system, anions are divalent, z− = −2, cations are monovalent, z+ = +1, and both ionic species have a diameter a = 4 Å. Notice that the molar concentration of cations is twice the molar concentration of anions due to the electroneutrality condition of the bulk solution. The dielectric constant and temperature of the molten salt are 10, and 2800 K, respectively.61 The valences, the ionic size, and the dielectric permittivity and temperature of the molten salt are kept constant hereinafter.
1 molten salt near a planar charged electrode.61 In this system, anions are divalent, z− = −2, cations are monovalent, z+ = +1, and both ionic species have a diameter a = 4 Å. Notice that the molar concentration of cations is twice the molar concentration of anions due to the electroneutrality condition of the bulk solution. The dielectric constant and temperature of the molten salt are 10, and 2800 K, respectively.61 The valences, the ionic size, and the dielectric permittivity and temperature of the molten salt are kept constant hereinafter.
The adsorption of counterions theoretically predicted by the HNC/MSA ionic singlets is compared with the corresponding Monte Carlo results in Fig. 2. Three cases are displayed in this figure: (i) divalent counterions for σ0 > 0, (ii) monovalent counterions for σ0 < 0, and (iii) the electrode is uncharged. The magnitude of the electrode's surface charge density is the same when the electrode is charged (|σ0| > 0), and the ionic strength is also constant in all cases. A sensible agreement between theory and simulation is observed in a wide region near the electrode's surface, where the height and location of the extrema are similar in both approaches. The largest difference is observed very near to the closest approach distance between the ionic species and the electrode, or Helmholtz plane, where the ionic contact values predicted by the HNC/MSA integral equations are larger than the corresponding Monte Carlo values. This behaviour is a well known limitation of the HNC/HNC and HNC/MSA closures that usually appears in the presence of strong attractive interactions. On the other hand, an analogous comparison to that displayed in Fig. 2 is now shown in Fig. 3 for divalent and monovalent coions. Here, we observe again a sensible agreement between theory and simulations for all regions except close to the Helmholtz plane.
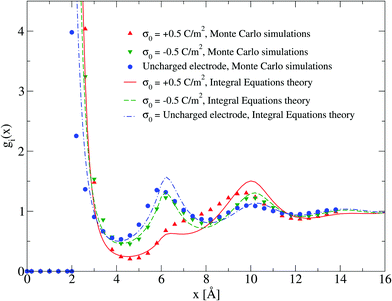 |
| | Fig. 2 Singlet distribution functions of divalent, and monovalent counterions near a charged electrode: g−(x) corresponds to an electrode's surface charge density σ0 = 0.5 C m−2 (upward red triangles and solid line), and g+(x) is associated to an electrode's surface charge density σ0 = −0.5 C m−2 (downward green triangles and dashed line). For comparison, the singlet distribution g0(x) corresponding to an uncharged electrode (blue circles and dot-dashed line) is presented. Solid symbols and lines correspond to Monte Carlo simulations61 and integral equations theory results (this work), respectively. The contact values are gMC−(a/2) = 21.1, gMC+(a/2) = 12.1, and gMC0(a/2) = 3.9 for Monte Carlo simulations, and gIE−(a/2) = 31.727, gIE+(a/2) = 18.065, and gIE0(a/2) = 8.587 for integral equations. In all cases the ionic concentration of anions is 5.79 M. | |
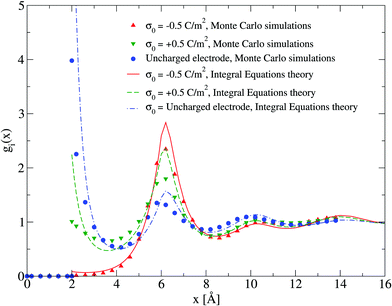 |
| | Fig. 3 Singlet distribution functions of divalent, and monovalent coions near a charged electrode: g−(x) corresponds to an electrode's surface charge density σ0 = −0.5 C m−2 (upward red triangles and solid line), and g+(x) is associated to an electrode's surface charge density σ0 = 0.5 C m−2 (downward green triangles and dashed line). For comparison, the singlet distribution g0(x) corresponding to an uncharged electrode (blue circles and dot-dashed line) is presented. Solid symbols and lines correspond to Monte Carlo simulations61 and integral equations theory results (this work), respectively. The contact values are gMC−(a/2) = 0.01, gMC+(a/2) = 1.0, and gMC0(a/2) = 3.9 for Monte Carlo simulations, and gIE−(a/2) = 0.087, gIE+(a/2) = 2.246, and gIE0(a/2) = 8.587 for integral equations. In all cases the ionic concentration of anions is 5.79 M. | |
Electrical properties of a charged fluid such as the mean electrostatic potential or the integrated surface charge density (eqn (32) and (33)) are functionals (or spatial integrals) of the ionic density profiles. In Fig. 4, a comparison between the theoretical and simulation values of the mean electrostatic potential as a function of the distance to the electrode's surface is displayed for several surface charge densities. An excellent agreement is observed here at low surface charge densities, even though the theoretical description deteriorates at large electric fields. In spite of this limitation, we observe a semi-quantitative agreement between integral equations and Monte Carlo results, e.g., the theoretical positions of the maxima and minima are very close to those obtained via simulations, and we also observe both in theory and simulation that the magnitude of the mean electrostatic potential at the electrode's surface is larger in the presence of monovalent counterions (σ0 < 0) compared to divalent counterions (σ0 > 0) when the magnitude of the electrode's charge and the ionic concentration are large, at the same ionic strength. A more stringest test is the comparison of the differential capacity obtained via theory and simulation as a function of the electrodode's surface charge density and the ionic concentration of the molten salt. Such comparisons are displayed in Fig. 5, where a qualitative agreement between the HNC/MSA integral equations and Monte Carlo simulations is observed. The best agreement is seen at low ionic concentrations and close to the point of zero charge (that is, when the electrode is weakly charged). When the electrolyte concentration increases, integral equations theory is able to predict the bell-shape displayed by the Monte Carlo simulations. In this case, the agreement is only qualitative because the height of the maximum is overestimated and its location is shifted. At low ionic concentrations and low surface charge densities, integral equations theory reproduces qualitatively the U-shape differential capacity typically displayed by aqueous electrolytes very close to the point of zero charge. On the other hand, when the surface charge density increases, the simulation differential capacity increases until a maximum value or peak is reached. At higher surface charges, the differential capacity decreases and a double-humped camel shape can be observed according to molecular simulations and mechanical statistical theories.23,26,27 Notice that the criterion of inversion of the differential capacity concavity, as an indication of the local inversion of the electric field or the charge reversal, is proposed only for charge densities very close to the point of zero charge and not for the high colloidal charges at which the double-humped camel shape is observed. On the other hand, the HNC/MSA integral equations approach fails to predict the double-hump camel shape displayed by Monte Carlo simulations at low ionic concentrations, although this theory does show the single-hump maximum at high concentrations. This limitation has its origin very likely in the use of the Percus–Yevick direct correlation function for the hard sphere contribution. It is very well known that the pressure predicted by this approximation in a hard sphere system deviates from the Carnahan–Starling equation as a function of the volume fraction. We foresee that this limitation can be overcome by using a better hard sphere direct correlation function, or by using more sophisticated approaches such as the Modified Poisson–Boltzmann theory18–20,22,26 or improved versions of density functional theory.21,27
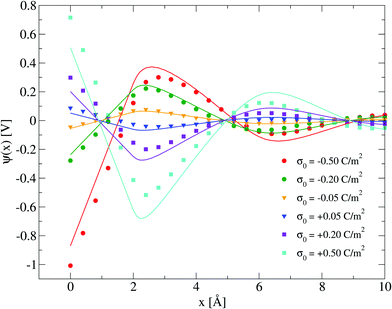 |
| | Fig. 4 Mean electrostatic potential ψ(x) for several surface charge densities of the electrode. Solid symbols and lines correspond to Monte Carlo simulations61 and integral equations theory results (this work), respectively. In all cases the ionic concentration of anions is 5.79 M. | |
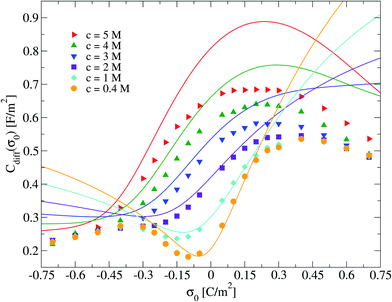 |
| | Fig. 5 Differential capacitance, Cdiff, of the electrical double layer of the molten salt as a function of the surface charge density, σ0, for several concentrations of anions. Solid symbols and lines correspond to Monte Carlo simulations61 and integral equations theory results (this work), respectively. | |
3.2 The capacitive compactness of a molten salt near an electrified electrode
In this section we analyze the capacitive compactness of our 2![[thin space (1/6-em)]](https://www.rsc.org/images/entities/char_2009.gif) :
:![[thin space (1/6-em)]](https://www.rsc.org/images/entities/char_2009.gif) 1 primitive model molten salt as a function of its molar concentration and the electrode's charge. The behaviour of τc obtained via integral equations and Monte Carlo simulations is displayed in Fig. 6. In this figure, a maximum value of the capacitive compactness is observed at a slightly negative surface charge density of the electrode (near the point of zero charge) for the lowest concentration of the molten salt. When the magnitude of the electrode's surface charge density increases, both theory and simulation display a monotonic decrease of the capacitive compactness. This suggests that, at low molar concentrations, the electrical double layer becomes more compact or shrinks as a function of the electrode's charge regardless of the valence of the counterions. The largest drop occurs when counterions are divalent (σ0 > 0). If the concentration of the molten salt increases, the theoretical predictions deteriorate but a qualitative agreement between simulation and theory can still be observed. The magnitude of the maximum capacitive compactness displayed at the lowest concentration of the molten salt decreases when the salt concentration increases. Eventually such a maximum disappears, and the capacitive compactness increases as a function of the magnitude of the electrode's charge when counterions are monovalent (σ0 < 0). In the case of divalent counterions at high concentrations, it is observed that the capacitive compactness decreases near the point of zero charge, reaching a slow varying plateau as a function of the positive surface charge density of the electrode. The above behaviour suggests that, at very high ionic concentrations, the ionic cloud swells or expands in the presence of monovalent counterions when the magnitude of the charge on the electrode augments, whereas the extension of the ionic cloud in the presence of divalent counterions contracts, reaching a limiting value, when the charge on the electrode increases. This rich behaviour of the capacitive compactness τc contrasts with the constant extension of the electrical double layer predicted by the linearized Poisson–Boltzmann approach (indicated by the symbols plotted on the right vertical axis of Fig. 6).
1 primitive model molten salt as a function of its molar concentration and the electrode's charge. The behaviour of τc obtained via integral equations and Monte Carlo simulations is displayed in Fig. 6. In this figure, a maximum value of the capacitive compactness is observed at a slightly negative surface charge density of the electrode (near the point of zero charge) for the lowest concentration of the molten salt. When the magnitude of the electrode's surface charge density increases, both theory and simulation display a monotonic decrease of the capacitive compactness. This suggests that, at low molar concentrations, the electrical double layer becomes more compact or shrinks as a function of the electrode's charge regardless of the valence of the counterions. The largest drop occurs when counterions are divalent (σ0 > 0). If the concentration of the molten salt increases, the theoretical predictions deteriorate but a qualitative agreement between simulation and theory can still be observed. The magnitude of the maximum capacitive compactness displayed at the lowest concentration of the molten salt decreases when the salt concentration increases. Eventually such a maximum disappears, and the capacitive compactness increases as a function of the magnitude of the electrode's charge when counterions are monovalent (σ0 < 0). In the case of divalent counterions at high concentrations, it is observed that the capacitive compactness decreases near the point of zero charge, reaching a slow varying plateau as a function of the positive surface charge density of the electrode. The above behaviour suggests that, at very high ionic concentrations, the ionic cloud swells or expands in the presence of monovalent counterions when the magnitude of the charge on the electrode augments, whereas the extension of the ionic cloud in the presence of divalent counterions contracts, reaching a limiting value, when the charge on the electrode increases. This rich behaviour of the capacitive compactness τc contrasts with the constant extension of the electrical double layer predicted by the linearized Poisson–Boltzmann approach (indicated by the symbols plotted on the right vertical axis of Fig. 6).
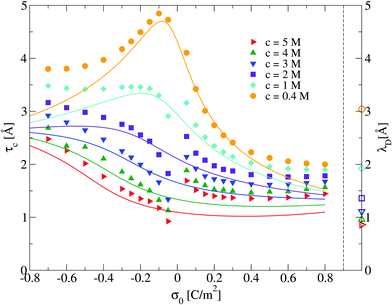 |
| | Fig. 6 Capacitive compactness, τc, of the electrical double layer as a function of the surface charge density, σ0, for several concentrations of anions. Solid symbols and lines correspond to Monte Carlo simulations (this work), and integral equations theory results (this work), respectively. The Debye lengths associated to each bulk ionic concentration are displayed as empty symbols on the right side next to the dashed vertical line as a reference. | |
In order to interpret the behaviour of the capacitive compactness τc in terms of the microscopic ionic structure, the theoretical integrated surface charge density σ(x) is displayed in Fig. 7 as a function of the distance to the electrode's surface at a low salt concentration (0.4 M). In the presence of monovalent counterions (top panel), it is observed that the integrated surface charge density becomes more compact when the magnitude of the negative surface charge density of the electrode increases, that is, σ(x,σ0′′)/σ0′′ < σ(x,σ0′)/σ0′ if |σ0′′| > |σ0′| for all x. A similar behaviour is observed in the presence of divalent counterions (bottom panel). In addition, it is seen that the integrated surface charge density is more compact when counterions are divalent at the same ionic strength, that is, σdivalent(x,σ0)/σ0 < σmonovalent(x,σ0)/σ0 for all x and a given |σ0|. On the other hand, an inversion of the integrated surface charge density is seen at large positive surface charge densities of the electrode in the presence of divalent counterions, that is, σdivalent(x,σ0)/σ0 < 0 for sufficiently large charge densities on the electrode's surface. Let us define the maximum inversion of the integrated surface charge density as −σ*/σ0 ≡ −σ(xmin,σ0)/σ0, where σ(xmin,σ0)/σ0 < 0 and σ(xmin,σ0)/σ0 < σ(x,σ0)/σ0 for all x at a given value of σ0. Accordingly, in Fig. 7(b) it is observed that the maximum inversion of the integrated surface charge density increases as a function of the electrode's charge. Moreover, notice that the inversion of the integrated surface charge density shown in Fig. 7(b) (for divalent counterions at the two highest electrode charges) is completely absent in Fig. 7(a) (for monovalent counterions at the same ionic strength when the electrode's charge has the same magnitude). Thus, the presence or absence of a local charge inversion near the electrode cannot be inferred a priori from the associated differential capacity or capacity compactness curves shown in Fig. 5 and 6, respectively, at low ionic concentrations.
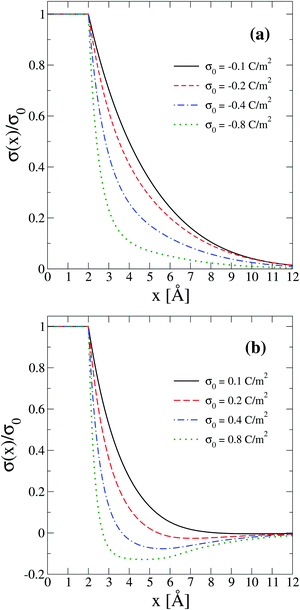 |
| | Fig. 7 Integrated surface charge density, σ(x), as a function of the distance to the colloidal surface obtained via integral equations theory. The charge density on the colloidal surface is denoted by σ0. The concentration of anions in all cases is 0.4 M. | |
The behaviour of the theoretical integrated surface charge density, σ(x), as a function of the electrode's charge at a high concentration of the molten salt (5.0 M) is displayed in Fig. 8. In the presence of monovalent counterions, a non-monotonic behaviour is observed as a function of the distance to the electrode's surface for all negative surface charge densities as shown in Fig. 8(a). Moreover, the distances at which extrema occur increase when the magnitude of the electrode's charge augments. This behaviour is consistent with the expansion or swelling of the electrical double layer suggested by the capacitive compactness in Fig. 6. In addition, notice that the magnitude of the maximum inversion of the integrated surface charge density decreases when the magnitude of the electrode's charge augments. On the other hand, let us consider the case in which counterions are divalent as shown in Fig. 8(b). In this instance, the integrated surface charge density is non-monotonic and the magnitude of the maximum inversion of the integrated surface charge density decreases when the magnitude of the electrode's charge augments, as occurred in the presence of monovalent counterions at the same ionic strength. However, the position of the maximum inversion of the integrated surface charge density remains approximately constant as a function of the magnitude of the electrode's charge in the presence of divalent counterions. This behaviour is consistent with the arrest, or absence of a noticeable shrinking or swelling of the electrical double layer, displayed by the capacitive compactness in Fig. 6 as a function of the magnitude of the electrode's charge. In addition, the presence of the local charge reversal in Fig. 8(a) and (b) suggests that the concavity's reversion of the differential capacity at high ionic concentrations could be used, in principle, to detect the occurrence of a local inversion of the integrated surface charge density around the point of zero charge.
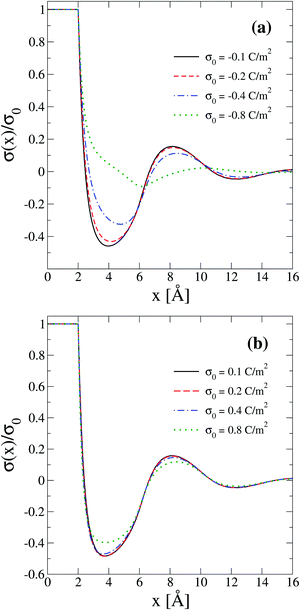 |
| | Fig. 8 Integrated surface charge density, σ(x), as a function of the distance to the colloidal surface obtained via integral equations theory. The charge density on the colloidal surface is denoted by σ0. The concentration of anions in all cases is 5.0 M. | |
Another interpretation of the shrinking, swelling, or arrest of the electrical double layer predicted by the capacitive compactness can be elucidated from the behaviour of the net ionic charge density near the electrode. Due to the electroneutrality condition, it is easy to verify that the net ionic charge density  is proportional to the difference of ionic singlets g+(x) − g−(x). This last quantity is plotted in Fig. 9 under the same conditions used in Fig. 8. Let us define x′ as the closest distance to the electrode's surface at which the difference of the ionic singlets is zero, i.e., g+(x′) − g−(x′) = 0; and let us define x′′ as the distance at which the ionic singlet difference has its minimum value, that is, g+(x′′) − g−(x′′) < g+(x) − g−(x) for all x. In Fig. 9(a), it is observed that both distances, x′ and x′′, increase as a function of the magnitude of the electrode's charge density. This microscopic behaviour is consistent with the swelling of the electrical double layer displayed by the capacitive compactness in Fig. 6, and with the expansion of the integrated surface charge density observed in Fig. 8(a). The arrest, or absence of a significant shrinking or swelling of the electrical double layer when the magnitude of the electrode's charge augments, can be also observed in the presence of divalent counterions as a function of the ionic singlet difference in Fig. 9(b). In this figure, it is evident that the location of extrema and the crossings with zero of the ionic singlet differences remain approximately constant when the electrode's charge increases. As a result, the main effect of increasing the surface charge density of the electrode in the presence of divalent counterions at high salt concentrations is to augment the net ionic volume charge density locally in specific fixed regions without causing a noticeable change in the magnitude of τc. These observations are again consistent with the behaviour displayed by the capacitive compactness in Fig. 6, and with the microscopic picture described by the integrated surface charge density in Fig. 8(b).
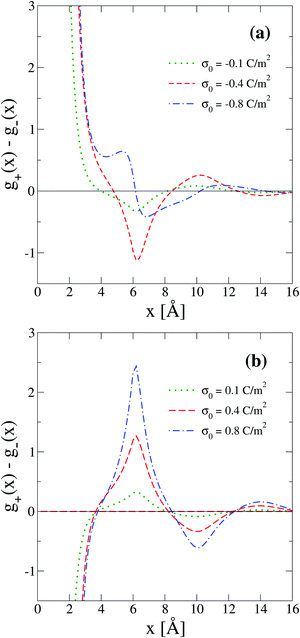 |
| | Fig. 9 Difference between the reduced density profiles of cations and anions obtained via integral equations theory. The concentration of anions in all cases is 5.0 M. | |
On the other side, one limitation of the differential capacity or the capacitive compactness is that they cannot provide information about the appearance of sign inversion of the integrated surface charge density or the electric field. Thus, in order to analyze this property as a function of the salt concentration and the electrode's charge density, the maximum inversion of the integrated surface charge density is plotted in Fig. 10 for several conditions. In this plot, it is observed that at the lowest salt concentration (0.4 M) there is no sign inversion of the integrated surface charge density in the presence of monovalent counterions (σ0 < 0). In contrast, a monotonic increase of the magnitude of the maximum inversion of the integrated surface charge density can be observed in the presence of divalent counterions (σ0 > 0) as a function of the electrode's charge at the same ionic concentration (0.4 M). When the salt concentration increases (to 1 M), we observe the appearance of an inversion of the integrated surface charge density very near the point of zero charge. The maximum inversion of the integrated surface charge density decreases when the magnitude of the surface charge density, or the electric field, increases in the presence of monovalent counterions (σ0 < 0). The opposite behaviour is observed in the presence of divalent counterions (σ0 > 0). When the ionic concentration further increases (to 2 M and higher concentrations), the maximum inversion of the integrated surface charge density displays a maximum value in the presence of divalent counterions (at some positive surface charge density on the electrode). Note that the magnitude of the maximum inversion of the integrated surface charge density displayed in Fig. 10 is larger in the presence of divalent counterions (σ0 > 0) compared to monovalent counterions (σ0 < 0) for the same magnitude of the electrode's charge at a given ionic strength. Moreover, notice that the local inversion of the integrated surface charge density around the point of zero charge at high ionic concentrations displayed in Fig. 10 coincides with the concavity reversion of the differential capacity around the point of zero charge displayed in Fig. 5. This suggests that a change of concavity in the differential capacity around the point of zero charge as a function of the ionic concentration, from a U-shape to a bell-shape, could be used to detect the appearance of a local inversion of the integrated surface charge density of a charged colloid or electrode.
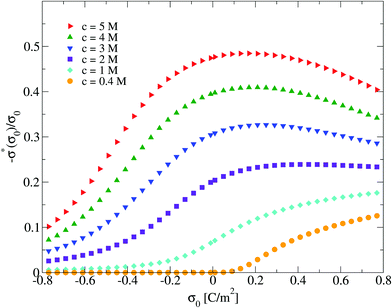 |
| | Fig. 10 Maximum integrated surface charge density obtained via the integral equations theory as a function of the colloidal surface charge density, σ0, and the concentration of anions. | |
To finish this section, we would like to discuss some possible applications of the first two derivatives of the capacity compactness. In this sense, if the integral capacity is known experimentally as a function of the electrode's charge then, in principle, the first and second derivatives of the capacity compactness can be calculated numerically. On the other hand, if the differential and integral capacities are known experimentally, they have to fulfill eqn (21) and (23). Thus, these equations can be used to determine the quality and/or uncertainty of both capacities measured experimentally. Besides, if only the integral capacity is known, eqn (21) can be used to calculate the differential capacity of the system. By way of example, the typical behaviour of the first two derivatives of the theoretical capacity compactness at an ionic concentration of 0.4 M is displayed in Fig. 11 as a function of the charge density on the electrode's surface.
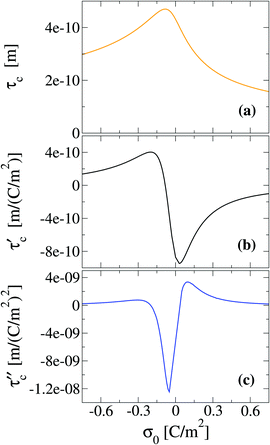 |
| | Fig. 11 Capacitive compactness, τc, and its first two derivatives regarding the colloidal surface charge density, σ0, obtained via the integral equations theory. The concentration of anions in all cases is 0.4 M. | |
4 Concluding remarks
The Debye length of a charged fluid in the bulk is the classical and more widely used parameter to characterize the spatial extension of the ionic cloud surrounding an electrified electrode or a charged colloidal particle. This prescription is based on the linearized Poisson–Boltzmann equation, which is valid, in principle, only in the presence of very low colloidal charges and very weak electrostatic coupling. In spite of the wide use of the Debye length as a practical measure to characterize the thickness of the electrical double layer (due probably to its simplicity), this iconic length does not take into account important physical features of charged fluids such as electrostatic ion correlations, ionic excluded volume effects, polarization effects, or specific short-range interactions, as well as the effect of the colloidal surface charge density. With that purpose in mind, we have extended here the concept of capacitive compactness, originally proposed for small spherical colloids, to characterize the extension of the electrical double layer in planar geometry taking into account, at the same time, the above physical features typically present in charged colloidal fluids. Specifically, it has been shown here that the behaviour of the capacitive compactness is consistent with the microscopic shrinking and swelling of the integrated surface charge density, or the electric field, associated with a molten salt next to an infinite planar electrode. At low salt concentrations of the molten salt, a maximum in the capacitive compactness is observed near the the point of zero charge. At these low ionic concentrations, the main effect of increasing the magnitude of the electrodes's charge is to decrease the capacitive compactness or thickness of the electrical double layer regardless of the valence of counterions for a given ionic strength. In other words, the electrical double layer becomes more compact or shrinks if the magnitude of the electrodes's charge increases at low ionic concentrations. At high salt concentrations of the molten salt, two contrasting behaviours are observed at a given ionic strength depending on whether the counterions are monovalent or divalent. If the counterions are monovalent, the electrical double layer swells or expands when the magnitude of the electrodes's charge augments. On the contrary, if counterions are divalent the distances at which the extrema of the integrated surface charge density and the net local ionic concentration appear do not change noticeably when the electrode's charge increases. Thus, the spatial extension, or thickness, of the electrical double layer remains approximately fixed or “arrested” even if the surface charge density on the electrode augments. In this last scenario, the main effect of increasing the electrode's charge is to augment the magnitude of the integrated surface charge density and the net local ionic concentration in fixed specific regions.
One limitation of the capacitive compactness is that this quantity is not able to provide precise information about the adsorption of ionic charge or the appearance of a local inversion of the integrated charge (or the electric field). However, notice that this limitation is also shared by the differential capacity that has a U-shape, that is, we have shown here that the numerical values of the differential capacity in these circumstances cannot be used to determine a priori the presence of a local inversion of the integrated charge near the electrode's surface. Contrastingly, we have observed that an inversion of the curvature or concavity of the differential capacity as a function of the electrode's charge, from a U-shape to a bell-shape, seems to be indeed related to the occurrence of an inversion of the integrated surface charge density or the electric field around the point of zero charge. This behaviour has been suggested in a previous study of an electrified nitrobenzene/water interface, in which a monovalent organic salt was present in the oil phase and a divalent inorganic salt was present in the aqueous phase at high electrolyte concentrations.62
Experimental measurements of the capacity compactness and its derivatives are crucial to validate several of the predictions performed in this study. In order to calculate these quantities, it is necessary to determine the colloidal surface charge density, the differential capacity, and the mean electrostatic potential at the electrode's surface. The colloidal surface charge density can be determined in experiments via chemical titration. The differential capacity can be measured experimentally via impedance techniques. In contrast, the mean electrostatic potential at the electrode's surface poses important technical difficulties, which were thought impossible to overcome.73,74 Fortunately, it has been shown very recently that it is possible to measure experimentally the mean electrostatic potential at the surface of charged colloids directly by using X-ray photoelectron spectroscopy.75 The application of this kind of measurement is very promising to study fine details of the electrical double layer of multivalent aqueous electrolytes, molten salts, or ionic liquids near charged interfaces. Therefore, the usage of the above experimental techniques could be very appropriate to validate the physical reality and usefulness of the capacity compactness and its derivatives in colloidal systems. These novel concepts, introduced here, constitute a simple and robust set of tools that allow us to characterize more accurately strongly correlated charged fluids in external electric fields.
Conflicts of interest
There are no conflicts to declare.
Acknowledgements
The authors thankfully acknowledge the Laboratorio Nacional de Supercómputo del Sureste de México, and the Cinvestav-Abacus supercomputer for the computer resources, technical expertise and support provided. G. I. G.-G. acknowledges the FAI-UASLP grant C16-FAI-09-41.41, the SEP-CONACYT CB-2016 grant 286105, and the CONACYT-Fronteras de la Ciencia grants 440 and FC-2015-2-1155, as well as the financial support received from the Mexican National Council of Science and Technology (CONACYT) as a CONACYT Research Fellow at the Institute of Physics of the Autonomous University of San Luis Potosí (IF-UASLP) in Mexico. G. I. G.-G., E. G.-T., and M. C.-P. also express their gratitude for the assistance from the computer technicians at the IF-UASLP. M. C.-P. thanks the CONACYT grant 182132 and the Laboratorio Nacional de Ingeniería de la Materia Fuera de Equilibrio-279887-2017. S. L. and J. K. gratefully acknowledge the financial support from the Faculty of Chemistry, Adam Mickiewicz University in Poznań.
References
- T. Palberg, H. Schweinfurth, T. Koller, H. Muller, H. J. Schope and A. Reinmuller, Eur. Phys. J.: Spec. Top., 2013, 222, 2835–2853 CrossRef.
- N. Huang, J. Tao, J. Liu, S. Wei, L. Li and Z. Wu, Soft Matter, 2014, 10, 4236–4240 RSC.
- Y.-Y. Wu, Z.-L. Zhang, J.-S. Zhang, X.-L. Zhu and Z.-J. Tan, Nucleic Acids Res., 2015, 43, 6156–6165 CrossRef CAS PubMed.
- C. A. Silvera-Batista, R. G. Larson and N. A. Kotov, Science, 2015, 350, 1242477 CrossRef PubMed.
- N. Huang, J. Tao, S. Wei, M. Chen, C. Wei and L. Li, J. Chem. Phys., 2015, 143, 114901 CrossRef PubMed.
- R. Roa, D. Menne, J. Riest, P. Buzatu, E. K. Zholkovskiy, J. K. G. Dhont, M. Wessling and G. Nägele, Soft Matter, 2016, 12, 4638–4653 RSC.
- S. Wei, M. Chen, C. Wei, N. Huang and L. Li, Soft Matter, 2016, 12, 6285–6292 RSC.
- S. D. Finlayson and P. Bartlett, J. Chem. Phys., 2016, 145, 034905 CrossRef PubMed.
- G. Trefalt, I. Szilagyi, G. Téllez and M. Borkovec, Langmuir, 2017, 33, 1695–1704 CrossRef CAS PubMed.
- G. Bareigts and C. Labbez, Phys. Chem. Chem. Phys., 2017, 19, 4787–4792 RSC.
- S. Ortelli, A. L. Costa, M. Blosi, A. Brunelli, E. Badetti, A. Bonetto, D. Hristozov and A. Marcomini, Environ. Sci.: Nano, 2017, 4, 1264–1272 RSC.
- P. Rouster, M. Pavlovic and I. Szilagyi, J. Phys. Chem. B, 2017, 121, 6749–6758 CrossRef CAS PubMed.
- J. Vatamanu and D. Bedrov, J. Phys. Chem. Lett., 2015, 6, 3594–3609 CrossRef CAS PubMed.
- M. Burgess, J. S. Moore and J. Rodríguez-López, Acc. Chem. Res., 2016, 49, 2649–2657 CrossRef CAS PubMed.
- F. Reymond, D. Fermín, H. J. Lee and H. H. Girault, Electrochim. Acta, 2000, 45, 2647–2662 CrossRef CAS.
-
D. F. Evans and H. Wennerström, The Colloidal Domain: Where Physics, Chemistry, Biology, and Technology Meet, Wiley-VCH, New York, USA, 2nd edn, 1999 Search PubMed.
-
W. Schmickler and E. Santos, Interfacial Electrochemistry, Springer-Verlag, Berlin, Germany, 2010 Search PubMed.
- C. W. Outhwaite and L. B. Bhuiyan, J. Chem. Soc., Faraday Trans. 2, 1983, 79, 707–718 RSC.
- R. Andreu, M. Molero, J. J. Calvente, C. W. Outhwaite and L. B. Bhuiyan, Electrochim. Acta, 1996, 41, 2125–2130 CrossRef CAS.
- L. B. Bhuiyan and C. W. Outhwaite, Phys. Chem. Chem. Phys., 2004, 6, 3467–3473 RSC.
- J. Reszko-Zygmunt, S. Sokołowski, D. Henderson and D. Boda, J. Chem. Phys., 2005, 122, 084504 CrossRef CAS PubMed.
- L. B. Bhuiyan, C. W. Outhwaite, D. Henderson and M. Alawneh, Mol. Phys., 2007, 105, 1395–1402 CrossRef CAS.
- S. Lamperski, C. W. Outhwaite and L. B. Bhuiyan, J. Phys. Chem. B, 2009, 113, 8925–8929 CrossRef CAS PubMed.
- D. F. Parsons and B. W. Ninham, Langmuir, 2010, 26, 6430–6436 CrossRef CAS PubMed.
- M. Quesada-Pérez, R. Hidalgo-Álvarez and A. Martín-Molina, Colloid Polym. Sci., 2010, 288, 151–158 Search PubMed.
- C. W. Outhwaite, S. Lamperski and L. B. Bhuiyan, Mol. Phys., 2011, 109, 21–26 CrossRef CAS.
- D. Henderson, S. Lamperski, Z. Jin and J. Wu, J. Phys. Chem. B, 2011, 115, 12911–12914 CrossRef CAS PubMed.
- E.-Y. Kim and S.-C. Kim, J. Chem. Phys., 2013, 139, 194711 CrossRef PubMed.
- E.-Y. Kim and S.-C. Kim, J. Chem. Phys., 2014, 140, 154703 CrossRef.
- B. Medasani, Z. Ovanesyan, D. G. Thomas, M. L. Sushko and M. Marucho, J. Chem. Phys., 2014, 140, 204510 CrossRef PubMed.
- C. N. Patra, RSC Adv., 2015, 5, 25006–25013 RSC.
- G. M. Giambasu, M. K. Gebala, M. T. Panteva, T. Luchko, D. A. Case and D. M. York, Nucleic Acids Res., 2015, 43, 8405–8415 CrossRef CAS PubMed.
- C. N. Patra, J. Chem. Eng. Data, 2015, 60, 3319–3326 CrossRef CAS.
- E.-Y. Kim, S.-C. Kim, Y.-S. Han and B.-S. Seong, Mol. Phys., 2015, 113, 871–879 CrossRef CAS.
- C. N. Patra, Mol. Phys., 2015, 114, 2341–2350 CrossRef.
- A. P. dos Santos and Y. Levin, J. Chem. Phys., 2015, 142, 194104 CrossRef PubMed.
- M. Ghodrat, A. Naji, H. Komaie-Moghaddam and R. Podgornik, J. Chem. Phys., 2015, 143, 234701 CrossRef PubMed.
- Z.-Y. Wang, Phys. Rev. E, 2016, 93, 012605 CrossRef PubMed.
- Z.-Y. Wang, J. Stat. Mech.: Theory Exp., 2016, 2016, 043205 CrossRef.
- M. L. Sushko, D. G. Thomas, S. A. Pabit, L. Pollack, A. V. Onufriev and N. A. Baker, Biophys. J., 2016, 110, 315–326 CrossRef CAS PubMed.
- A. P. dos Santos, M. Girotto and Y. Levin, J. Phys. Chem., 2016, 120, 10387–10393 CrossRef CAS PubMed.
- S. Jang, G. R. Shin and S.-C. Kim, Mol. Phys., 2017, 115, 2411–2422 CrossRef CAS.
- C. Hunley and M. Marucho, Phys. Chem. Chem. Phys., 2017, 19, 5396 RSC.
- S. Jang, G. R. Shin and S.-C. Kim, J. Mol. Liq., 2017, 237, 282–288 CrossRef CAS.
- M. Girotto, A. P. dos Santos and Y. Levin, J. Chem. Phys., 2017, 147, 074109 CrossRef PubMed.
- L. B. Bhuiyan and C. W. Outhwaite, Condens. Matter Phys., 2017, 20, 33801 CrossRef.
- Chandra N. Patra, Chem. Phys. Lett., 2017, 685, 470–476 CrossRef CAS.
- Y. Lia, M. Girard, M. Shen, J. A. Millan and M. Olvera de la Cruz, Proc. Natl. Acad. Sci. U. S. A., 2017, 114, 11838–11843 CrossRef PubMed.
- V. Kralj-Iglič and A. Iglič, J. Phys. II, 1996, 6, 477–491 CrossRef.
- A. K. Mukherjee, K. S. Schmitz and L. B. Bhuiyan, Langmuir, 2002, 18, 4210–4421 CrossRef CAS.
- J. M. Roberts, J. J. O'Dea and J. G. Osteryoung, Anal. Chem., 1998, 70, 3667–3673 CrossRef CAS PubMed.
- S. Alexander, P. M. Chaikin, P. Grant, G. J. Morales and P. Pincus, J. Chem. Phys., 1984, 80, 5776 CrossRef CAS.
- G. I. Guerrero-García, P. González-Mozuelos and M. Olvera de la Cruz, ACS Nano, 2013, 7, 9714–9723 CrossRef PubMed.
- E. González-Tovar, F. Jiménez-Ángeles, R. Messina and M. Lozada-Cassou, J. Chem. Phys., 2004, 120, 9782 CrossRef PubMed.
- D. J. Bradwell, H. Kim, A. H. Sirk and D. R. Sadoway, J. Am. Chem. Soc., 2012, 134, 1895–1897 CrossRef CAS PubMed.
- K. Fukasawa, A. Uehara, T. Nagai, N. Sato, T. Fujii and H. Yamana, J. Nucl. Mater., 2012, 424, 17–22 CrossRef CAS.
- M. M. Waldrop, Nature, 2012, 492, 26–29 CrossRef CAS PubMed.
-
D. A. McQuarrie, Statistical Mechanics, University Science Books, Mill Valley, USA, 2000 Search PubMed.
- S. Lamperski and A. Zydor, Electrochim. Acta, 2007, 52, 2429–2436 CrossRef CAS.
- G. M. Torrie and J. P. Valleau, J. Chem. Phys., 1980, 73, 5807–5816 CrossRef CAS.
- J. Kłos and S. Lamperski, J. Chem. Phys., 2014, 140, 054703 CrossRef PubMed.
- G. I. Guerrero-García and M. Olvera de la Cruz, J. Chem. Theory Comput., 2013, 9, 1–7 CrossRef PubMed.
- G. I. Guerrero-García, Y. Jing and M. Olvera de la Cruz, Soft Matter, 2013, 9, 6046–6052 RSC.
- G. I. Guerrero-García, F. J. Solis, K. Raidongia, A. R. Koltonow, J. Huang and M. Olvera de la Cruz, ACS Cent. Sci., 2016, 2, 857–866 CrossRef PubMed.
- L. Blum, Mol. Phys., 1975, 30, 1529–1535 CrossRef CAS.
- K. Hiroike, Mol. Phys., 1977, 33, 1195–1198 CrossRef CAS.
- S. L. Carnie, D. Y. C. Chan, D. J. Mitchell and B. W. Ninham, J. Chem. Phys., 1981, 74, 1472 CrossRef CAS.
- E. González-Tovar and M. Lozada-Cassou, J. Phys. Chem., 1989, 93, 3761–3768 CrossRef.
- G. I. Guerrero-García, E. González-Tovar and M. Olvera de la Cruz, Soft Matter, 2010, 6, 2056–2065 RSC.
- G. I. Guerrero-García, E. González-Tovar and M. Chávez-Páez, Phys. Rev. E: Stat., Nonlinear, Soft Matter Phys., 2009, 80, 021501 CrossRef PubMed.
- G. I. Guerrero-García, E. González-Tovar and M. Olvera de la Cruz, J. Chem. Phys., 2011, 135, 054701 CrossRef PubMed.
- G. I. Guerrero-García, E. González-Tovar, M. Quesada-Pérez and A. Martín-Molina, Phys. Chem. Chem. Phys., 2016, 18, 21852–21864 RSC.
-
J. Lyklema, Fundamentals of Interface and Colloid Science, Academic Press, San Diego, USA, 1995, vol. II Search PubMed.
- D. A. Sverjensky, Geochim. Cosmochim. Acta, 2001, 65, 3643 CrossRef CAS.
- M. A. Brown, Z. Abbas, A. Kleibert, R. G. Green, A. Goel, S. May and T. M. Squires, Phys. Rev. X, 2016, 6, 011007 Search PubMed.
Footnote |
| † Electronic supplementary information (ESI) available. See DOI: 10.1039/c7cp05433e |
|
| This journal is © the Owner Societies 2018 |
Click here to see how this site uses Cookies. View our privacy policy here.  *a,
Enrique
González-Tovar
b,
Martín
Chávez-Páez
b,
Jacek
Kłos
c and
Stanisław
Lamperski
c

 is the net volume charge density of the electrolyte at a distance r measured from the macroion's center, ρj(r) is the local number of ions per unit volume of valence zj, ε is the dielectric constant of the solvent, ε0 is the vacuum permittivity, and e is the proton charge. Defining

![[thin space (1/6-em)]](https://www.rsc.org/images/entities/char_2009.gif) exp−Wi(x)/kBT,
exp−Wi(x)/kBT,


 and Cdiff = Cint, which occurs precisely in the linearized Poisson–Boltzmann theory. Such an approximation is valid only in the limit of very dilute electrolytes with low electrostatic coupling and in the presence of very weakly charged colloids or electrodes.


![[r with combining right harpoon above (vector)]](https://www.rsc.org/images/entities/i_char_0072_20d1.gif) −
− ![[t with combining right harpoon above (vector)]](https://www.rsc.org/images/entities/i_char_0074_20d1.gif) |) are approximated by the analytical mean spherical approximation (MSA) expressions for a bulk electrolyte at a concentration ρk.65,66 The planar limit of the HNC/MSA integral equations was obtained by Carnie et al.67 in a study of the electrical double layer of equally-sized ions next to an infinite and impenetrable charged wall. The detailed derivation of these equations for the planar instance is given in the ESI.† The final equations are the following:
|) are approximated by the analytical mean spherical approximation (MSA) expressions for a bulk electrolyte at a concentration ρk.65,66 The planar limit of the HNC/MSA integral equations was obtained by Carnie et al.67 in a study of the electrical double layer of equally-sized ions next to an infinite and impenetrable charged wall. The detailed derivation of these equations for the planar instance is given in the ESI.† The final equations are the following:
 , ψ0 = ψ(x = 0), and i,j = −, +, where
 , and A(x) = 0 if
  ;
;


![[thin space (1/6-em)]](https://www.rsc.org/images/entities/char_2009.gif) :
:![[thin space (1/6-em)]](https://www.rsc.org/images/entities/char_2009.gif) 1 molten salt near a planar charged electrode.61 In this system, anions are divalent, z− = −2, cations are monovalent, z+ = +1, and both ionic species have a diameter a = 4 Å. Notice that the molar concentration of cations is twice the molar concentration of anions due to the electroneutrality condition of the bulk solution. The dielectric constant and temperature of the molten salt are 10, and 2800 K, respectively.61 The valences, the ionic size, and the dielectric permittivity and temperature of the molten salt are kept constant hereinafter.
1 molten salt near a planar charged electrode.61 In this system, anions are divalent, z− = −2, cations are monovalent, z+ = +1, and both ionic species have a diameter a = 4 Å. Notice that the molar concentration of cations is twice the molar concentration of anions due to the electroneutrality condition of the bulk solution. The dielectric constant and temperature of the molten salt are 10, and 2800 K, respectively.61 The valences, the ionic size, and the dielectric permittivity and temperature of the molten salt are kept constant hereinafter.


![[thin space (1/6-em)]](https://www.rsc.org/images/entities/char_2009.gif) :
:![[thin space (1/6-em)]](https://www.rsc.org/images/entities/char_2009.gif) 1 primitive model molten salt as a function of its molar concentration and the electrode's charge. The behaviour of τc obtained via integral equations and Monte Carlo simulations is displayed in Fig. 6. In this figure, a maximum value of the capacitive compactness is observed at a slightly negative surface charge density of the electrode (near the point of zero charge) for the lowest concentration of the molten salt. When the magnitude of the electrode's surface charge density increases, both theory and simulation display a monotonic decrease of the capacitive compactness. This suggests that, at low molar concentrations, the electrical double layer becomes more compact or shrinks as a function of the electrode's charge regardless of the valence of the counterions. The largest drop occurs when counterions are divalent (σ0 > 0). If the concentration of the molten salt increases, the theoretical predictions deteriorate but a qualitative agreement between simulation and theory can still be observed. The magnitude of the maximum capacitive compactness displayed at the lowest concentration of the molten salt decreases when the salt concentration increases. Eventually such a maximum disappears, and the capacitive compactness increases as a function of the magnitude of the electrode's charge when counterions are monovalent (σ0 < 0). In the case of divalent counterions at high concentrations, it is observed that the capacitive compactness decreases near the point of zero charge, reaching a slow varying plateau as a function of the positive surface charge density of the electrode. The above behaviour suggests that, at very high ionic concentrations, the ionic cloud swells or expands in the presence of monovalent counterions when the magnitude of the charge on the electrode augments, whereas the extension of the ionic cloud in the presence of divalent counterions contracts, reaching a limiting value, when the charge on the electrode increases. This rich behaviour of the capacitive compactness τc contrasts with the constant extension of the electrical double layer predicted by the linearized Poisson–Boltzmann approach (indicated by the symbols plotted on the right vertical axis of Fig. 6).
1 primitive model molten salt as a function of its molar concentration and the electrode's charge. The behaviour of τc obtained via integral equations and Monte Carlo simulations is displayed in Fig. 6. In this figure, a maximum value of the capacitive compactness is observed at a slightly negative surface charge density of the electrode (near the point of zero charge) for the lowest concentration of the molten salt. When the magnitude of the electrode's surface charge density increases, both theory and simulation display a monotonic decrease of the capacitive compactness. This suggests that, at low molar concentrations, the electrical double layer becomes more compact or shrinks as a function of the electrode's charge regardless of the valence of the counterions. The largest drop occurs when counterions are divalent (σ0 > 0). If the concentration of the molten salt increases, the theoretical predictions deteriorate but a qualitative agreement between simulation and theory can still be observed. The magnitude of the maximum capacitive compactness displayed at the lowest concentration of the molten salt decreases when the salt concentration increases. Eventually such a maximum disappears, and the capacitive compactness increases as a function of the magnitude of the electrode's charge when counterions are monovalent (σ0 < 0). In the case of divalent counterions at high concentrations, it is observed that the capacitive compactness decreases near the point of zero charge, reaching a slow varying plateau as a function of the positive surface charge density of the electrode. The above behaviour suggests that, at very high ionic concentrations, the ionic cloud swells or expands in the presence of monovalent counterions when the magnitude of the charge on the electrode augments, whereas the extension of the ionic cloud in the presence of divalent counterions contracts, reaching a limiting value, when the charge on the electrode increases. This rich behaviour of the capacitive compactness τc contrasts with the constant extension of the electrical double layer predicted by the linearized Poisson–Boltzmann approach (indicated by the symbols plotted on the right vertical axis of Fig. 6).
 is proportional to the difference of ionic singlets g+(x) − g−(x). This last quantity is plotted in Fig. 9 under the same conditions used in Fig. 8. Let us define x′ as the closest distance to the electrode's surface at which the difference of the ionic singlets is zero, i.e., g+(x′) − g−(x′) = 0; and let us define x′′ as the distance at which the ionic singlet difference has its minimum value, that is, g+(x′′) − g−(x′′) < g+(x) − g−(x) for all x. In Fig. 9(a), it is observed that both distances, x′ and x′′, increase as a function of the magnitude of the electrode's charge density. This microscopic behaviour is consistent with the swelling of the electrical double layer displayed by the capacitive compactness in Fig. 6, and with the expansion of the integrated surface charge density observed in Fig. 8(a). The arrest, or absence of a significant shrinking or swelling of the electrical double layer when the magnitude of the electrode's charge augments, can be also observed in the presence of divalent counterions as a function of the ionic singlet difference in Fig. 9(b). In this figure, it is evident that the location of extrema and the crossings with zero of the ionic singlet differences remain approximately constant when the electrode's charge increases. As a result, the main effect of increasing the surface charge density of the electrode in the presence of divalent counterions at high salt concentrations is to augment the net ionic volume charge density locally in specific fixed regions without causing a noticeable change in the magnitude of τc. These observations are again consistent with the behaviour displayed by the capacitive compactness in Fig. 6, and with the microscopic picture described by the integrated surface charge density in Fig. 8(b).


