 Open Access Article
Creative Commons Attribution 3.0 Unported Licence
Dynamics of the O + H2+ → OH+ + H, OH + H+ proton and hydrogen atom transfer reactions on the two lowest potential energy surfaces†
Rodrigo
Martínez
 a,
Miguel
Paniagua
b,
Jordi
Mayneris-Perxachs‡
c,
Pablo
Gamallo
 c and
Miguel
González
 *c
*c
aDepartamento de Química, Universidad de La Rioja, C/Madre de Dios, 51, 26006 Logroño, Spain
bDepartamento de Química Física Aplicada, Universidad Autónoma de Madrid, C/Francisco Tomás y Valiente, 7, 28049 Cantoblanco, Spain
cDepartament de Química Física i IQTC, Universitat de Barcelona, C/Martí i Franquès 1, 08028 Barcelona, Spain. E-mail: miguel.gonzalez@ub.edu
First published on 9th January 2017
Abstract
The dynamics of the title reaction was studied using mainly the quasiclassical trajectory (QCT) method on the ground 12A′′ (OH+ channel) and first excited 12A′ (OH channel) potential energy surfaces (PESs) employing ab initio analytical representations of the PESs developed by us. Both PESs correspond to exoergic reactions, are barrierless and present a deep minimum along the minimum energy path (MEP). Some extra calculations (cross sections) were also performed with the time dependent quantum real wave packet method at the centrifugal sudden level (RWP-CS method). A broad set of properties as a function of collision energy (Ecol ≤ 0.5 eV) was considered using the QCT method: cross sections, average fractions of energy, product rovibrational distributions, two- and three-vector properties, and the microscopic mechanisms analyzing their influence on the dynamics. The proton transfer channel dominates the reactivity of the system and significant differences between the two reaction channels are found for the vibrational distributions and microscopic mechanisms. The results were interpreted according to the properties of the ground and excited PESs. Moreover, the QCT and RWP-CS cross sections are in rather good agreement for both reaction channels. We hope that this study will encourage the experimentalists to investigate the dynamics of this interesting but scarcely studied system, whose two lowest PESs include the ground and first excited electronic states of the H2O+ cation.
I. Introduction
The O(3P) + H2+ atom-molecular ion gas phase chemical reaction system has been studied very little, in spite of its interest from a fundamental point of view as, e.g., it leads to two different and important reaction products (OH+ + H, OH + H+). Moreover, the ground potential energy surface of this system (12A′′ PES) correlates with the electronic ground state of the water cation, H2O+(X2B1; C2v symmetry), and the first excited potential energy surface (12A′ PES) correlates with the first excited electronic state of that cation, HOH+(12Πu; D∞h symmetry); with both electronic states of H2O+ becoming degenerate in D∞h symmetry (see, e.g., ref. 1 and 2). Besides, the O(3P) + H2+ system is related to other interesting ionic systems as, e.g., the X(1S) + H2+ → XH+ + H (X = He, Ne, Ar)3,4 and O+(4S) + H2+ → OH+ + H5,6 reactions, from which a lot has been learned from the reaction dynamics perspective.Furthermore, although the H2O molecule and the related ionic species (O+, OH+, H2O+, H3O+, etc.) are important in Astrochemistry and it cannot be ruled out that the O(3P) + H2+ reaction might play some role in this context, it should be noted that once the H2+ molecular ion is formed it quickly reacts leading to H3+ (H2+ + H2 → H3+ + H); thus the main reaction involving the oxygen atom corresponds to O + H3+ → OH+ + H2, H2O+ + H.7,8
To the best of our knowledge the dynamics and kinetics of the O + H2+ reaction has been investigated only in two previous contributions1,2 and the most related studies probably correspond to an ab initio analysis of the H2O+ PESs in the C2v region,9 an ab initio analytical ground PES developed recently,10 and an experimental11 and a theoretical12 study on the H2O+ photodissociation. In ref. 1 analytical representations of the ground 12A′′ and first excited 12A′ PESs of O(3P) + H2+ were reported for the first time, and they were based on MRCI (multireference configuration interaction) ab initio calculations.
This system leads to proton transfer, OH+ + H, on the ground PES and to hydrogen atom transfer, OH + H+, on the first excited PES, with both reaction channels being exoergic and the two PESs being barrierless and presenting a deep minimum (H2O+(X2B1) and HOH+(12Πu), respectively),
| O(3P) + H2+ → OH+ + H ΔD0 = −2.44 eV,13 | (1) |
| O(3P) + H2+ → OH + H+ ΔD0 = −1.741 eV,13 | (2) |
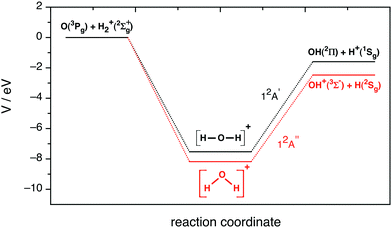 | ||
| Fig. 1 Schematic representation of the potential energy profile along the minimum energy path for the ground (12A′′ PES) and first excited (12A′ PES) potential energy surfaces. | ||
In ref. 1 the kinetics of the O + H2+ reaction was also investigated (T: 200–900 K) using the quasiclassical trajectory (QCT) method, and taking also into account the D2+ and HD+ isotope variants. Moreover, the O + H2+(v = 0, j = 0) QCT cross section was also reported for a small set of collision energies (Ecol) in the 0.010–0.50 eV interval. In ref. 2 a time dependent quantum dynamics study, using the real wave packet (RWP) method and taking into account the Coriolis coupling (CC), was performed on the cross sections and rate constants of the O + H2+ reaction, estimating also the influence of the Renner–Teller (RT) 12Πu (12A′′–12A′) nonadiabatic coupling on the reactivity of the system.
This paper is a continuation of the work reported in ref. 1 and is focused on the theoretical study of the O + H2+ reaction dynamics (cross sections, rovibrational distributions, two- and three-vector angular distributions, and microscopic mechanisms and their influence on the dynamics), taking into account the two possible reaction channels. The cross sections were also calculated using the time dependent real wave packet quantum method and the centrifugal sudden approximation (RWP-CS method). Both methods were applied on the ab initio ground and first excited PESs1 indicated above. The paper is organized as follows: Section II provides the computational details, Section III presents the results and discussion and Section IV gives the summary and conclusions. Moreover, some useful additional information is provided in the ESI.†
II. Computational methods
The analytical representations (many-body expansions)14,15 of the 12A′′ and 12A′ PESs used here were reported in ref. 1. They are based on grids of ab initio MRCI points (2698 and 2000, respectively), in which the standard correlation-consistent aug-cc-pVQZ basis set was used. Both PESs are exoergic and present a deep minimum along the MEP, as indicated previously. As in the case of ref. 1, we considered that reaction (1), proton transfer, and reaction (2), H atom transfer, take place adiabatically on the 12A′′ and 12A′ PESs, respectively.The spin–orbit couplings with the quartet PESs are expected to be of little relevance in these reactions as they only involve light atomic species. Regarding the influence of the Renner–Teller effect16 on the dynamics (nonadiabatic coupling of the 12A′′ and 12A′ PESs for collinear geometries), from the estimations of the quantum dynamics calculations of ref. 2 it comes out that the RT coupling mainly decreases the reactivity of the system on both PESs (Fig. 6 of ref. 2) and this is particularly evident for Ecol below 0.1 eV. The cross section for non-adiabatic H transfer when the system evolves initially on the 12A′′ PES is almost zero and similarly the cross section for non-adiabatic H+ transfer when the system evolves initially on the 12A′ PES is really small (Fig. 5 of ref. 2).
Here, we investigated the dynamics of reactions (1) and (2) using the QCT method in the standard way (see, e.g., ref. 17–19). Thus, the dynamic properties (cross sections, product state distributions, vector correlations and microscopic mechanisms) were studied as a function of collision energy within the interval 0.05 eV ≤ Ecol ≤ 0.50 eV and considering a selection of rovibrational levels of H2+.
Though the QCT method has approximate character it is a valuable theoretical approach for studying reaction dynamics if quantum effects are not significant; as it is expected to occur for the ‘ordinary’ reaction conditions examined, since both PESs are barrierless (in fact, a rather good comparison between the QCT and RWP-CS cross sections was obtained; cf. Section III).
As usual, the accuracy of the numerical integration of Hamilton's equations was checked by analyzing the conservation of total energy and total angular momentum for each calculated trajectory (an integration step size of 5.0 × 10⁻¹⁷ s was enough to fulfill these requirements). The trajectories were started at an initial separation of 15 Å between the O atom and the H2+ center of mass, thus ensuring that the interaction energy was negligible with respect to the available energy.
For each initial condition (Ecol = 0.05–0.50 eV, v = 0, j = 0) batches of 1.0 × 10⁵ trajectories were calculated on both PESs The statistical error (one standard deviation) of the cross sections was less than 0.15% for all conditions studied, whereas in the case of the product state distributions the standard deviation was maintained below 2%. Additional QCT calculations were also performed to investigate the influence of the rovibrational excitation of H2+ on the dynamics considering the following cases: Ecol = 0.05, 0.25 and 0.50 eV, v = 0, j = 2 and 4; Ecol = 0.05, 0.25 and 0.50 eV, v = 1, j = 0, 2 and 4.
Some calculations were also carried out (Ecol ≤ 0.50 eV, v = 0, j = 0) by means of the time dependent real wave packet quantum method,20 using the centrifugal sudden approximation,21 which has been applied to a wide range of reactions22 and is quite satisfactory for this2 and related systems,3,6 in order to compare the quantum and quasiclassical cross section results. Basically, the RWP-CS method propagates the real part of a wave packet under the action of an inverse cosine mapping of a shifted and scaled Hamiltonian operator, using the Chebyshev's iterations. We employ the usual, spinless, triatomic Hamiltonian operator, using atomic units, reactant Jacobi coordinates (R, r and γ), and a body-fixed reference frame whose z axis is along the quantization axis R.23
The state selected (v, j) reaction probabilities at fixed total angular momentum, PJv,j(Ecol), are calculated for a range of Ecol values from a single wave packet propagation by means of a flux method.24 The initial wave packet (eqn (3)) is of Gaussian type and contains a range of momenta or collision energies,
| g0(R) = π−1/4α−1/2e−(R−R0)2/2α2e−i(2μRE0)1/2(R−R0). | (3) |
The state selected reaction probabilities can be determined from a time-energy Fourier transform of a time dependent flux quantity inferred from the wave packet, and normalizing the result to the asymptotic distribution of the initial collision energies.24 More technical details are given, e.g., in ref. 25.
The features of the initial wave packet, the grid and other parameters employed in the RWP-CS calculations, were derived from a large number of test calculations, and they are given in Table 1. The reaction cross sections, σv,j(Ecol), are calculated as shown in eqn (4) using the reaction probabilities obtained for all J values in the range 0 ≤ J ≤ Jmax, where the Jmax values are equal to 90 and 70 for the 12A′′ and 12A′ PESs, respectively,
 | (4) |
| a Values in atomic units, unless otherwise specified. b Taking into account the symmetry (2 × 50). | |
|---|---|
| R range and number of grid points | 0–37 and 617 |
| r range and number of grid points | 0.5–18.5 and 208 |
| Number of associated Legendre functions and of γ points | 100b |
| R and r absorption start at | 32 and 13.5 |
| R and r absorption strength | 0.0005 |
| Flux analysis at r | 12.5 |
| Centre of initial wave packet (R0) | 30 |
| Width of the wave packet (α) | 0.30 |
| Mean relative translational energy/eV | 0.15 |
| Number of iterations | 50![[thin space (1/6-em)]](https://www.rsc.org/images/entities/char_2009.gif) 000 000 |
III. Results and discussion
Since the results obtained for the ground rovibrational state (v = 0, j = 0) of H2+ are quite similar to those obtained for the other selected states, here we will mainly refer to the former ones in order to present the results in a more compact form. The results (tables and figures) achieved for the other rovibrational states can be found in the ESI† and the most relevant aspects will be considered at the end of this section.A. Cross sections
The QCT and RWP-CS cross sections for both reactions with H2+(v = 0, j = 0), σ(12A′′) and σ(12A′), as a function of collision energy (up to 0.50 eV), are shown in Fig. 2. Here the cross section values are not multiplied by the electronic term (2/18) that must be applied to them in order to compare with the experimental results, when they become available.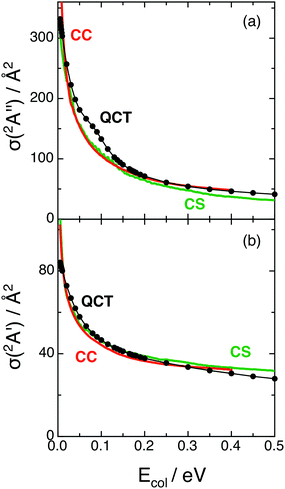 | ||
| Fig. 2 Cross sections for reactions (1) and (2) with H2+(v = 0, j = 0) as a function of collision energy (panels (a) and (b), respectively). QCT (black), RWP-CS (green) and RWP-CC (red)2 cross sections. | ||
Comparison of the QCT and RWP-CS cross sections shows a rather good agreement and suggests that quantum effects are not important under the reaction conditions explored, as expected due to the properties of the PESs.
Both the QCT and RWP-CS cross sections for reaction (1) strongly decrease with Ecol in the 0.05–0.15 eV range [Δσ(12A′′)/ΔEcol (QCT, RWP-CS) ≈ −9.41 × 10² Å2 eV−1, −7.26 × 10² Å2 eV−1]. In the case of reaction (2), the stronger decrease with Ecol is smoother and takes place in the 0.05–0.10 eV Ecol range [Δσ(12A′)/ΔEcol (QCT, RWP-CS) ≈ −2.24 × 10² Å2 eV−1, −1.60 × 10² Å2 eV−1]. At higher Ecol values the decrease becomes progressively less intense for both reactions.
At Ecol = 0.05 eV the cross section of reaction (1) is around three times the cross section of reaction (2) (3.1 and 2.9 for QCT and RWP-CS, respectively), and the σ(12A′′)/σ(12A′) ratio decreases with Ecol up to reaching values of 1.9 and 1.7 at 0.20 eV, and 1.5 and 1.0 at 0.50 eV, for the QCT and RWP-CS methods, respectively. Hence the proton transfer process occurs more easily than the hydrogen atom transfer. This probably arises from the more attractive character of the ground PES, which is also evident in the long range region.
The decrease observed for the cross sections as collision energy increases is expected for reactions with PESs without threshold energy (exoergic and barrierless PESs),26 as it happens for the 12A′′ and 12A′ surfaces. In these cases when Ecol increases is more difficult for the reactants to evolve into the products following the MEP. Moreover, the shapes of the σ(12A′′) and σ(12A′) vs. Ecol dependences mainly arise from the bmax2vs. Ecol dependences [σ(QCT) = πbmax2〈Pr〉, where bmax and 〈Pr〉 are the maximum impact parameter and average reaction probability for the selected reaction]. In fact, both bmax2 and 〈Pr〉 diminish with Ecol but the decrease is much less evident for the second property, which is not far from unity (0.8 ≤ 〈Pr〉 ≤ 1.0). The higher value of σ(12A′′) relative to σ(12A′) arises from the higher bmax values of the former due to the more attractive character of the 12A′′ PES.
B. Product state distributions
Fig. 3 shows the QCT average energy fractions [i.e., 〈fi′(12A′′)〉 and 〈fi′(12A′)〉, with i = V (vibration), R (rotation), and T (translation)] for the ground and excited PESs. In both cases the vibrational average energy fraction is slightly dependent on Ecol and corresponds to the main energy contribution, reaching larger values for the ground PES (〈fV′(12A′′)〉 = 0.50–0.53 and 〈fV′(12A′)〉 = 0.38–0.41). The translational and rotational average energy fractions are in general quite close to each other. For the 12A′′ PES both fractions are similar (〈fT′〉 = 0.23–0.26 and 〈fR′〉 = 0.24–0.25), while for the 12A′ PES the translational average energy fraction is somewhat larger than the rotational one (〈fT′〉 = 0.32–0.36 and 〈fR′〉 = 0.26–0.27). Hence, there is some more vibrational energy than translational + rotational energy in the products of the ground PES, while the opposite is true for the excited PES. Besides, about 74–77% and 64–68% of the available energy is released as internal energy of the product molecules in the ground and excited PESs, respectively.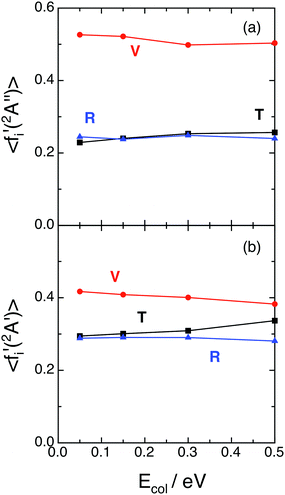 | ||
| Fig. 3 QCT average energy fractions for reactions (1) and (2) with H2+(v = 0, j = 0) as a function of collision energy (panels (a) and (b), respectively). Translation (black; T), vibration (red; V) and rotation (blue; R). | ||
Although there is no a general rule, it often happens that for exoergic and barrier-less (or with a small barrier) triatomic reactions there is an important fraction of the energy appearing as internal excitation of products (mostly as vibrational energy), at least for “soft” reaction conditions; and this can be found for different reaction kinematics and PESs shapes.18,19,27–29
A more detailed information on the energy distributions was obtained from the vibrational populations of the product molecules, P(v′). The QCT vibrational distributions arising from reactions (1) and (2) with H2+(v = 0, j = 0) at selected Ecol values [0.05, 0.15, 0.30 and 0.50 eV] are reported in Fig. 4. For reaction (1) the OH+(v′) vibrational distributions present population inversion for all the Ecol values explored. However, in strong contrast to this for reaction (2) the OH(v′) vibrational distributions are monotonically decreasing (i.e., the populations are non-inverted). In both cases the distributions are little dependent on Ecol and become slightly wider as Ecol increases.
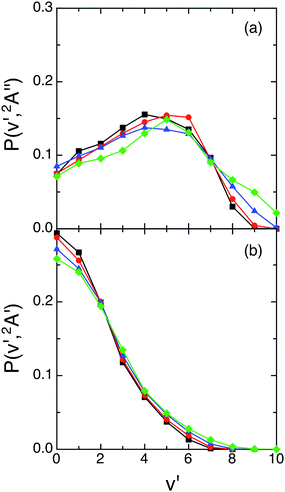 | ||
| Fig. 4 QCT products vibrational state distributions for OH+ (reaction (1)) and OH (reaction (2)), panels (a) and (b), respectively, at selected collision energies with H2+(v = 0, j = 0) [0.05 eV (black), 0.15 eV (red), 0.30 eV (blue) and 0.50 eV (green)]. | ||
The vibrational distributions obtained could be interpreted on the basis of the more attractive character of the ground PES (cf. equipotential contour plots of the 12A′′ and 12A′ PESs in ref. 1), its larger exoergicity [−2.48 eV (12A′′) vs. −1.61 eV (12A′)],1 and the smaller vibrational frequency of the corresponding diatomic product [OH+ (3116 cm−1) vs. OH (3696 cm−1)],1 although it is far from trivial to determine the weight of these factors in the resulting distributions. These aspects also help to understand that some more vibrational excitation is found for the ground PES.
The rotational distributions were also examined for both reactions (Fig. 5). The ground PES rotational distributions are hotter than the excited PES ones. Thus, e.g., for OH+(v′ = 0 and 5) the maximum of the distribution is located at j′ = 32 and 19 (Ecol = 0.05 eV) and at j′ = 31 and 26 (Ecol = 0.50 eV), respectively. For OH(v′ = 0 and 5) they are peaked at j′ = 22 and 7 (Ecol = 0.05 eV) and at j′ = 24 and 13 (Ecol = 0.50 eV), respectively. The shape of the distributions is similar for all Ecol, there is a bit more rotational excitation as Ecol increases and, for a given vibrational level v′, the maximum j′ value reached in the distribution decreases as v′ increases, as expected.
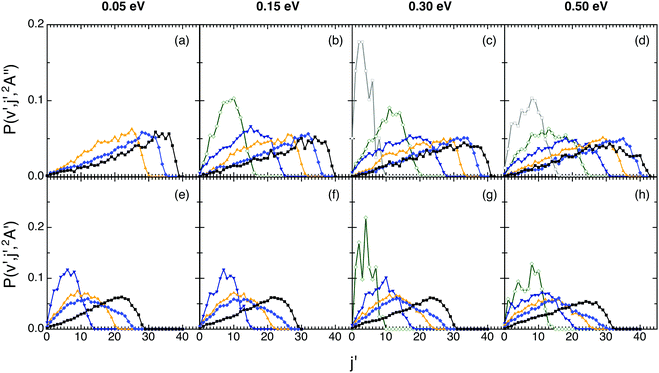 | ||
| Fig. 5 QCT products rotational state distributions for OH+ (reaction (1)) and OH (reaction (2)), panels (a)–(d) and (e)–(h), respectively, at selected collision energies with H2+(v = 0, j = 0) (0.05, 0.15, 0.30 and 0.50 eV). Black, blue, orange, navy, olive, and gray lines stand for the v′ = 0, 2, 4, 6, 8 and 10 states, respectively. | ||
Additional insight into the product state distributions is given below in the analysis of the influence of the microscopic reaction mechanism on the dynamics (Section III.D).
C. Two- and three-vector correlations
After completing the study of the scalar properties of the O + H2+ reactive system, the stereodynamics (vector properties) was also investigated taking into account the main vectors of the system. Thus, we have examined the two-vector angular distributions kk′, kj′, and k′j′, where k and k′ correspond to the initial and final relative velocity vectors, respectively, and j′ refers to the rotational angular momentum vector of OH+ or OH (reactions (1) and (2), respectively). The three-vector angular distribution kk′j′ has been also analyzed, where the kk′j′ dihedral angle corresponds to the angle that results from the plane defined by the k′ and j′ vectors with respect to the plane defined by k and k′. The kk′ angular distribution is given in terms of the differential cross section per unit of solid angle, d2σ/dΩ (DCS), employing its dimensionless form (2π/σ times the d2σ/dΩ value; relative DCS); while the kj′, k′j′, and kk′j′ angular distributions are given in terms of their corresponding probability density functions [P(kj′), P(k′j′), and P(kk′j′), respectively].18,30The kk′ angular distributions for the ground (top panels) and excited (bottom panels) PESs are given in Fig. 6, where it can be seen that they are similar and rather symmetric around kk′ = 90°. Reaction (1) shows a symmetric kk′ distribution at 0.05 eV, a slight tendency toward backward scattering at 0.15 and 0.30 eV, and a slight tendency toward forward scattering at the higher Ecol (0.50 eV). For reaction (2) the evolution of the kk′ distribution with Ecol displays a simpler behavior, as it is essentially symmetric at 0.05 eV and becomes progressively and slightly more forward as Ecol increases.
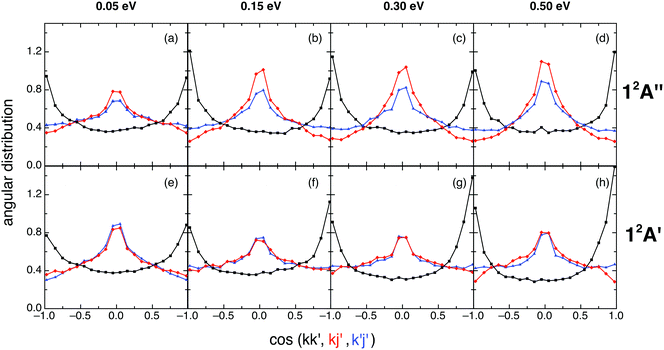 | ||
| Fig. 6 QCT products kk′ (black), kj′ (red) and k′j′ (blue) angular distributions for reactions (1) and (2) with H2+(v = 0, j = 0) (panels (a)–(d) and (e)–(h), respectively), at selected collision energies (0.05, 0.15, 0.30 and 0.50 eV). | ||
The 12A′′ forward/backward (f/b) scattering ratio, expressed in terms of the DCS(kk′: 0–90°)/DCS(kk′: 90–180°) ratio, is equal to 1.02, 0.87, 0.91 and 1.03 for Ecol = 0.05, 0.15, 0.30 and 0.50 eV, respectively, while the 12A′ f/b ratio takes the following values: 1.04, 1.17, 1.26 and 1.20, respectively.
The similar shape of the 12A′′ and 12A′ kk' angular distributions can be interpreted taking into account the similar shape of both PESs. Besides, the rather symmetric character of DCS(kk′) results from the deep minimum which is present in each PES that plays an important role in the dynamics (see Section III.D).
The kj′ angular distributions for reactions (1) and (2) are symmetric around kj′ = 90° (as they must be),18,30 exhibit a maximum at 90° and show a weak dependence with collision energy (especially for 0.15–0.50 eV; cf.Fig. 6). This trend towards a perpendicular arrangement of the k and j′ vectors (which is more evident for the ground PES at 0.15–0.50 eV) is stronger for those reactive processes following a direct reaction mode (cf. Section III.D), and results from the angular momentum vectors transformation from reactants to products (see below).
The k′j′ angular distributions for both reactions are also symmetric around 90° (as they should be),18,30 and are quite similar to the kj′ angular distributions, especially for the excited PES (Fig. 6). These results correlate with the dependence exhibited by the l′j′ angular distribution, where l′ is the orbital angular momentum vector of products. Although the l′j′ distribution cannot be determined experimentally, it is helpful in interpreting the k′j′ distribution results. In fact, the tendency of the system to show a parallel or anti-parallel l′j′ orientation in products leads to the tendency toward a perpendicular k′j′ orientation, which is stronger for the reactions evolving through a direct reaction mode, as in the case of kj′ (cf. Section III.D).
The kk′j′ angular distributions for both reactions show the existence of two maxima (at 90 and 270°) and are almost symmetric around 180° at Ecol = 0.05 eV (Fig. 7). This symmetry disappears at higher Ecol values, where the maximum at 90° is more intense than that at 270°. Hence, the rotational angular momentum vector of the diatomics (OH+ or OH) tends to rotate perpendicularly to the kk′ plane (scattering plane), which corresponds to the dihedral angles of 90° and 270°, with some preference for the former. Stronger peaks are found for those reactive processes occurring through a direct reaction mode (cf. Section III.D).
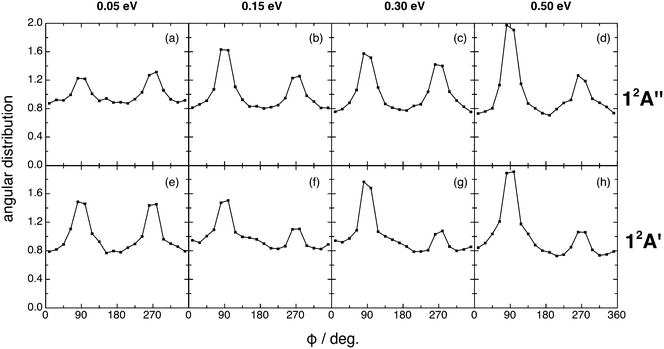 | ||
| Fig. 7 QCT products kk′j′ dihedral angle angular distribution for reactions (1) and (2) with H2+(v = 0, j = 0) (panels (a)–(d) and (e)–(h), respectively), at selected collision energies (0.05, 0.15, 0.30 and 0.50 eV). | ||
To interpret the vector properties it is often useful to examine how the total angular momentum of the system (J) is distributed between the rotational (j′) and orbital (l′) angular momenta of products (Table S3, ESI†). The modulus of j′ is larger than the modulus of l′, with the only exception of what happens for the excited PES at 0.05 eV. Moreover, while j′ has a tendency to be oriented parallel to J this is not the case of l′, which shows a trend to be perpendicular to J. The tendency of j′ to be parallel to J allow us to understand the maximum observed in the kj′ distribution at 90°. Regarding the angular distribution of j′ and l′, it can be seen that both vectors tend to be strongly perpendicular. Therefore, on the basis of this single result we can not necessarily conclude the existence of a maximum in the k′j′ angular distribution at 90°, as it is in fact observed.
Here it is also of interest to determine the allowed vector modules of the couple of vectors (l′,j′) for the average J value of O + H2+(v = 0, j = 0) at Ecol = 0.05, 0.15, 0.30 and 0.50 eV (average J values in units of ħ: 33.3, 41.2, 45.6 and 51.5, respectively (ground PES) and 18.4, 27.4, 35.7 and 43.3, respectively (excited PES)). A direct microscopic reaction mechanism would lead to a non-uniform distribution of (l′,j′) points, within the area allowed by the triangular inequality, while a highly complex (statistical) mechanism would lead to an uniform distribution. From Fig. S7 of the ESI† it comes out that rather uniform distributions are observed, which are more uniform as collision energy decreases. Besides, more uniform distributions are observed for the excited PES. These results suggest that both direct and complex microscopic reaction mechanisms are involved in the O + H2+ reaction.
This will be examined in detail in the following section where, in addition of identifying the different reaction modes involved, the effect of them on the scalar and vector dynamic properties is also analyzed.
D. Microscopic reaction mechanisms
The microscopic mechanism and its influence on the dynamics properties was investigated for reactions (1) and (2) at Ecol = 0.05, 0.15, and 0.50 eV, employing representative samples of reactive trajectories and analyzing the time evolution of the internuclear distances. The most important types of reactive trajectories observed are shown in Fig. 8.Reaction (1), which takes place on the 12A′′ ground PES, occurs according to three reaction modes (Fig. 8 and see also Movies 1–3 in the ESI†): (a) direct; (b) non-direct (short-lived collision complexes); (c) complex (long-lived collision complexes); and most of reactive trajectories lead to products evolving through geometries which are not far from that of the PES H2O+(X2B1) deep minimum. We have defined the three types of reactive trajectories on the basis of the lifetime (tcc) of the collision complex expressed in terms of the average rotational period of the collision complex at a given Ecol (〈τrot〉): (a) direct trajectories: 0 < tcc ≤ 0.1〈τrot〉; (b) non-direct trajectories: 0.1〈τrot〉 < tcc <〈τrot〉; (c) complex trajectories: tcc ≥ 〈τrot〉.
The direct reaction mode accounts for 5.2–21.1% of the total reactivity, i.e., the non-direct and complex reaction modes are clearly the most favored ones (33.9 and 17.7% non-direct at 0.05 and 0.50 eV, respectively, and 60.9 and 60.6% complex at 0.05 and 0.50 eV, respectively, cf.Table 2). The formation of long-lived collision complexes occurs with a higher probability in the case of reaction (1), probably due to the presence of the deepest minimum on the 12A′′ PES. For the long-lived collision complexes the average lifetimes are 0.25, 0.19 and 0.15 ps for Ecol = 0.05, 0.15, and 0.50 eV, respectively.
| PES 12A′′ | 0.05 eV | 0.15 eV | 0.50 eV |
|---|---|---|---|
| a 〈τrot〉 is the average rotational period of the collision complex; 〈tcc〉 is the average lifetime of the collision complex; 〈tllcc〉 is the average lifetime of the long-lived collision complex; 〈tslcc〉 is the average lifetime of the short-lived collision complex; llcc and slcc refer to the long- and short-lived collision complexes, respectively. | |||
| 〈τrot〉/ps | 0.073 | 0.049 | 0.034 |
| 〈tcc〉/ps | 0.16 | 0.14 | 0.093 |
| 〈tcc 〉/〈τrot〉 | 2.3 | 2.8 | 2.8 |
| 〈tllcc〉/ps | 0.25 | 0.19 | 0.15 |
| 〈tllcc 〉/〈τrot〉 | 3.4 | 4.0 | 4.4 |
| 〈tslcc〉/ps | 0.043 | 0.026 | 0.022 |
| 〈tslcc 〉/〈τrot〉 | 0.59 | 0.52 | 0.65 |
| % direct | 5.2 | 6.8 | 21.1 |
| % llcc | 60.9 | 67.7 | 60.6 |
| % slcc | 33.9 | 25.5 | 17.7 |
| PES 12A′ | 0.05 eV | 0.15 eV | 0.50 eV |
|---|---|---|---|
| 〈τrot〉/ps | 0.146 | 0.105 | 0.076 |
| 〈tcc〉/ps | 0.14 | 0.13 | 0.082 |
| 〈tcc〉/〈τrot〉 | 0.97 | 1.26 | 1.08 |
| 〈tllcc〉/ps | 0.33 | 0.26 | 0.20 |
| 〈tllcc〉/〈τrot〉 | 2.3 | 2.5 | 2.6 |
| 〈tslcc〉/ps | 0.069 | 0.059 | 0.045 |
| 〈tslcc〉/〈τrot〉 | 0.47 | 0.56 | 0.60 |
| % direct | 16.7 | 19.3 | 35.0 |
| % llcc | 31.8 | 41.1 | 35.6 |
| % slcc | 51.5 | 39.6 | 29.4 |
Analogous results as those for reaction (1) are obtained for reaction (2), which occurs on the 12A′ excited PES. It also takes place following a direct, non-direct and complex reaction modes, and the contributions of the second and third ones represent 29.4–51.5% and 31.8–41.1% of the total, respectively (Table 2). Thus, the direct mechanism has in general a lower contribution to reaction (2) (16.7–35.0%) than the other mechanisms, as it happens for reaction (1), even though its contribution to reactivity is larger than for reaction (1). Moreover, long-lived collision complexes of somewhat larger average lifetimes than those for the 12A′′ PES are found here (0.33, 0.26 and 0.20 ps for Ecol = 0.05, 0.15, and 0.50 eV, respectively). Of course, as the ground and excited PESs have a similar shape, with the HOH+(12Πu) deep minimum in the case of the excited PES, the microscopic reaction mechanisms on both surfaces are also expected to be similar.
Concerning the influence of the microscopic mechanism on the dynamics and in order to make things more evident regarding the influence of the complex mechanism, from now on we have been more restrictive and considered only the complex reactive trajectories with long-lived collision complexes satisfying tcc ≥ 5〈τrot〉.
Regardless of what happens at the lowest collision energy (0.05 eV), for the ground 12A′′ PES the direct mechanism leads to a degree of vibrational excitation somewhat higher (〈fV′〉 ≈ 0.6) than the complex mechanism (〈fV′〉 ≈ 0.5), although the results are similar (Fig. 9). For the excited 12A′ PES both mechanisms lead to results that are more similar to each other than in the case of the ground PES (Fig. 10). Both mechanisms lead to inverted vibrational populations for the 12A′′ PES and non-inverted ones (monotonically decreasing) for the 12A′ PES.
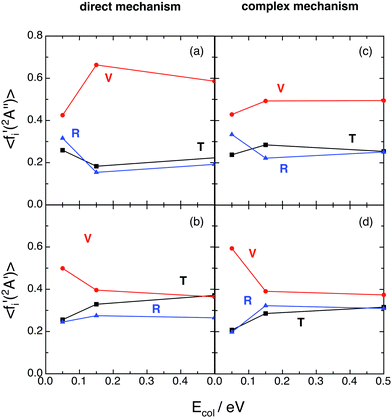 | ||
| Fig. 9 QCT average energy fractions for OH+ (reaction (1)) and OH (reaction (2)), as a function of collision energy with H2+(v = 0, j = 0) (panels (a) and (c) and panels (b) and (d), respectively), as a function of the microscopic mechanism. Translation (black; T), vibration (red; V), and rotation (blue; R). Please, note that to make more evident the influence of the microscopic mechanism, in the complex case we have only considered the reactive trajectories with long-lived collision complexes satisfying tcc ≥ 5〈τrot〉. | ||
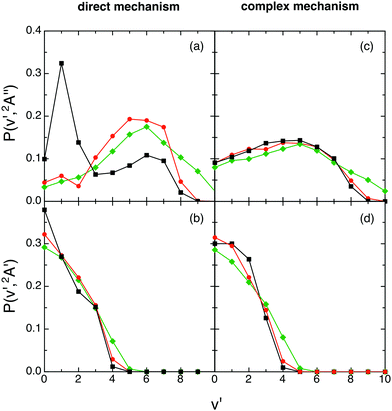 | ||
| Fig. 10 QCT products vibrational state distributions for OH+ (reaction (1)) and OH (reaction (2)), panels (a) and (c) and panels (b) and (d), respectively, at selected collision energies with H2+(v = 0, j = 0) as a function of the microscopic mechanism [0.05 eV (black), 0.15 eV (red) and 0.50 eV (green)]. The same comment on the complex mechanism given in Fig. 9 applies here. | ||
When the angular distributions of both PESs are considered, appreciable and expected differences in these properties are observed, depending on whether the results are for the direct mechanism or for the complex one, e.g., tendency towards “forward”/“backward” symmetry in the kk′ distribution for the complex mechanism (Fig. 11 and 12). For the direct mechanism the DCSs show preference for kk′ “forward” dispersion, while for the complex mechanism the DCSs are essentially symmetrical about 90°. Moreover, there is a decrease in the intensity of the maximum observed at 90° in the kj′ and k′j′ distributions when evolving from the direct to the complex mechanism.
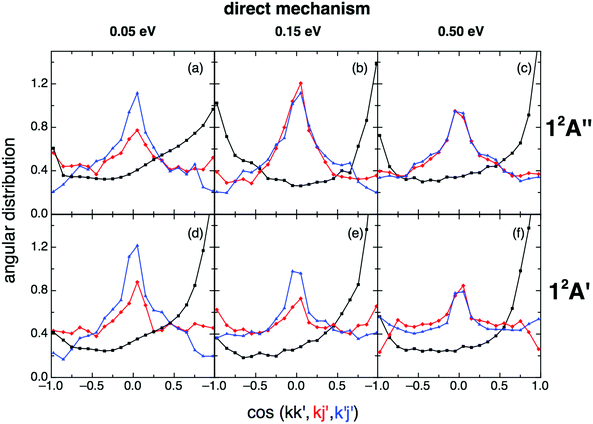 | ||
| Fig. 11 QCT products kk′ (black), kj′ (red) and k′j′ (blue) angular distributions for reactions (1) and (2) with H2+(v = 0,j = 0) panels (a)–(c) and (d)–(f), respectively), for the direct reaction mechanism at selected collision energies (0.05, 0.15 and 0.50 eV). | ||
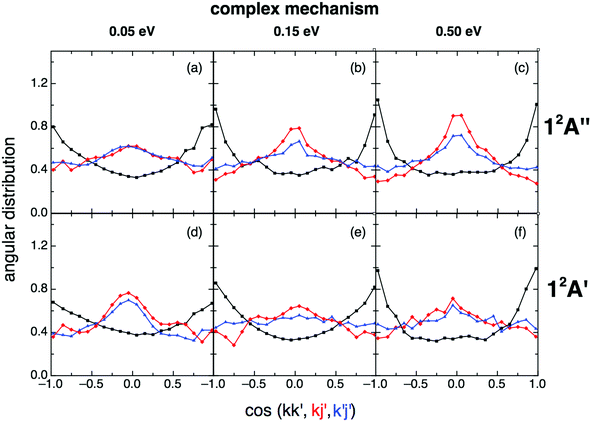 | ||
| Fig. 12 Same as Fig. 11 but for the complex reaction mechanism. The same comment on this mechanism given in Fig. 9 applies here. | ||
For the angular distribution of the kk′j′ dihedral angle there is a clear trend to evolve from distributions with maxima at 90° and 270° of remarkable intensity (direct mechanism) to significantly attenuated maxima (complex mechanism); Fig. 13 and 14. In particular this distribution is substantially isotropic for the complex mechanism at the lowest collision energy analyzed (0.05 eV). This isotropy is progressively lost as collision energy increases, and the intensities of the maxima are rather attenuated with respect to the direct case.
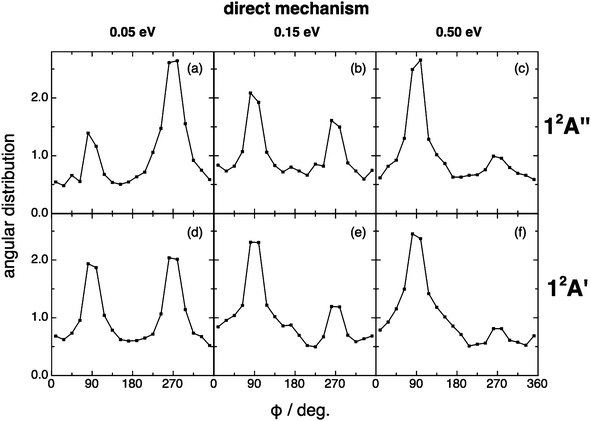 | ||
| Fig. 13 QCT products kk′j′ dihedral angle angular distribution for reactions (1) and (2) with H2+(v = 0, j = 0) (top and bottom panels, respectively), for the direct reaction mechanism at selected collision energies (0.05, 0.15 and 0.50 eV). | ||
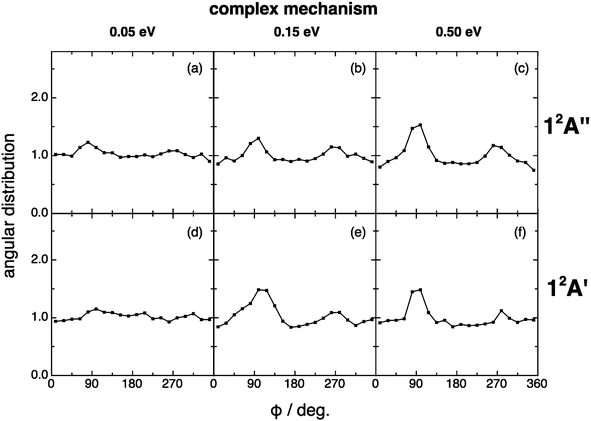 | ||
| Fig. 14 Same as Fig. 13 but for the complex reaction mechanism. The same comment on this mechanism given in Fig. 9 applies here. | ||
In summary, both reactions involve a rich dynamics (with the stronger differences occurring for the product vibrational distributions) resulting from the contributions of three microscopic reaction mechanisms, with the direct mechanism being at most responsible of 21 and 35% of the reactivity for the ground and excited PESs, respectively.
E. Influence of rovibrational excitation of H2+
The effect of vibrational and rotational excitation of H2+ was also explored and the results are presented in the ESI:† cross sections (Table S1), average energy fractions (Table S2), product vibrational and rotational distributions (Fig. S1 and S2, respectively) and angular distributions (Fig. S3–S6).The cross sections for H2+(v = 1, j) are very similar, although a bit smaller, than the cross sections for H2+(v = 0, j). The vibrational average energy fraction of reaction (1) increases somewhat with vibrational excitation of reactants (v = 1), while in the case of reaction (2) the situation is basically the same as for v = 0. The vibrational distributions tend to be a bit more excited with vibrational excitation of H2+. The rotational distributions tend to be a bit less excited with vibrational excitation of H2+. Vector properties are also similar (or very similar), with the angular distributions kj′, k′j′, and kk′j′ showing stronger peaks at 90°, 90°, and 90° and 270°, respectively, when the rovibrational state of H2+ changes from (v = 0, j = 0) to (v = 1, j = 0). Rotational excitation of H2+ shows in general a very small influence on the examined properties, leading to slightly more excited rotational distributions.
The influence of a moderate rovibrational excitation is small because of the barrierless character and exoergicity of the PESs, and taking into account the influence of the corresponding deep minimum in the dynamics (wide range of O–H2+ attack angles available for the reaction to occur).
IV. Summary and conclusions
We investigated the dynamics of the O + H2+ reaction, using mainly the QCT method and two ab initio analytical surfaces developed by our group for the ground (12A′′) and first excited (12A′) PESs. Two reaction channels are possible: O + H2+ → OH+ + H (1), H+ transfer (ground PES), and OH + H+(2), H transfer (first excited PES). Both PESs are exoergic and barrierless and have a deep minimum along the minimum energy reaction path.Scalar properties (cross sections, average fractions of energy, and product rovibrational distributions), vector properties (kk′, kj′, k′j′, and kk′j′ angular distributions), and the microscopic reaction mechanism were determined as a function of Ecol (0.05–0.50 eV) using the QCT method. Moreover, some additional calculations (cross sections) were also carried out by means of the time dependent RWP-CS quantum method.
The QCT and quantum cross sections are on the overall similar, the proton transfer reaction channel dominates the reactivity of the system, and the energy is mainly released as vibrational energy of the diatomic product molecule (OH+ and OH for reactions (1) and (2), respectively). Besides, significant differences are found between the two reaction channels for the vibrational distribution (vibrational inversion for the 12A′′ PES; reaction (1)) and it should also be noticed that a larger contribution of the direct reaction mode is observed for the 12A′ PES (reaction (2)). Vibrational (v = 1) and rotational (j = 2 and 4) excitation of H2+ leads to quite similar results as those for H2+(v = 0, j = 0). All results obtained here were understood on the basis of the PESs properties.
We expect that this study will encourage the experimentalists to carry out investigations on this interesting but rather surprisingly little studied system, whose two lowest PESs adiabatically correlate with the two lowest electronic states of H2O+.
Acknowledgements
This work was supported by the Spanish Ministry of Science and Innovation (MICINN projects CTQ2011-27857-C02-01 and CONSOLIDER INGENIO 2010 under grant no. CSD2009-00038 entitled “Molecular Astrophysics: the Herschel and Alma era”). Thanks are also given to the “Generalitat de Catalunya” (Autonomous Government of Catalonia; refs. 2009SGR 17, 2014SGR 25 and XRQTC) for some help.References
- M. Paniagua, R. Martínez, P. Gamallo and M. González, Phys. Chem. Chem. Phys., 2014, 16, 23594 RSC.
- P. Gamallo, P. Defazio, M. González, M. Paniagua and C. Petrongolo, Phys. Chem. Chem. Phys., 2015, 17, 23392 RSC.
- P. Gamallo, P. Defazio and M. González, J. Phys. Chem. A, 2011, 115, 11525 CrossRef CAS PubMed.
- P. Gamallo, F. Huarte-Larrañaga and M. González, J. Phys. Chem. A, 2013, 117, 5393 CrossRef CAS PubMed.
- R. Martínez, J. Millán and M. González, J. Chem. Phys., 2004, 120, 4705 CrossRef PubMed.
- R. Martínez, J. D. Sierra, S. K. Gray and M. González, J. Chem. Phys., 2006, 125, 164305 CrossRef PubMed.
- E. F. van Dishoeck, E. Herbst and D. A. Neufeld, Chem. Rev., 2013, 113, 9043 CrossRef CAS PubMed.
- A. Li and H. Guo, J. Phys. Chem. A, 2014, 118, 11168 CrossRef CAS PubMed.
- F. Schneider, F. Di Giacomo and F. A. Gianturco, J. Chem. Phys., 1996, 105, 7560 CrossRef CAS.
- M. A. Gannouni, N. E. Jaidane, P. Halvick, T. Stoecklin and M. Hochlaf, J. Chem. Phys., 2014, 140, 184306 CrossRef CAS PubMed.
- A. G. Sage, T. A. A. Oliver, R. N. Dixon and M. N. R. Ashfold, Mol. Phys., 2010, 108, 945 CrossRef CAS.
- J. Suárez, L. Méndez and I. Rabadán, J. Phys. Chem. Lett., 2015, 6, 72 CrossRef PubMed.
- K. P. Huber and G. Herzberg, Molecular Spectra and Molecular Structure. IV. Constants of Diatomic Molecules, Van Nostrand Reinhold, New York, 1979 Search PubMed.
- A. Aguado and M. Paniagua, J. Chem. Phys., 1992, 96, 1265 CrossRef CAS.
- A. Aguado, C. Tablero and M. Paniagua, Comput. Phys. Commun., 1998, 108, 259 CrossRef CAS.
- P. Defazio, P. Gamallo, M. González and C. Petrongolo, J. Phys. Chem. A, 2010, 114, 9749 CrossRef CAS PubMed.
- L. M. Raff and D. L. Thompson, in Theory of Chemical Reaction Dynamics, ed. M. Baer, CRC, Boca Raton, 1985, vol. 3, pp. 1–121 Search PubMed.
- P. Gamallo, R. Martínez, R. Sayós and M. González, J. Chem. Phys., 2010, 132, 144304 CrossRef PubMed.
- P. Gamallo, R. Francia, R. Martínez, R. Sayós and M. González, J. Phys. Chem. A, 2012, 116, 11783 CrossRef CAS PubMed.
- S. K. Gray and G. G. Balint-Kurti, J. Chem. Phys., 1998, 108, 950 CrossRef CAS.
- G. G. Balint-Kurti, Adv. Chem. Phys., 2004, 128, 249 Search PubMed and refs. therein.
- T. Chu, D. Liang, J. Xu and S. Dong, Int. J. Quantum Chem., 2015, 115, 803 CrossRef CAS.
- G. G. Balint-Kurti, in Lecture Notes in Chemistry, ed. A. Laganà and A. Riganelli, Springer, Berlin, 2000, vol. 75, pp. 74–87 Search PubMed.
- A. J. H. M. Meijer, E. M. Goldfield, S. K. Gray and G. G. Balint-Kurti, Chem. Phys. Lett., 1998, 293, 270 CrossRef CAS.
- J. Mayneris, R. Martínez, J. Hernando, S. K. Gray and M. González, J. Chem. Phys., 2008, 128, 144302 CrossRef PubMed.
- R. D. Levine and R. B. Bernstein, Molecular Reaction Dynamics and Chemical Reactivity, Oxford University Press, Oxford, 1987, pp. 58–61 Search PubMed.
- R. Sayós, J. Hernando, R. Francia and M. González, Phys. Chem. Chem. Phys., 2000, 2, 523 RSC.
- D. Troya, J. Millán, I. Baños and M. González, J. Chem. Phys., 2004, 120, 5181 CrossRef CAS PubMed.
- M. González, R. Valero and R. Sayós, J. Chem. Phys., 2000, 113, 10983 CrossRef.
- F. J. Aoiz, M. Brouard and P. A. Enríquez, J. Chem. Phys., 1996, 105, 4964 CrossRef CAS.
Footnotes |
| † Electronic supplementary information (ESI) available: QCT dynamic properties of O + H2+ → OH+ + H, OH + H+ arising from the ground and excited rovibrational states of H2+. Cross sections and related properties (Table S1). Average energy fractions (Table S2). Average properties of the J, l′ and j′ vectors for H2+(v = 0) (Table S3). Product vibrational and rotational distributions (Fig. S1 and S2, respectively). Angular distributions kk′, kj′, k′j′ and kk′j′ (Fig. S3–S6, respectively). Allowed vector modules of the couple (l′,j′) for H2+(v = 0) (Fig. S7). Examples of reactive trajectories (Movies 1–3). See DOI: 10.1039/c6cp08538e |
| ‡ Present address: CTNS, Technological Center of Nutrition and Health, Avda. Universitat, 1. 43204 Reus, Spain. |
| This journal is © the Owner Societies 2017 |

