 Open Access Article
Creative Commons Attribution 3.0 Unported Licence
Initial stages of CO2 adsorption on CaO: a combined experimental and computational study†
Brian H.
Solis‡
 a,
Yi
Cui‡§
b,
Xuefei
Weng
b,
Jan
Seifert
b,
Swetlana
Schauermann
bc,
Joachim
Sauer
*a,
Shamil
Shaikhutdinov
*b and
Hans-Joachim
Freund
b
aInstitut für Chemie, Humboldt-Universität zu Berlin, Unter den Linden 6, 10099 Berlin, Germany. E-mail: js@chemie.hu-berlin.de
bAbteilung Chemische Physik, Fritz-Haber-Institut der Max-Planck-Gesellschaft, Faradayweg 4-6, 14195 Berlin, Germany. E-mail: shaikhutdinov@fhi-berlin.mpg.de
cInstitut für Physikalische Chemie, Christian-Albrechts-Universität zu Kiel, Max-Eyth-Str. 2, 24118 Kiel, Germany
First published on 13th January 2017
Abstract
Room temperature adsorption of carbon dioxide (CO2) on monocrystalline CaO(001) thin films grown on a Mo(001) substrate was studied by infrared reflection–absorption spectroscopy (IRAS) and quantum chemical calculations. For comparison, CO2 adsorption was examined on poorly ordered, nanoparticulate CaO films prepared on Ru(0001). For both systems, CO2 readily adsorbs on the clean CaO surface. However, additional bands were observable on the CaO/Ru(0001) films compared with CaO/Mo(001), because the stricter IRAS surface selection rules do not apply to adsorption on the disordered thin films grown on Ru(0001). Spectral evolution with increasing exposure of the IRA bands suggested the presence of several adsorption sites which are consecutively populated by CO2. Density functional calculations showed that CO2 adsorption occurs as monodentate surface carbonate (CO32−) species at monatomic step sites and other low-coordinated sites, followed by formation of carbonates on terraces, which dominate at increasing CO2 exposure. To explain the coverage-dependent IRAS results, we propose CO2 surface islanding from the onset, most likely in the form of pairs and other chain-like species, which were calculated as thermodynamically favorable. The calculated adsorption energy for isolated CO2 on the terrace sites (184 ± 10 kJ mol−1) is larger than the adsorption energy obtained by temperature programmed desorption (∼120–140 kJ mol−1) and heat of adsorption taken from microcalorimetry measurements at low coverage (∼125 kJ mol−1). However, the calculated adsorption energies become less favorable when carbonate chains intersect on CaO terraces, forming kinks. Furthermore, our assignments of the initial stages of CO2 adsorption are consistent with the observed coverage effect on the CO2 adsorption energy measured by microcalorimetry and the IRAS results.
1. Introduction
The interaction of carbon dioxide (CO2) with oxide surfaces is important in a variety of industrial and environmental applications such as methanol synthesis, exhaust cleaning, and CO2 capturing.1–4 Among alkaline-earth oxides used in such processes, calcium oxide (CaO) often exhibits a higher activity due to a more delocalized electron distribution across surface oxygen atoms.5 Adsorption and reactivity studies on CaO were primarily performed on powders. It was demonstrated that CO2 adsorption capacities depend upon particle size and thus surface area.6,7 Complete adsorption resulted in formation of calcium carbonate (CaCO3). However, the reversibility of the carbonate formation falls off with increasing carbonation/calcination cycles, accompanied by rapid decay of CO2 adsorption.8 Therefore, many studies addressed the stability of CaO particulates, with the aim of improved catalyst regeneration.3,4,9 CaCO3 formation was found to occur in two kinetic regimes,6 whereby the initial reaction was fast and closely related to the partial pressure of CO2,10 and a slower second stage that was diffusion-controlled.11This early work raised great interest in understanding the initial stages of CO2 adsorption. In a pioneering infrared (IR) spectroscopy study,12 the formation of surface carbonate species (CO32−) was proposed as monodentate at room temperature, with the appearance of bidentate carbonates at higher temperatures. Substantial effort has been spent to understand the IR spectra employing computational quantum chemistry. Adopting successively larger cluster models, the formation of carbonates on the CaO(001) terrace has been predicted by Hartree–Fock (HF)13 and density functional theory (DFT).14,15 Embedding methods have been shown to be important for describing long range electrostatic interactions and surface polarization.16 Periodic DFT calculations yielded similar adsorption structures for CaO(001) terraces.17,18 Monodentate carbonates were also predicted to form on edge15 and step18 sites. Bidentate carbonates were only predicted to form on corner sites. Of the latter, pseudo-tridentate structures can also form, in which all three oxygen atoms of CO32− have elongated bonds to Ca2+ surface ions.
Experimental studies of CO2 adsorption on well-defined, single crystal surfaces of CaO are scarce. A synchrotron-based photoemission spectroscopy study of CO2 adsorption on vacuum-cleaved synthetic single crystal CaO(001) surfaces showed formation of a surface carbonate species at pressures above 10−6 Torr.19 However, traces of water were discovered in the ultrahigh vacuum (UHV) system, which partially hydroxylated the CaO(001) surface. Molecular beam scattering and temperature programmed desorption have been employed to study the adsorption kinetics of CO2 on a CaO(001) single crystal.5 The absence of a clear diffraction pattern indicated a large density of defects; these defects were assigned to oxygen vacancies, which were assumed to cause carbonate decomposition to CO. Few adsorption studies were performed on CaO thin films grown on Si(111)20 and Si(100) surfaces.21 In both cases, the resulting films were polycrystalline. The results obtained by various electron spectroscopy techniques suggested the formation of a closed CaCO3 top layer upon CO2 adsorption.9,11,19,21
Only recently, the preparation of well-ordered CaO(001) films has been reported using a Mo(001) single crystal as a substrate.22–24 Low-energy electron diffraction (LEED), Auger electron spectroscopy (AES), and scanning tunneling microscopy (STM) results showed that well-ordered closed films above 5 nm in nominal thickness with high quality and low defect concentration can be fabricated, with the band gap and optical properties being virtually identical to that reported for bulk CaO. However, depending on the film thickness and annealing temperature, a considerable diffusion of Mo ions from the support into the oxide film may occur that, in turn, alter the surface reactivity. As shown by high-resolution STM in combination with DFT calculations, the presence of Mo in the sub-surface region was responsible for the formation of superoxo O2− species and tip-induced oxygen dissociation.25 For CO2 on MgO(001), it has been shown that electron transfer from subsurface Mo can affect the preferred binding of CO2 as surface carboxylate rather than carbonate.26,27
In this combined experimental and theoretical study, we report on CO2 adsorption on well-characterized CaO thin films grown on metal substrates, focusing on the initial stages of adsorption in the low coverage regime. Using infrared reflection–absorption spectroscopy (IRAS), temperature programmed desorption (TPD), microcalorimetry, and quantum chemistry calculations, we show that CO2 strongly adsorbs as monodentate carbonates first on step edges, followed by terrace sites.
2. Experimental methods and results
2.1 Experimental methods
The experiments were carried out in three UHV chambers. The first chamber is equipped with LEED (Omicron), STM (Omicron), X-ray photoelectron spectroscopy (XPS) (Scienta 200 analyzer), and an IR spectrometer (Bruker IFS 66v) for the IRAS measurements. The Mo(001) and Ru(0001) crystals (both from MaTeck GmbH) were mounted on Omicron sample holders, with the temperature measured by a thermocouple spot-welded to the edge of the crystal. Clean metal surfaces were prepared by cycles of Ar+ sputtering and UHV annealing at high temperatures. Carbon contaminations were removed by mild annealing in oxygen followed by thermal flash in UHV to 1600 K. The cleanness of metal substrates was inspected by XPS prior to the film preparation. The crystalline CaO(001) films were grown on Mo(001) as described elsewhere.24 The same preparation was adopted for a Ru(0001) substrate. On both supports, Ca was deposited in 6 × 10⁻⁷ mbar O2 at 300 K, followed by UHV annealing at ∼1200 K for 5 min. The nominal film thickness (>5 nm) was determined by attenuation of the substrate signals in XPS.The IRA-spectra were recorded using p-polarized light at an 84° grazing angle of incidence (spectral resolution 4 cm−1). CO2 was dosed via back filling the chamber to 10−8 mbar and then pumped before the IRAS measurements. Dosage and measurements were performed at room temperature. CO2 exposures are given in Langmuirs (L), 1 L = 10−6 Torr s.
TPD spectra of CO2 on CaO(001)/Mo(001) films, prepared in the same way as described above, were measured in the second UHV chamber equipped with LEED, AES and quadrupole mass spectrometer (QMS). To minimize re-adsorption from the UHV background, CO2 was dosed on CaO(001) using the calibrated directional gas doser.
Finally, the microcalorimetry experiments were performed in the third UHV setup equipped with LEED, AES, QMS and a single-crystal adsorption calorimeter.28–30 CO2 was dosed using molecular beam to determine the sticking coefficient and CO2 coverage. Since a crystal substrate for such experiments must have a thickness of only several micrometers, in these studies the CaO(001) films were grown on Pt(001) using the same preparation conditions as used for Mo(001). More detailed characterization of the films on Pt(001) will be presented elsewhere. The resulted CaO(001) films showed good crystallinity as judged by LEED, and showed the same TPD features as those grown on Mo(001), both measured in the second chamber, for direct comparison.
2.2 Experimental results
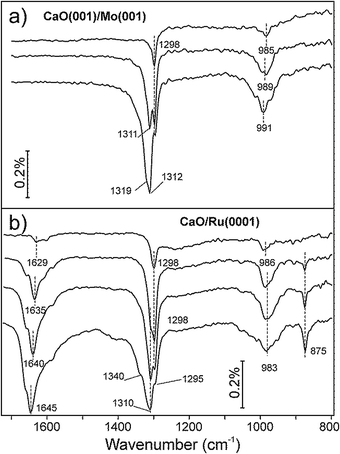
The typical morphology of well-ordered CaO(001) films grown on Mo(001) is shown in the STM image in Fig. 1a. The films annealed at 1200 K expose relatively wide terraces, although with considerable amounts of screw dislocations. In addition, few point-like defects may be observed on atomically flat terraces as depressions, of which some are outlined by circles in Fig. 1b. For comparison, Fig. 1c displays the STM image of the film prepared under similar conditions on a Ru(0001) substrate, where only poorly-defined nanoparticles are observed. Such a granular-like morphology may be explained by the epitaxial film growth on metal close-packed (111) surfaces that drives oxide layers to grow in the (111) orientation, which is thermodynamically unfavorable for oxides with the rock salt crystal structure like CaO. As a result, the Ru-supported films did not show any LEED pattern. Based on the XPS results (not shown here), the film stoichiometry on Ru(0001) is close to that observed for CaO(001) on Mo(001), although it might deviate at the surface of highly dispersed nanoparticles due to the abundance of low-coordinated atoms. However, for simplicity, we will use stoichiometric CaO notation for the films grown on Ru(0001).CO2 adsorption on the CaO films was monitored by IRAS at 300 K at increasing dosage (Fig. 2). Bearing in mind high sensitivity of CaO towards traces of water in the vacuum background, we note that no surface hydroxyls were detected in all IRA spectra discussed below. At the lowest exposure (∼0.1 L) of CO2 on CaO(001)/Mo(001), a sharp signal appears at 1298 cm−1 together with a broad band centered at ∼985 cm−1 (Fig. 2a, top). At increasing exposure, an additional peak emerges at 1311 cm−1. The latter peak gains intensity while a prominent shoulder appears at 1319 cm−1, which is more clearly observed upon spectral deconvolution (see below). The low frequency band (∼990 cm−1) considerably broadens, but qualitatively follows the evolution of the principal bands (or their envelope), slightly blue-shifting with increasing CO2 exposure.
For comparison, Fig. 2b collects IRA spectra recorded on a nanoparticulate CaO overlayer prepared on Ru(0001). In addition to the 1298 and 986 cm−1 bands, observed on a Mo(001)-supported film at the lowest exposure, a broad feature is observed in the 1630 cm−1 region, which gains considerable intensity with increasing CO2 exposure. Concomitantly, a sharp band develops at 875 cm−1. The intensities of these two additional bands do not correlate with the 1298 cm−1 band, but rather with the bands that appear at slightly higher frequencies.
Both the 875 and ∼1640 cm−1 bands are missing in the spectra of the CaO(001)/Mo(001) films (Fig. 2a). In principle, the observed differences might be due to CO2 adsorbing in different coordination (e.g., carbonates, carboxylates) on these two films. However, the similar bands (i.e. in the ∼1300 and ∼980 cm−1 regions) on both systems develop with increasing coverage almost identically. This suggests the adsorbed CO2 species on these surfaces are, in fact, very similar in nature. In addition, we conclude that the CO2 interaction with the CaO(001) films is not affected by the presence of Mo in the sub-surface region, if any.
The ∼1640, ∼1310, ∼980, and 875 cm−1 bands on the CaO/Ru(0001) films all gain intensity with increasing exposure, suggesting they also belong to the same species. The two unobserved bands on the CaO(001)/Mo(001) films, i.e. at ∼1640 and 875 cm−1, are likely absent due to the surface selection rules applied to IRAS on metal supported systems, which state that only vibrations with net dipole changes normal to the surface are detected. In contrast, CO2 ad-species on CaO nanoparticles may be present in random orientations with respect to the metal (Ru) substrate.
Focusing solely on the coverage dependent evolution of the bands in the ∼1300 cm−1 region on both systems, it appears that increasing CO2 coverage causes new peaks to emerge at higher frequencies. This observation contrasts with a single band exhibiting blue shifting, which would be expected in the case of increasing dipole–dipole interaction. The appearance of new high-frequency peaks is more clearly seen in the deconvoluted spectra presented in Fig. 3.
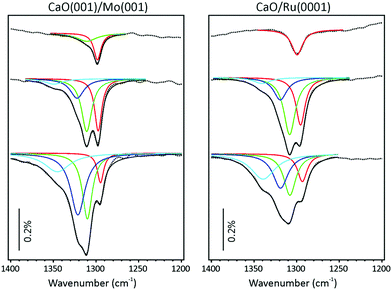 | ||
| Fig. 3 Spectral deconvolution of the IRA spectra shown in Fig. 2. Black dotted and solid lines show the experimental spectra and the deconvolution envelop, respectively. The same color code is used for both panels. | ||
We first address the spectral evolution observed on CaO(001)/Mo(001) (left panel in Fig. 3). At the lowest coverage, the signal at 1298 cm−1 dominates the spectrum. At increasing coverage, this band approximately doubles intensity, but then attenuates by a factor of two. Concomitantly, the band at 1310 cm−1 emerges and then stays fairly constant as if it saturates, while another band at 1322 cm−1 gains intensity. Finally, the new band at 1345 cm−1 appears at the highest coverage studied here. Such a spectral evolution can, in principle, be rationalized in terms of consecutive population of the spatially separated (isolated) adsorption sites.
Interestingly, the respective bands on a Ru-supported film (right panel in Fig. 3) are only slightly broader than on a monocrystalline Mo-supported film, which is consistent with the formation of isolated adsorbates. More surprising is that the intensities and positions of the bands, as well as the coverage dependence, are very similar on these two systems, despite the very different morphology of the films. This finding would indicate that the CO2 adsorption on CaO is structure insensitive. Alternatively, one may suggest that the film on Ru(0001) is composed of cuboid-shaped particles primarily exposing the (001) surface, and the IRAS intensities are strongly affected by orientation of adsorbed CO2 with respect to metal surface underneath the film.
In addition, Fig. 4 shows deconvoluted IRA-spectra of CO2 adsorbed on CaO(001)/Mo(001) at low temperature (∼110 K). This allows for the deconvolution of the ∼985 cm−1 band, thereby providing a correlation between the ∼1300 cm−1 and ∼985 cm−1 bands. At the lowest CO2 exposure, the ∼1300 cm−1 peak is the only prominent signal, regardless of temperature. At increasing coverage, the signal intensifies and does not attenuate. Additionally, new isolated peaks emerge at higher frequencies in a similar fashion to the room temperature results. The emergence of high-frequency signals at 1315 cm−1 and 1330 cm−1 occurs concomitantly with blue-shifted signals at 1005 cm−1 and 1030 cm−1, respectively. These results confirm our suspicion that unique adsorption structures are responsible for the growth of both observed IRA bands.
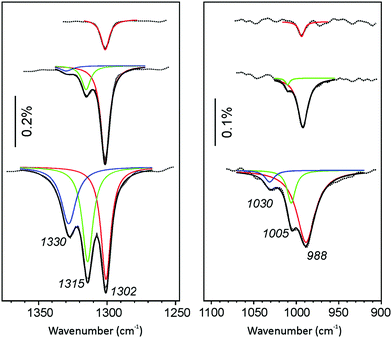 | ||
| Fig. 4 Deconvoluted IRA spectra of CaO(001)/Mo(001) films exposed to CO2 at increasing exposure from 0.1 L (top spectrum) to 1.1 L (bottom spectrum) at 110 K. The same color code is used as Fig. 3 for both panels. | ||
On the basis of the IRAS results presented above, we may conclude that CO2 readily adsorbs on the CaO surface in several structurally different adsorption sites. The site corresponding to the 1298 cm−1 band populates first, at both 300 and 110 K, implying that it exhibits the highest sticking coefficient. At increasing exposure, CO2 will adsorb in the next energetically favorable adsorption sites, giving rise to additional IRA bands at 1310 cm−1 and above.
Comparison of spectra on a well-ordered CaO(001) and nanoparticulate CaO films shows that newly adsorbed species are characterized by the bands at ∼1640, ∼1310, ∼980, and 875 cm−1. The two out of four bands (i.e. at 1640 and 875 cm−1) are not observable on Mo(001) supported films, possibly due to the surface selection rules applied to IRAS. According to the normal mode analysis of Fujita et al.31 and the correlation diagram of Davydov32 commonly used for the interpretation of IR spectra of CO2 adsorption, these two bands can be assigned to the ν(C–O) and π modes of monodentate carbonate species, designated ν6 and ν3, respectively, in Fig. 5. These modes have negligible nuclear displacements normal to the surface, consistent with the IRAS surface selection rules. The frequencies of the bending modes (ν1 and ν2) are close to the cut-off frequency of our setup and cannot be addressed experimentally. Therefore, only the ν4 and ν5 modes will be seen on the CaO(001)-oriented films. Among these two, the observed ν5 mode exhibits a higher intensity (Fig. 2a), suggesting a larger dipole moment change associated with this mode. Also, the frequencies reported in the literature for these modes are fairly consistent with those measured in our experiments.
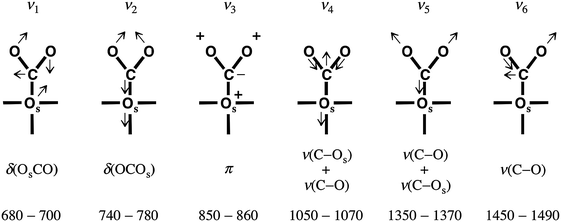 | ||
| Fig. 5 Vibrational and bending modes in monodentate carbonate. Os denotes the surface oxygen of the carbonate. The corresponding frequencies are labeled ν1–ν6, from left to right. The bottom line shows the experimental frequencies assigned to the respective modes on the basis of conventional IR spectroscopy measurements on powdered samples. Figure modified from Fig. 5 of ref. 33. | ||
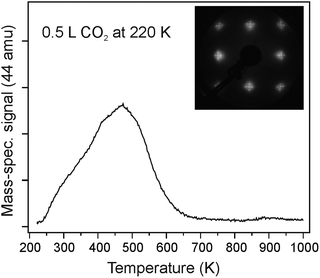
To obtain information about the CO2 adsorption energy, we performed TPD and microcalorimetry experiments on well-ordered CaO(001) films in other experimental setups using the same preparation conditions. Fig. 6 shows a typical desorption trace of CO2 (44 amu) recorded after adsorption of 0.5 L at 220 K on the CaO(001)/Mo(001) surface, with the LEED pattern shown in the inset. Note that at the lower exposures, the spectra scale in intensity with small deviations in maximum desorption temperature Tmax (not shown). The TPD spectra were reproducible (upon five consecutive TPD runs up to 1000 K), thus suggesting that CO2 desorbs intact. Applying the well-known Redhead formalism34 and using the pre-exponential factor 1013 s−1, Tmax = 470 K, and heating rate 3 K s−1, we calculated the desorption energy to be ∼120 kJ mol−1. With an increased pre-exponential of 1015 s−1, determined experimentally for physisorbed CO on MgO(001),35 this desorption energy increases to ∼140 kJ mol−1.
The CO2 adsorption enthalpy on the CaO(001) surface was directly measured by microcalorimetry. The measurement was combined with a sticking coefficient measurement using the King and Wells method,36 allowing for a quantitative determination of the absolute number of adsorbed CO2 molecules. The results for adsorption at 300 K are shown in Fig. 7. The heat of adsorption measured at the lowest CO2 coverage, ∼125 kJ mol−1, agrees well with the result from TPD. The adsorption enthalpy decreases with increasing coverage and levels off at high exposures.
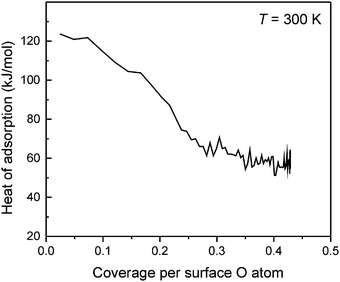 | ||
| Fig. 7 Differential adsorption enthalpy of CO2 on CaO(001)/Pt(001) measured at 300 K and plotted as a function of CO2 coverage. | ||
3. Computational methods and results
3.1 Computational models and methods
Neutral CanOn clusters were employed to model different morphological sites of CaO(001) for CO2 adsorption, using the previously used lattice parameter a = 483.2 pm.25 The periodic electrostatic embedded cluster method (PEECM)37 was employed in the DFT calculations using the computational package TURBOMOLE.38We considered three types of morphological sites: terraces, step-edges, and corners. These sites are represented by twelve clusters, shown in Fig. S1 (ESI†), which are labeled according to the morphological site they represent: T1, T2, T3, T4, and T5 (terrace); MS1 and MS2 (monatomic step); DS (diatomic step); E (edge); RC (reverse corner); and C1 and C2 (corner). The models were constructed such that Ca atoms comprise the outermost shell of the cluster. The presence of the much more polarizable oxygen anions in the outermost shell has to be avoided to minimize nonphysical polarization effects due to point charges in the immediate vicinity.37
Structure optimizations were carried out with the B3LYP39,40 and PBE41,42 functionals at a triple-ζ valence plus polarization (TZVP) basis set43 (“def2” in the TURBOMOLE library) for Ca, O, and C atoms, with additional Ca atoms containing all-electron effective core potentials (ECPs).44 The quadruple-ζ valence plus polarization (QZVP) basis set was used for basis set extrapolation. We performed MP2 and CCSD(T) calculations with the resolution of identity method, where the auxiliary TZVP and QZVP basis sets were taken from the TURBOMOLE library.45 Contributions to the B3LYP and PBE energies resulting from dispersion were calculated according to the procedure outlined by Grimme.46 The C6 and R0 dispersion parameters of Ca2+ were assigned to the isoelectric Ar atom, following earlier work that substituted Ne parameters for the Mg2+ ions in MgO.47
Periodic calculations were performed on terrace and monatomic step models with PBE using the Vienna ab initio simulation package (VASP).48,49 Additional details can be found in the ESI.†
Vibrational frequencies of adsorbed CO2 were calculated numerically in the harmonic approximation. B3LYP frequencies were scaled by a factor λ = 0.9800, the average of the ratios of observed anharmonic frequencies (fundamentals) and the calculated (TZVP basis set) harmonic frequencies for gas phase CO2 and CO2− (see Table S2, ESI†). PBE frequencies were not scaled because the calculated scale factors for CO2 and CO2− at the TZVP level are very close to unity. The global frequency scaling factors for B3LYP and PBE with a comparable 6-311+G(2df,p) basis set are λ = 0.9686 and λ = 0.9948, respectively.50 Intensities were calculated with the x- and y-directions (parallel to the surface) of the dipole gradient projected out, consistent with the surface selection rules for IRAS. Additional computational details can be found in Section S1 of the ESI.†
3.2 Computational results
| Model | Compositiona | B3LYP | B3LYP+Db | PBE | PBE+Db |
|---|---|---|---|---|---|
| a The subscript “pc” indicates the clusters are embedded in a 2D-periodic array of point charges extending six layers deep. Ca atoms in the outermost shell of the clusters are fixed at their lattice positions during structure optimizations, denoted “fix” for atoms described by basis functions and “ecp” for atoms described with ECPs. b DFT+D single point calculation at the DFT structure. c The surface carbonate is rotated 45° with respect to the surface lattice structure. See Section S2.1 of the ESI for details. | |||||
| T1 | {Ca5O14Cafix9Caecp16}pc | −151.9 | −171.5 | −155.0 | −169.2 |
| T2c | {Ca8O20Cafix12Caecp20}pc | −151.0 | −170.3 | −154.4 | −168.3 |
| T3 | {Ca10O26Cafix16Caecp25}pc | −145.7 | −165.5 | −148.3 | −162.6 |
| T4 | {Ca12O33Cafix21Caecp32}pc | −135.1 | −155.3 | — | — |
| T5 | {Ca12O38Cafix26Caecp32}pc | −134.6 | −154.8 | −136.1 | −150.6 |
| MS1 | {Ca4O11Cafix7Caecp13}pc | −287.1 | −306.1 | −279.0 | −293.7 |
| MS2 | {Ca9O22Cafix13Caecp21}pc | −276.0 | −295.2 | −267.5 | −283.0 |
| DS | {Ca4O10Cafix6Caecp11}pc | −244.7 | −257.0 | −236.0 | −244.8 |
| E | {Ca4O10Cafix6Caecp10}pc | −249.3 | −260.9 | −241.2 | −249.6 |
| RC | {Ca5O13Cafix8Caecp15}pc | −199.2 | −216.9 | −198.4 | −211.3 |
| C1 | {Ca3O7Cafix4Caecp6}pc | −254.3 | −264.6 | −252.4 | −259.7 |
| C2 | {Ca10O20Cafix10Caecp11}pc | −276.4 | −287.3 | — | — |
The adsorption energy calculated with the terrace models converge to about −155 and −151 kJ mol−1 with B3LYP+D and PBE+D, respectively, at very large cluster sizes. Similar convergence was achieved by using successively larger supercells in calculations with periodic boundary conditions, yielding −146 kJ mol−1 with PBE+D (see Table S12 of the ESI†).
To more accurately determine the adsorption energy of isolated CO2 on terraces, we performed single-point CCSD(T) calculations on a non-embedded 3 × 3 × 2 Ca9O9 cluster. Its structure was taken from the embedded T1 model optimized with B3LYP/TZVP. Subtracting the DFT+D adsorption energies of the Ca9O9 cluster from the CCSD(T) results extrapolated to the complete basis set limit gives a coupled cluster correction, ΔCCDFT+D, of −30.3 kJ mol−1 (B3LYP+D) and −31.9 kJ mol−1 (PBE+D). The final calculated coupled cluster-corrected adsorption energy is −185.1 kJ mol−1 for B3LYP+D and −182.5 kJ mol−1 for PBE+D, or −184 kJ mol−1 on average. Similar hybrid schemes51 have been used previously to accurately calculate adsorption energies of small molecules on oxide surfaces.47
To estimate the uncertainty of the coupled cluster corrections, we also calculated the adsorption energy of CO2 on the entire B3LYP-optimized T1 cluster at the TZVP level within the PEECM formalism, giving a ΔCCB3LYP+D/TZVP of −22.8 kJ mol−1. This differs by +10 kJ mol−1 from the corresponding value for the Ca9O9 cluster (−32.9 kJ mol−1, see Table S18 of the ESI†). The differences between CCSD(T) and B3LYP+D for the analogous gas-phase reaction CaO(g) + CO2(g) → CaCO3(g), −40.5 kJ mol−1 (see Table S19 of the ESI†), deviates by about −10 kJ mol−1. We therefore conclude that the uncertainty of our CCSD(T) correction, and hence of the final adsorption energy due to the applied methods, is ±10 kJ mol−1, whereas convergence has been achieved for type (periodic vs. embedded cluster) and size of the models. Therefore, our best estimate for the energy of adsorption of CO2 on terrace sites is 184 ± 10 kJ mol−1.
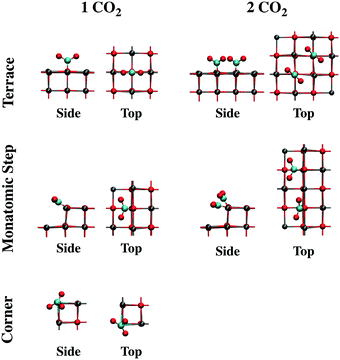
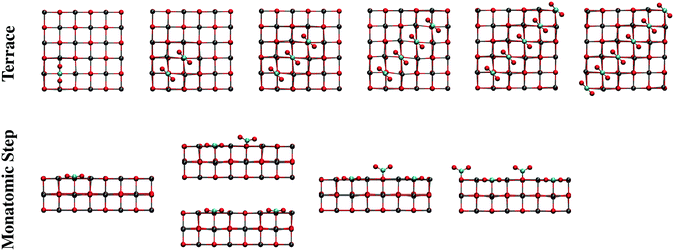
The effect of increasing the CO2 coverage was explored by optimizing the structure of two or more CO2 molecules on several CaO(001) morphological sites. On terrace sites, adsorption of CO2 in close proximity to a monodentate carbonate occurs at the nearest oxygen atom, causing both adsorbates to form a 45° torsional angle with respect to the surface lattice structure (see “Terrace 2 CO2” in Fig. 8 and the top of Fig. 9). This structure is similar to a previously calculated carbonate pair on CaO(001) with an interatomic potential model.52 The present calculations indicate that formation of such a pair is thermodynamically favorable. Subsequent CO2 molecules will add to the length of a carbonate chain stretching diagonally across the terrace surface, as shown in Fig. 9. Details are given in Section S2 of the ESI.†
Structural changes also occur when CO2 binds to step and edge sites in close proximity to other populated 4-coordinate sites. As shown in Fig. 8 (“Monatomic Step 2 CO2”) and the bottom of Fig. 9, adsorption of CO2 at the nearest neighbor oxygen atom on the rim of the step results in an asymmetric structure due to steric interactions of the terminal oxygen atoms. While the pre-adsorbed CO2 binds nearly in the plane of the missing surface layer, the adjacent CO2 more closely resembles a carbonate bound to a 5-coordainted site. On adsorption of the second CO2 molecule in the nearest neighbor position, 60 kJ mol−1 less energy is released compared to adsorption of isolated CO2 on a monatomic step site. Adsorption in the next nearest neighbor position, however, only incurred a 9 kJ mol−1 energy penalty, and results in a structure similar to that of an isolated CO2. CO2 binding in between two pre-adsorbed carbonates is ∼100 kJ mol−1 less favorable than in isolation. In spite of these energy penalties, adsorption of CO2 on steps is more favorable than on a clean terrace, even at the most crowded step adsorption site, by ∼10 kJ mol−1.
We calculated structures and energies for CO2 adsorption at 4- and 5-coordinated sites in proximity to CO2 pre-adsorbed to low-coordinated sites to study the interactions of adsorbates bound to different morphological sites. Adsorption on the rim (4-coordinated) nearest a pre-adsorbed corner site (3-coordianted) is predicted to be the most stable, with a similar adsorption energy to a clean edge site. Adsorption at a terrace site (5-coordinated) in proximity to filled 4-coordinated (steps and edges) and 3-coordinated (corner) sites were found to be the least favorable among the tested sites. Details on the adsorbate–adsorbate interactions can be found in Section S2 of the ESI.† In addition, a physisorbed paired structure was considered, owing to the stability of the (CO2)2− dimer in the gas phase.53 However, the physisorbed pair, although energetically stable, was calculated to be the least favorable, ∼140 kJ mol−1 less favorable than chemisorption on the clean terrace.
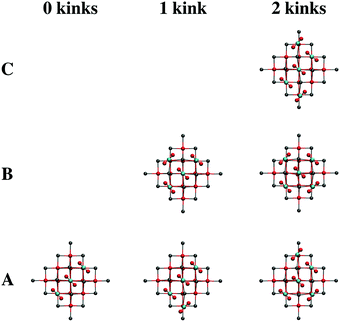
After the low-coordinated sites have become filled, adsorption at terraces commences. While the calculations suggest that infinite chains of surface carbonates will form diagonally across the CaO(001) terrace, we sought to calculate different terrace-adsorption structures to simulate kinks in such adsorption chains that are likely to occur upon room temperature adsorption. Such kinks also represent the interaction of two chains intersecting on the terrace surface. Due to the available terrace adsorption sites on T1, we only considered structural patterns up to a total of five carbonates. Optimized local minima for adsorption of three, four, and five CO2 molecules on cluster T1, which simulates 0, 1, and 2 kinks in the CO2 adsorption chains, are shown in Fig. 10. The relative energies of the local minimum structures are labeled with letters, “A” being the calculated global minimum, and subsequent letters denoting structures with higher energy. The presence of a single kink in the CO2 adsorption chain causes a decrease in adsorption strength of ∼13 kJ per mol per adsorbed CO2 as calculated with the T1 cluster; an additional ∼10 kJ per mol penalty per adsorbate is calculated for the presence of two kinks in the carbonate chain. However, due to the interaction of the adsorbates on the periphery of the cluster with the surrounding point charges, these calculated energy differences are likely exaggerated. See Section S2 of the ESI† for an analysis of computational artifacts due to CO2 cluster adsorption sites.
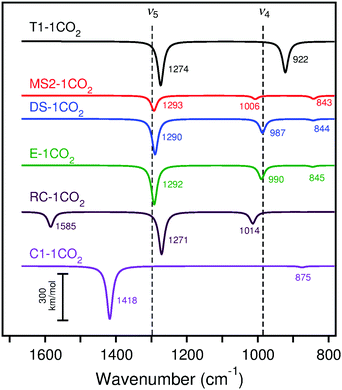 | ||
| Fig. 11 Calculated (scaled) IRA spectra of CO2 adsorption on cluster models T1, MS2, DS, E, RC, and C1 with B3LYP. The experimental peaks are indicated by dashed lines for the lowest CO2 exposure. Frequencies and intensities tabulated in Table S26 (ESI†). All calculated spectra are Lorentzian broadened. | ||
IRA spectra simulated with B3LYP for the adsorption of two CO2 molecules as surface carbonates on CaO(001) cluster models are shown in Fig. 12. On the terrace site, adsorption of CO2 at the nearest neighbor site to a pre-adsorbed species causes a 17 cm−1 blue shift in the ν5 peak and a 41 cm−1 blue shift in the ν4 peak. On the monatomic step site, CO2 adsorption at the nearest neighbor site to a pre-adsorbed species causes a red shift of 30 cm−1 in the ν4 peak with approximately six times increased IRA intensities for ν5 and ν4. The orientation of the adsorbed CO2, which does not lean toward the step surface layer as much as the pre-adsorbed species, results in dipole changes perpendicular to the surface and observation by IRAS more likely. The calculated frequencies of two CO2 molecules to the rim of the edge cluster model are similar to those on the monatomic step. On a corner site, the calculated IRA spectrum of adsorption of two CO2 molecules shows three peaks in the vicinity of ν5: one at ∼1300 cm−1 that is attributed to the CO2 binding on the nearby edge, and two additional peaks at ∼1390 and ∼1440 cm−1 that are attributed to the pre-adsorbed CO2 embedded into the corner. The appearance of a second ν5 peak due to the embedded CO2 is due to the broken symmetry caused by the additional nearby CO2 adsorbate. As with the isolated CO2 adsorption, calculated ν3 bands (∼836–879 cm−1 with B3LYP and ∼795–854 cm−1 with PBE) and ν6 bands (∼1577–1664 cm−1 with B3LYP and ∼1541–1655 cm−1 with PBE) can be compared to the experimental CaO/Ru(0001) spectra (see Section 4 for discussion and Tables S27 and S28 of the ESI† for data).
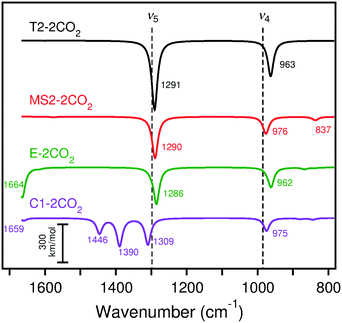 | ||
| Fig. 12 Calculated (scaled) IRA spectra of CO2 adsorption on cluster models T2, MS2, E, and C1 with B3LYP. The experimental peaks are indicated by dashed lines for the lowest CO2 exposure. Frequencies and intensities tabulated in Table S27 (ESI†). | ||
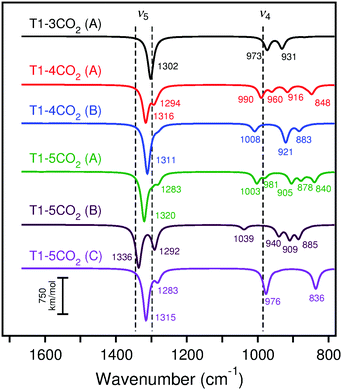
Calculated IRA spectra for the adsorption of three, four, and five CO2 molecules as surface carbonates on CaO(001) terraces are shown in Fig. 13. Adsorption of CO2 in the nearest neighbor position to a pre-adsorbed carbonate pair begins the formation of a carbonate chain across the terrace. The ν5 frequency is blue-shifted 11 cm−1 compared to the paired structure, while the ν4 frequency splits into two peaks that correspond to atomic motions of the outer carbonates in the chain (blue-shifted peak) and inner carbonates of the chain (red-shifted peak). Details regarding the changes in the ν4 and ν5 frequencies upon growth of the carbonate chain on terraces are given in Section S2 of the ESI.† A blue shift of the calculated IRA frequencies of the carbonate chain is expected due to the increased dipole–dipole interaction of the adsorbates. However, this effect remains constant in chains ranging from three to infinite carbonates in length. Because of the limited size of the T1 model, addition of a fourth CO2 molecule leads to a kink in the adsorption chain of carbonates, causing the simulated IRA bands to split. An increased blue-shift in the ν5 frequency is also observed. The effect of adding a fifth CO2 molecule to the surface, which simulates two kinks in the carbonate chain, results in additional blue-shifting of the ν5 frequency.
4. Discussion
Adsorption of CO2 on CaO(001) was found to be most favorable on low-coordinated sites such as steps, edges, and corners (−257 to −306 kJ mol−1). Despite an energy penalty due to crowding, the calculations showed that adsorption on an isolated terrace site (−184 ± 10 kJ mol−1) was ∼10 kJ mol−1 less favorable than to completely fill available step-edge sites. The adsorption energies obtained by TPD (∼120–140 kJ mol−1) and heats of adsorption from microcalorimetry measurements (∼125 kJ mol−1) at low coverage are inconsistent with the very strong adsorption energies calculated for CO2 at any isolated morphological site. However, when carbonate chains on the terrace surface intersect, forming kinks, the average adsorption strength decreases by ∼10–20 kJ per mol per kink. These data suggest that the TPD and microcalorimetry results correspond to aggregates of intersecting CO2 chains, even at low surface coverage. Presuming the CO2 sticking coefficient is not too large, we expect that CO2 adsorption at the lower-coordinated CaO(001) sites should manifest themselves in the experimental IRA spectra obtained at the lowest exposures, followed by adsorption on terraces at higher exposures.Comparison of the calculated IRA spectra (surface selection rules) of single CO2 molecule adsorption (Fig. 11) with the experimental spectra at the lowest CO2 coverage (Fig. 2, top curves) shows that terrace and corner sites do not fit the experimental data. Also for adsorption at the reverse corner site, a peak at 1585 cm−1 is predicted, which is absent in the experimental spectra for the Mo substrate. The calculated spectra at monoatomic step, diatomic step, and edge sites more closely agree for the 1298 cm−1 (ν5) band, while the diatomic step and edge sites agree best with the 985 cm−1 (ν4) band. Considering the calculated energies for adsorption of carbonate pairs on low coordinated sites (−192 to −245 kJ mol−1), it is likely that pairs and higher oligomers have already formed at the lowest CO2 exposure. Even in UHV conditions, CO2 traces in the background readily bind to low-coordinated CaO(001) sites. Therefore, we must consider the calculated IRA spectra of carbonate pairs to assign the experimental low-coverage CO2 spectra.
Comparison of the calculated IRA spectra of adsorption of two CO2 molecules (Fig. 12) with the low-coverage experimental spectra (Fig. 2) indicates that adsorption at terrace, monatomic step, and edge sites agree well with the experimental bands. Because the CO2 adsorption energies are much stronger on step and edge sites than terrace sites, the low-exposure IRA spectra are likely due to adsorption of two or more CO2 molecules at step and edge sites. From the calculations on periodic step models, we can compare the ν5 frequency of the completely filled monatomic step (1260 cm−1 with PBE) with that of a pair of carbonates adsorbed at nearest neighbor positions (1266 cm−1). The latter structure corresponds to the calculated carbonate pair on the cluster model (simulated IRA spectrum in red in Fig. 12). From these calculations, we estimate a 6 cm−1 deviation of the calculated ν5 frequency when using the step-adsorbed CO2 pair as a model for completely filled step sites. The calculated ν5 frequency of the nearest-neighbor step-adsorbed pair on the MS2 cluster with PBE is 1266 cm−1, in perfect agreement with the periodic model. Applying the 6 cm−1 correction to the calculated ν5 frequencies on cluster MS2 (1266 cm−1 for PBE and 1290 cm−1 for B3LYP) give estimated ν5 frequencies of completely filled step sites of 1260 cm−1 (PBE) and 1284 cm−1 (B3LYP). These frequencies are assigned to the first observable peak at 1298 cm−1 in the experimental spectrum, given in Table 2.
| Cluster modelsb | Periodic modelc | |||
|---|---|---|---|---|
| CO2 adsorption | B3LYPd | PBE | PBE | Experimentale |
| a The frequency shifts are given in parentheses, defined by subtracting the ν5 frequency of the completely filled step sites. b Calculated for cluster models MS2 (filled steps), T2 (terrace pair), and T1 (terrace chain and kinks). The rationale for utilization of different clusters is discussed in Section S2 of the ESI. c The frequencies are calculated for the largest periodic models. The range of frequencies for the chain are calculated from adsorption of three or more CO2 molecules in a diagonal stripe. d B3LYP frequencies are scaled by λ = 0.9800. e Experimental frequencies are taken from the room temperature spectral deconvolution in Fig. 3. f The ν5 frequency ranges given are only for the calculated high-frequency bands. | ||||
| Filled steps | 1284 | 1260 | 1260 | 1298 |
| Terrace pair | 1291 (+7) | 1263 (+3) | 1272 (+12) | 1310 (+12) |
| Terrace chain | 1302 (+18) | 1275 (+15) | 1279–1283 (+19–23) | 1322 (+24) |
| Terrace kinksf | 1311–1316 (+27–32) | 1283–1288 (+23–28) | ||
| 1315–1336 (+31–52) | 1287–1295 (+27–35) | 1345 (+47) | ||
The experimental IRA spectra at higher CO2 exposures (Fig. 2, middle curves) show the appearance of new blue-shifted ν5 peaks. Spectral deconvolution (Fig. 3 and 4) indicates that new peaks sequentially appear without blue-shifting, suggesting that each new peak is attributable to CO2 adsorption at a different site. The experimentally determined shifts in the ν5 frequencies are 12 cm−1, 24 cm−1, and 47 cm−1 from the original 1298 cm−1 peak, summarized in Table 2. According to the calculations, these new adsorption peaks can be assigned to various configurations of adsorption on terraces, corresponding to long chains of carbonates and kinks. The calculated frequencies of a single CO2 adsorbed on a terrace do not qualitatively match the experimental spectrum. However, it is thermodynamically favorable to form carbonate chains, rendering isolated carbonates on the terrace unlikely to be observed via IRAS. The calculated ν5 frequencies of two or three adsorbed CO2 molecules on a terrace are 1291 cm−1 and 1302 cm−1 with B3LYP, respectively, which is 7 cm−1 or 18 cm−1 blue-shifted compared to the estimated ν5 frequency of completely filled monatomic steps, 1284 cm−1. With PBE, the calculated shifts in the ν5 frequencies from the completely filled steps to a carbonate pair on a terrace are 3 cm−1 with the cluster model and 12 cm−1 with the periodic model; the analogous shifts for carbonate chains are 15 cm−1 (cluster model) and 19–23 cm−1 (periodic model). These values are summarized in Table 2.
The kinks in the carbonate chain simulated by adsorption of four and five CO2 molecules onto cluster T1 cause a split in the ν5 frequencies. The high-frequency ν5 bands range from 1311–1336 cm−1 with B3LYP and from 1283–1295 cm−1 with PBE, which correspond to blue-shifts of 27–52 cm−1 with B3LYP and 23–35 cm−1 with PBE from the completely filled step ν5 frequency estimate. The low-frequency ν5 bands range from 1283–1294 cm−1 with B3LYP and from 1261–1272 cm−1 with PBE. These low-frequency ν5 bands overlap with the calculated ν5 frequencies of filled step sites and carbonate pairs and chains on terraces. The high-frequency ν5 bands, however, exhibit additional blue-shifting indicative of the experimental results at higher CO2 exposures.
Our assignments of the initial stages of CO2 adsorption on CaO(001) are outlined in Table 2. The initial peak observed at 1298 cm−1 is likely due to completely filled step and edge sites, which are predicted to be completely filled prior to adsorption on terraces. Corner and reverse corner sites are also expected to be populated at the lowest exposure, but at a small enough density as to remain undetected by IRAS. The next observable peak at ∼1310 cm−1 is assigned to carbonate pairs and short chains on terraces. The subsequent peaks at ∼1322 cm−1 and ∼1345 cm−1 are assigned to long carbonate chains on the terrace that intersect, forming various 90° kinks. We note that our assignments are consistent with the positions and shifts of the ν4 bands. Experimentally, the ν4 band is especially broad and asymmetric at higher CO2 exposures. The length and kinks of the carbonate chains cause the ν4 bands to split into numerous peaks that are blue- and red-shifted compared to the original 985 cm−1 peak.
We can further assign peaks that are only visible upon adsorption of CO2 onto CaO/Ru(0001). The asymmetric stretches (ν6) of monodentate carbonates on terraces correspond to the broad peak at ∼1635 cm−1 in Fig. 2b. The calculated ν6 frequencies for adsorption of two CO2 molecules on a monatomic step are 1577 cm−1 with B3LYP and 1564 cm−1 with PBE. The analogous calculated ν6 frequencies of a carbonate pair on a terrace are 1629 cm−1 with B3LYP and 1618 cm−1 with PBE. Finally, the calculated ν6 frequencies of a carbonate chain are 1683 cm−1 with B3LYP and 1674 cm−1 with PBE. Accordingly, the peak at 875 cm−1 in Fig. 2b can be attributed to the π mode (ν3) of CO2 pairs and chains on terraces. The calculated ν3 frequencies on a terrace are 855 cm−1 for a pair and 858 cm−1 for a chain with B3LYP, and 828 cm−1 for a pair and 832 cm−1 for a chain with PBE. Given our assignments that the initial IRA peaks are due to populated step and edge sites, while subsequent peaks are attributed to various configurations of surface carbonates on terraces, the qualitative agreement with the ν6 and ν3 modes on these morphological sites provides additional validation.
5. Conclusions
Well-ordered CaO(001) films grown on a Mo(001) substrate were used as a model system to study initial stages of CO2 adsorption on CaO by IRAS. Comparison of the low-coverage IRA spectra on CaO/Mo(001) with CaO/Ru(0001), which is characterized by a mixed nanoparticulate morphology by STM, indicates similar peak position and intensities of two bands at ∼1300 and ∼985 cm−1. Other peaks present in the IRA spectra on the Ru(0001) substrate are missing in the spectra of CaO(001)/Mo(001) due to surface selection rules, in which only dipole changes normal to the surface are observed.The calculated adsorption energies for isolated CO2 on terrace sites (184 ± 10 kJ mol−1) are larger than adsorption energies obtained by TPD (∼120–140 kJ mol−1) and heats of adsorption from microcalorimetry measurements (∼125 kJ mol−1). However, the calculations indicate that formation of pairs and chains are thermodynamically favorable and therefore present from the onset of the adsorption experiments. A decrease in adsorption energy is observed when such terrace chains of adsorbed CO2 intersect, forming kinks. This is consistent with experimental evidence from microcalorimetry that suggests CO2 aggregates on the CaO surface.
The present DFT calculations indicate that the initial IRA peaks correspond to the symmetric stretching of monodentate surface carbonates bound to low-coordinated sites, primarily monotomic steps. Such sites are the most thermodynamically favorable absorption sites (−295 kJ mol−1) and will be completely filled prior to adsorption at terraces. At increasing CO2 dosing, additional IRA peaks are observed in the range ∼1310–1345 cm−1. These peaks can be assigned to symmetric stretching modes of adsorbed carbonate pairs and chains on terraces. At higher exposure, the carbonate chains on terraces intersect, forming kinks. The additional blue-shifting in the calculated frequencies of these kinks agrees well with the observed shifts in the experimental IRA spectra.
Acknowledgements
This work has been supported by the Deutsche Forschungsgemeinschaft within the Cluster of Excellence “Unifying Concepts in Catalysis,” Fonds der Chemischen Industrie, and with computing time at the high-performance computer center HLRN (North-German Supercomputing Alliance in Berlin and Hannover). BHS and YC acknowledge postdoctoral funding from the Alexander von Humboldt Foundation. BHS would like to thank members of the quantum chemistry group at Humboldt University for helpful discussions and advice.References
- H.-J. Freund and M. W. Roberts, Surf. Sci. Rep., 1996, 25, 225 CrossRef.
- U. Burghaus, Catal. Today, 2009, 148, 212 CrossRef CAS.
- S. Choi, J. H. Drese and C. W. Jones, ChemSusChem, 2009, 2, 796 CrossRef CAS PubMed.
- S. Wang, S. Yan, X. Ma and J. Gong, Energy Environ. Sci., 2011, 4, 3805 CAS.
- E. Kadossov and U. Burghaus, J. Phys. Chem. C, 2008, 112, 7390 CAS.
- R. Barker, J. Appl. Chem. Biotechnol., 1973, 23, 733 CAS.
- R. Barker, J. Appl. Chem. Biotechnol., 1974, 24, 221 CAS.
- A. L. Ortiz and D. P. Harrison, Ind. Eng. Chem. Res., 2001, 40, 5102 CrossRef CAS.
- G. Grasa, B. González, M. Alonso and C. Abanades, J. Energy Fuels, 2007, 21, 3560 CrossRef CAS.
- W. G. Oakeson and I. B. Cutler, J. Am. Ceram. Soc., 1979, 62, 556 CrossRef CAS.
- S. K. Bhatia and D. D. Perlmutter, AIChE J., 1983, 29, 79 CrossRef CAS.
- Y. Fukuda and K. Tanabe, Bull. Chem. Soc. Jpn., 1973, 46, 1616 CrossRef CAS.
- G. Pacchioni, J. M. Ricart and F. Illas, J. Am. Chem. Soc., 1994, 116, 10152 CrossRef CAS.
- E. J. Karlsen, M. A. Nygren and L. G. M. Pettersson, J. Phys. Chem. B, 2003, 107, 7795 CrossRef CAS.
- M. B. Jensen, L. G. M. Pettersson, O. Swang and U. Olsbye, J. Phys. Chem. B, 2005, 109, 16774 CrossRef CAS PubMed.
- C. A. Downing, A. A. Sokol and C. R. A. Catlow, Phys. Chem. Chem. Phys., 2014, 16, 184 RSC.
- W. F. Schneider, J. Phys. Chem. B, 2004, 108, 273 CrossRef CAS.
- Y. Zhang, J.-M. Hu, Q.-Z. Cao, M. Qiu, X. Huang and Y.-F. Zhang, Chin. J. Struct. Chem., 2013, 32, 1715 CAS.
- C. S. Doyle, T. Kendelewicz, X. Carrier and G. E. Brown Jr., Surf. Rev. Lett., 1999, 6, 1247 CAS.
- D. Ochs, B. Braun, W. Maus-Friedrichs and V. Kempter, Surf. Sci., 1998, 417, 406 CrossRef CAS.
- F. Voigts, F. Bebensee, S. Dahle, K. Volgmann and W. Maus-Friedrichs, Surf. Sci., 2009, 603, 40 CrossRef CAS.
- X. Shao, P. Myrach, N. Nilius and H.-J. Freund, J. Phys. Chem. C, 2011, 115, 8784 CAS.
- X. Shao, N. Nilius, P. Myrach, H.-J. Freund, U. Martinez, S. Prada, L. Giordano and G. Pacchioni, Phys. Rev. B: Condens. Matter Mater. Phys., 2011, 83, 245407 CrossRef.
- Y. Cui, Y. Pan, L. Pascua, H. Qiu, C. Stiehler, H. Kuhlenbeck, N. Nilius and H.-J. Freund, Phys. Rev. B: Condens. Matter Mater. Phys., 2015, 91, 035418 CrossRef.
- Y. Cui, X. Shao, M. Baldofski, J. Sauer, N. Nilius and H.-J. Freund, Angew. Chem., Int. Ed., 2013, 52, 11385 CrossRef CAS PubMed.
- F. Calaza, C. Stiehler, Y. Fujimori, M. Sterrer, S. Beeg, M. Ruiz-Oses, N. Nilius, M. Heyde, T. Parviainen, K. Honkala, H. Häkkinen and H.-J. Freund, Angew. Chem., Int. Ed., 2015, 54, 12484 CrossRef CAS PubMed.
- S. Tosoni, D. Spinnato and G. Pacchioni, J. Phys. Chem. C, 2015, 119, 27594 CAS.
- J.-H. Fischer-Wolfarth, J. Hartmann, J. A. Farmer, J. M. Flores-Camacho, C. T. Campbell, S. Schauermann and H.-J. Freund, Rev. Sci. Instrum., 2011, 82, 024102 CrossRef PubMed.
- S. Schauermann, T. L. Silbaugh and C. T. Campbell, Chem. Rec., 2014, 14, 759 CrossRef CAS PubMed.
- P. Dementyev, K.-H. Dostert, F. Ivars-Barceló, C. P. O'Brien, F. Mirabella, S. Schauermann, X. Li, J. Paier, J. Sauer and H.-J. Freund, Angew. Chem., Int. Ed., 2015, 54, 13942 CrossRef CAS PubMed.
- J. Fujita, A. E. Martell and K. Nakamoto, J. Chem. Phys., 1962, 36, 339 CrossRef CAS.
- A. A. Davydov, Infrared spectroscopy of adsorbed species on the surface of transition metal oxides, Wiley, Chichester, New York, 1990 Search PubMed.
- O. Seiferth, K. Wolter, B. Dillmann, G. Klivenyi, H.-J. Freund, D. Scarano and A. Zecchina, Surf. Sci., 1999, 421, 176 CrossRef CAS.
- P. A. Redhead, Vacuum, 1962, 12, 203 CrossRef CAS.
- Z. Dohnálik, G. A. Kimmel, P. Ayotte, R. S. Smith and B. D. Kay, J. Phys. Chem. B, 2001, 105, 3747 CrossRef.
- D. A. King and M. G. Wells, Proc. R. Soc. London, Ser. A, 1974, 339, 245 CrossRef CAS.
- A. M. Burow, M. Sierka, J. Döbler and J. Sauer, J. Chem. Phys., 2009, 130, 174710 CrossRef PubMed.
- TURBOMOLE V6.5 2013, A development of University of Karlsruhe and Forschungszentrum Karlsruhe GmbH, 1989–2007, TURBMOLE GmbH, since 2007; available from http://www.turbomole.com.
- A. D. Becke, J. Chem. Phys., 1993, 98, 5648 CrossRef CAS.
- C. Lee, W. Yang and R. G. Parr, Phys. Rev. B: Condens. Matter Mater. Phys., 1988, 37, 785 CrossRef CAS.
- J. P. Perdew, K. Burke and M. Ernzerhof, Phys. Rev. Lett., 1996, 77, 3865 CrossRef CAS PubMed.
- J. P. Perdew, K. Burke and M. Ernzerhof, Phys. Rev. Lett., 1997, 78, 1396 CrossRef CAS.
- F. Weigend and R. Ahlrichs, Phys. Chem. Chem. Phys., 2005, 7, 3297 RSC.
- W. R. Wadt and P. J. Hay, J. Chem. Phys., 1985, 82, 284 CrossRef CAS.
- M. Sierka, A. Hogekamp and R. Ahlrichs, J. Chem. Phys., 2003, 118, 9136 CrossRef CAS.
- S. Grimme, J. Comput. Chem., 2006, 27, 1787 CrossRef CAS PubMed.
- S. Tosoni and J. Sauer, Phys. Chem. Chem. Phys., 2010, 12, 14330 RSC.
- G. Kresse and J. Furthmüller, Phys. Rev. B: Condens. Matter Mater. Phys., 1996, 54, 11169 CrossRef CAS.
- G. Kresse and J. Furthmüller, Comput. Mater. Sci., 1996, 6, 15 CrossRef CAS.
- J. P. Merrick, D. Moran and L. Radom, J. Phys. Chem. A, 2007, 111, 11683 CrossRef CAS PubMed.
- C. Tuma and J. Sauer, Chem. Phys. Lett., 2004, 387, 388 CrossRef CAS.
- J. P. Allen, S. C. Parker and D. W. Price, J. Phys. Chem. C, 2009, 113, 8320 CAS.
- J. M. Weber, Int. Rev. Phys. Chem., 2014, 33, 489 CrossRef CAS.
Footnotes |
| † Electronic supplementary information (ESI) available: Computational details; detailed discussion of DFT calculations; discussion of HF, MP2, and CCSD(T) calculations; additional DFT adsorption structures, energies, and frequencies; coordinates and energies of optimized structures. See DOI: 10.1039/c6cp08504k |
| ‡ These authors contributed equally to the work. |
| § Current address: Vacuum Interconnected Nanotech Workstation, Suzhou Institute of Nano-Tech and Nano-Bionics, Chinese Academy of Sciences, Suzhou 215123, China. |
| This journal is © the Owner Societies 2017 |


