
 Open Access Article
 This Open Access Article is licensed under a
 Creative Commons Attribution 3.0 Unported Licence
On the role of charge transfer in halogen bonding†
Jan
Řezáč
 *a and
Aurélien
de la Lande
b
*a and
Aurélien
de la Lande
b
aInstitute of Organic Chemistry and Biochemistry, Czech Academy of Sciences, 166 10 Prague, Czech Republic. E-mail: rezac@uochb.cas.cz
bUniversité Paris Sud, Orsay Cedex 91405, France
First published on 23rd November 2016
Abstract
The role of charge transfer in halogen bonding is the subject of an ongoing debate and controversy. It is clear from experimental data that charge transfer occurs in halogen bonds, but its contribution to the energetics of the interaction can be evaluated only computationally. Since the charge transfer is not a physically well-defined property, there are multiple computational approaches, which could yield very different results. In this work, we investigate this topic using our recently developed method based on constrained DFT, which allows the quantification of net charge transfer and the associated interaction energy component [Řezáč et al., J. Chem. Theory Comput., 2015]. It is based on the spatial definition of molecular fragments using the superimposed electron density of non-interacting fragments as a reference state free of charge transfer. This definition is close to the intuitive view of charge transfer, yet it removes any arbitrariness in the partitioning of the molecular complex. It has been shown to be very reliable as it avoids the issues encountered in other definitions of charge transfer. For example, the results are independent of the basis set. These calculations are complemented with DFT-SAPT decomposition, which yields the other components of the interaction energy. We have found the energetic contribution of charge transfer to halogen bonding to be rather small, on average about 10% of the interaction energy, which is less than that in hydrogen bonds. Even in very strong halogen bonds, where the absolute value of the charge-transfer energy becomes larger, it is still only a small fraction of the other attractive terms obtained from DFT-SAPT. These results suggest that although it is present, charge transfer is not the determining factor in halogen bonding.
1 Introduction
Halogen bonds1,2 are complex noncovalent interactions, the strength of which is a result of an interplay of several different effects. The most frequently discussed contribution is the electrostatic term, which defines the whole class of halogen bonds. The attractive interaction between an electronegative halogen and another negatively charged site is possible only due to the σ-hole, a region of positive electrostatic potential in the axis of the covalent bond in which the halogen atom is involved.3 In the region of the σ-hole, the depleted electron density also leads to a reduction of the Pauli repulsion, which allows the interacting atoms to come closer than what their van der Waals radii would suggest, strengthening all the other contributions. This effect is also referred to as polar flattening.4,5 These effects define the characteristic angular dependence of the interaction energy in halogen bonds. Finally, an essential part of the mix is London dispersion. Such a close contact between two heavier atoms leads to strong dispersion interaction, which is the most important stabilizing component in weaker halogen bonds.6The halogen bond can also be viewed as a charge transfer complex where the halogen serves as an electron acceptor. This is supported by experimental evidence of changes in the electronic structure and the spectra of the molecules upon the formation of a halogen bond discussed already in 1950 by Mulliken.7 The most direct experimental evidence is based on the measurement of changes in nuclear quadrupole coupling constants upon formation of a halogen bond in the gas phase. These data were used to approximate the amount of charge transfer in complexes of Cl2, Br2, BrCl and ICl with a series of electron donors.8 The charge transfer in these systems is only moderate, despite a very strong interaction in some of the systems. This raises the question how the charge transfer (CT) contributes to the energetics of halogen bonding. This information cannot be obtained experimentally but it can be isolated in a calculation. Multiple different approaches have been employed and the published estimates vary widely. The original concept of σ-hole bonding proposed by Politzer et al. emphasizes the electrostatic mechanism and neglects the role of the charge transfer.9 This theory is reflected in the IUPAC definition of the halogen bond which says “The forces involved in the formation of the halogen bond are primarily electrostatic, but polarization, charge transfer, and dispersion contributions all play an important role.”10 Subsequent studies based on the decomposition of interaction energies by means of symmetry-adapted perturbation theory11,12 (SAPT) demonstrated the importance of dispersion in halogen bonding.6,13 These calculations also suggest that the contribution of charge transfer is not very large in the halogen bonds studied. While in the SAPT approach, CT is not a separate component but a part of the induction term, the whole induction energy has been found to be smaller than the first-order electrostatics or dispersion. These results are supported by the work of Tsuzuki et al., who argue that the typical characteristics of the halogen bond, most importantly the angular dependence, are conserved when the intermolecular distance is increased to lengths at which charge transfer cannot be significant (due to the fast decay of the orbital overlap).14 On the other hand, other authors suggest that charge transfer is an important part of halogen bonding.15,16 Recently, Wang et al. found large CT energies in halogen bonds by two different interaction energy decomposition schemes and argued that charge transfer is the main principle behind halogen bonding.17 Such different conclusions might seem confusing, but they all stem from the fact that there is no unambiguous method for decomposing the interaction energy and that the term that is the most difficult to separate among all the interaction energy terms is charge transfer.
The contribution of charge transfer to the interaction energy, which we will refer to as charge-transfer energy (ΔECT), is difficult to define and quantify. The charge transfer itself is not a physically well-defined effect because from the quantum-mechanical point of view, the interacting molecules are inseparable and the only valid description is to use a single wavefunction for the entire complex. In such a case, charge transfer cannot be distinguished from induction.18 It is, however, intuitive to separate the changes in the electronic structure within the molecular fragments (induction or polarization) from charge transfer across the border between these fragments. The problem is that this border has to be drawn arbitrarily and the results of further analysis depend strongly on its definition. Some approaches rely on the definition of the charge transfer in terms of orbitals – polarization is a rearrangement of electrons within orbitals localized on one molecule and charge transfer is the transfer of an electron from one molecule to unoccupied orbitals on the other. The results of such calculations are, however, dependent on the basis set used. In small basis sets, the charge transfer cannot be separated from the basis set superposition error, and in large basis sets, charge transfer approaches zero when basis set functions localized on one molecule become able to describe also the electrons localized on the other one.19
We have recently proposed an alternative definition of molecular fragments that is more robust.20 The fragments are defined spatially, which makes the result independent of the basis set size. To remove any arbitrariness, the charge transfer is defined with respect to the physically sound reference state free of charge transfer, a superposition of electron densities of isolated molecules. These densities are used to attribute spatial elements to the molecular fragments in a population scheme analogous to the Hirshfeld analysis.21 This yields the amount of charge transferred; to quantify the charge-transfer energy, the constrained density functional theory (cDFT) is used.22–24 It makes it possible to define a state where charge transfer, defined in terms of this population analysis, is forbidden but all the other properties are relaxed.25 ΔECT is then calculated as a difference between canonical DFT calculations where the charge transfer occurs and the one where it is constrained. We have shown that this approach is very robust and yields reliable results even in systems with extremely strong charge transfer.20
The methods for the quantification of charge-transfer energy differ not only in the means of the partitioning of the system, but also in other aspects, which may lead to very different results. In the orbital-based approach, it is possible to separate charge transfer from one molecule to the other and back, and the energy can be calculated for both these contributions separately. The overall CT energy would thus be larger than that in our approach, where we calculate only the net charge transfer and the associated energy. The second principal difference lies in the evaluation of the exchange term. Some interaction energy decomposition schemes separate the overall exchange energy (mainly Pauli repulsion) and the remaining terms are free of exchange effects. In other methods, such as in symmetry-adapted perturbation theory, each interaction energy component is accompanied by an associated exchange term. In our approach, the energies of both states involved in the calculations cover the exchange properly, and the resulting CT energy thus includes the exchange energy change associated with the charge transfer. These differences have to be kept in mind when comparing charge-transfer energies obtained using different methods.
The spatial definition of charge transfer is close to the intuitive understanding of the phenomenon, so that it may provide a reasonable explanation of the role of charge transfer in halogen bonding. In this work, we apply this methodology to a systematic study of halogen bonds ranging from weak to very strong ones. To allow for a comparison with interactions of other types, we work with the X40 dataset26 of noncovalent complexes of halogenated molecules, which features a wide range of interaction motifs. There also exist much stronger halogen bonds that are not included in the X40 set, and we have added several such systems to our study. The trends in charge-transfer energies and their relation to the overall interaction energies and other characteristics of the systems are used for the rationalization of the role of charge transfer in halogen bonding. Charge-transfer energy should be discussed not only in relation to the overall interaction energy but also with respect to other components of the interaction energy. Most importantly, the effect of the Pauli repulsion should be separated and the charge-transfer energy should be compared to the remaining (attractive) components, namely electrostatics, induction and dispersion. To obtain these components, we use the DFT-based symmetry-adapted perturbation theory27,28 (DFT-SAPT), which provides a well-defined and accurate decomposition of the interaction energy. We provide DFT-SAPT results for the whole X40 dataset as these data may be valuable for other applications.
Previously, our implementation of the cDFT methodology29 was limited to generalized gradient approximation (GGA) DFT functionals, where the charge transfer could be overestimated due to the self-interaction error, which leads to the overdelocalization of electrons. To investigate this issue, we have implemented the cDFT scheme for hybrid functionals also; we begin this study by analyzing the effects of exact exchange treatment on the results. The applicability of our DFT-based methodology is also justified by comparing the amount of charge transfer calculated using various functionals and population schemes with the experimental results.
2 Computational methods
2.1 Constrained DFT
In DFT, the energy E is obtained through the minimization of the DFT energy functional with respect to the electron density ρ. In constrained DFT, this minimization is carried out under additional constraint(s) on the charge (or spin) density. These constraints are imposed on atom groups specified by the user. Following Dederichs et al., the constraints are enforced in each iteration of the self-consistent (SCF) procedure using a Lagrange multiplier scheme.22 It can be shown that the stationary point of a cDFT calculation corresponds to the maximization of the energy with respect to the Lagrange multiplier(s) λc.23 In the case of a unique constraint, the electronic energy reads: | (1) |
One may follow standard population-analysis schemes like those formulated by Mulliken,30 Löwdin,31 Becke32 or Hirshfeld.21 However, we showed in a previous article that none of the standard schemes are suitable for reliable charge transfer calculations by cDFT.20 Dedicated partition schemes must be devised. They must ensure that the population analysis of the promolecular electronic density, which is obtained by superimposing fragment densities, produces charges on the individual fragments in the supramolecule that are equal to those obtained for isolated fragments. To this end, we previously defined a “fragment-based Hirshfeld” scheme (FBH),20 according to which the weighting function reads:
 | (2) |
 | (3) |
To obtain the energy of the noncovalent complex without charge transfer, eqn (1) is solved by imposing the number of electrons on fragment A to equal Nc, with Nc being equal to the number of electrons of the isolated fragment. It is not necessary to further impose a charge constraint on fragment B. Since we consider molecular systems composed of only two fragments and the total number of electrons is already imposed by the construction of the Kohn–Sham calculation, imposing the charge on fragment A also imposes the charge on fragment B. We verified that the charge-transfer energies were independent of the selection of fragment A or B when defining the weight function w.
In this paper, we also briefly test two more population schemes based on the density of the isolated fragments. In contrast to the scheme described so far, which uses the continuous weighting function, these schemes are based on partitioning the system into cells containing individual atoms. We shall first define a Fragment Voronoi Deformation Density (FVDD) scheme. It is built on the notion of Voronoi cells, which tessellate the space into non-overlapping polyhedrons attached to each atom.35 The weight function wVk for each atom Ak belonging to fragment A is given at each grid point i by:
 | (4) |
 | (5) |
2.2 The definition of the charge-transfer energy
The charge-transfer energy ΔECT is calculated as the energy difference between the DFT ground state in which the charge transfer occurs and the artificial state in which it is forbidden by means of cDFT:| ΔECT = E − EcDFT | (6) |
2.3 DFT calculation setup
We want to study the series of halogens up to iodine, but our present implementation of the cDFT method cannot work with pseudopotentials which are commonly used in calculations of such a heavy element. It was necessary to find an all-electron basis set and verify its applicability to noncovalent interactions of iodine. At the level of interaction energies calculated using the B-LYP functional, we have compared the def2-QZVP basis set,38 which was developed to work with relativistic pseudopotentials, with all-electron calculations where the AQZP basis set39,40 is used for iodine (while the def2-QZVP is used for the remaining elements). Both basis sets are of quadruple-ζ size. The root-mean-square deviation of the interaction energies over the iodine-containing systems from the X40 dataset was found to be 0.17 kcal mol−1, which is negligible in the context of the accuracy of DFT interaction energies. The error is systematic, and the all-electron calculations yield slightly more positive interaction energies, but the trends are conserved perfectly (the correlation coefficient R2 is 0.97). Both these results indicate that the description of noncovalent interactions of iodine is still reasonable even when non-relativistic all-electron calculations are used. The AQZP basis set is thus used for iodine throughout the study for all the charge transfer calculations performed on the X40 set.The DFT calculations in deMon2k rely on density fitting41 and the electron density in the cDFT calculation is also expressed using an auxiliary basis set, which is automatically generated from the atomic orbital basis set. Since cDFT calculations are sensitive to the quality of this basis set, we use the rather large GEN-A3* auxiliary basis set, after having verified that the results are practically converged with respect to the ones obtained with even larger auxiliary basis sets. In all calculations presented here, a fine integration grid (an adaptive grid using a threshold of 10−6 a.u.) is used in both the calculation and population analysis (note that these are set separately in deMon and both affect the accuracy of a cDFT calculation).
2.4 Auxiliary calculations
One of the quantities that determine the magnitude of the charge transfer is the energy difference between the highest occupied molecular orbital (HOMO) of the electron donor and the lowest unoccupied molecular orbital (LUMO) of the acceptor molecule, ΔEHOMO–LUMO (the donor and acceptor molecules are identified in the charge transfer calculation). Since DFT does not yield reliable energies of unoccupied orbitals, this term was calculated at the Hartree–Fock (HF) level in the cc-pVTZ basis set (cc-pVTZ-PP with the corresponding pseudopotential was used for iodine).The DFT-SAPT calculations were carried out in the Molpro 2015 package42,43 using the recommended setup. The monomer wavefunctions were obtained using the asymptotically corrected PBE0 functional. The calculations were performed in the aug-cc-pVTZ basis set, using the aug-cc-pVTZ-PP version44 along with the corresponding pseudopotentials for bromine and iodine. In the systems where pseudopotentials were not needed, density fitting was used to accelerate the calculations. The DFT-SAPT decomposition yields electrostatic (E(1)elst) and exchange (E(1)exch) terms in the first order and induction (E(2)ind) and dispersion (E(2)disp) in the second. The second-order terms are both associated with complementary exchange contributions (E(2)exch–ind) and (E(2)exch–disp). The higher-order effects (mostly induction) are added as the δHF correction calculated from the difference between the Hartree–Fock interaction energy and the corresponding SAPT terms. Note that in this formalism, the induction terms also cover charge transfer, but it is not possible to separate it.
2.5 The systems studied
In this work, we use three established datasets of model systems related to the topic. For testing the methodology, we use the set of charge-transfer complexes developed by Karthikeyan et al.,45 which we used already in our previous study. It features eleven systems exhibiting charge transfer ranging from moderate to extremely strong. To include an example of a hydrogen bond, we have added the water dimer in the geometry taken from the S66 dataset.46For the study of halogen bonding, we used the X40 dataset,26 which covers various classes of interactions involving halogenated molecules. The X40 set maps halogen bonding between Cl, Br and I interacting with nitrogen, oxygen and, where applicable, also sulfur. In addition, there are halogen–π interactions and the set also allows a comparison with hydrogen bonds, where the halogens play various roles. To compare the charge transfer in halogen and hydrogen bonds, we have also calculated the hydrogen-bonded complexes from the S66 dataset, removing the symmetrical ones where charge transfer cannot be calculated using this methodology and system 11, where the geometry minimum is not a proper H-bond (it is using complexes 1–10, 12–16, 18 and 19 from the set).
Two additional systems to complement the X40 dataset as well as the complexes from ref. 8 were prepared using a protocol similar to the one used in the construction of the datasets: the geometries were optimized at the MP2/cc-pVTZ level and the interaction energies were calculated using a composite CCSD(T)/CBS scheme with counterpoise correction. The CCSD(T)/CBS was constructed from MP2/CBS extrapolated47 from aug-cc-pVTZ and aug-cc-pVQZ basis sets and the CCSD(T) correction was calculated in aug-cc-pVDZ (the -PP variant of the basis set with a pseudopotential was used for iodine). The accuracy of this scheme with respect to the true CBS limit was estimated to be about 2%.48,49
2.6 The software used
The cDFT calculations were carried out in a modified version of the deMon2k program.33,34 The code is available to licensed users of deMon2k upon request. The DFT-D3 calculation of interaction energies, the HF calculations of orbital energies, MP2 optimizations, CCSD(T) calculations and the NBO analysis were performed in Turbomole version 6.6.50,51 The Cuby framework52,53 was used to automate the calculations of the datasets; all the sets used in this work are distributed as a part of Cuby.3 Results and discussion
3.1 Comparison of calculated and experimentally derived net charge transfer
Before we move to the main topic, the calculations of the charge transfer energies, we test the population analysis that is based on systems for which the experimental estimate of the net intermolecular charge transfer is available. We use the data published by Legon, who studied the gas-phase rotational spectra of complexes Cl2, Br2, BrCl and ICl with a series of electron donors ranging from strong to very weak.8 For these systems, the charge transfer was estimated from the changes in nuclear quadrupole coupling constants on the two atoms involved in the halogen bonds using the Townes–Dailey model.54We have selected two series of systems, the complexes of BrCl and ICl with PH3, NH3, C2H4, H2S, C2H2, H2O, N2 and Ar. This set covers charge transfer values from almost zero (complexes with Ar) to 0.145 e (PH3⋯ICl). The geometries of the complexes were build in binding modes corresponding to the experiment and optimized at the MP2/cc-pVTZ level with counterpoise correction. The charge transfer was then calculated using several population schemes, basis sets and DFT functionals. There is a good but not perfect correlation between the experimental charge transfer and the computed values in all cases. This is because both experiment and theory yield only estimates based on different assumptions. The central quantity in our analysis is the slope of a linear fit of the computed values to the experiment (with intercept fixed at zero); values close to 1.0 indicate good match between theory and experiment while larger values suggest that the calculation overestimates the charge transfer by that factor.
The role of the DFT functional is tested in calculations using the fragment-based Hirshfeld population analysis in the large basis set (def2-QZVP, AQZP for iodine). It is well known that GGA DFT functionals overestimate charge transfer because of the self-interaction error. This can be partly remediated by the use of hybrid DFT functionals. Our results confirm that; the slopes (average of those from BrCl and ICl series) are 1.39 for B-LYP, 1.16 for B3-LYP and 1.05 for BH-LYP (Becke half and half LYP). The last functional, a hybrid with 50% of HF exchange, performs the best and the results are in best agreement with experiment. Further evidence supporting the use of this functional to study charge transfer is provided below.
The FBH population scheme was developed specifically for this application and we have already shown that none of the conventional population analysis schemes yield accurate and reliable charge transfer energies.20 This can also be demonstrated by comparison with the experimental data. In the same set of complexes, we calculated the charge transfer using several other population schemes using the BH-LYP functional and the same large basis set. The results are summarized in Table 1. The FBH scheme is the only one yielding the average slope close to 1. The classical Hirshfeld scheme21 uses the same spatial partitioning but the reference density is constructed from the densities of neutral atoms. It overestimates the charge transfer substantially. The Becke partitioning32 is also spatial but neglects the electronic structure completely; the (incorrect) direction of charge transfer is determined merely by the size of the interacting atom rather than actual changes in the electronic structure upon formation of the complex. The Mulliken,30 Löwdin,31 and natural bond orbital (NBO) population analysis55 are an example of the orbital approach; they all overestimate the charge transfer noticeably. Additionally, the basis set dependence of the results is demonstrated by the Mulliken population analysis which was also performed in the smaller def2-SVP basis set. The difference is only about 7% but we have previously shown that the charge transfer energy calculated is much more sensitive than the amount of charge transferred. Defining the constraint using Mulliken charges, the CT energy becomes practically zero in the large basis set (see Fig. 2 in ref. 20).
| Population analysis | a |
|---|---|
| Fragment-based Hirshfeld | 1.05 |
| Hirshfeld | 1.86 |
| Becke | −1.12 |
| Mulliken | 1.35 |
| Mulliken/def2-SVP | 1.44 |
| Löwdin | 1.68 |
| NBO | 1.50 |
The comparison with experimental estimates of charge transfer suggests that the FBH scheme at the BH-LYP/def2-QZVP level yields charge transfer in a correct range. It is thus reasonable to assume that the charge transfer energies calculated using this method are also close to reality.
3.2 Charge transfer energy calculations with GGA and hybrid functionals
It is difficult to judge the accuracy of the charge-transfer energy calculations as there is no true benchmark for them to be compared to. In our previous study introducing the method, we showed that it produces consistent results that are practically independent of the DFT functional or basis set (once the basis set is large enough to describe the system properly). Also, the result for the water dimer was close to the consensus based on multiple previous studies.56 The only question left open in the paper was the possible effect of the self-interaction error, because the implementation of the method was limited to GGA functionals. This error could lead to the overdelocalization of the electrons across the noncovalent complex and thus to the overestimation of the charge transfer.We have extended our implementation of cDFT to hybrid DFT functionals, which allows us to investigate this issue. Although the self-interaction error is not removed completely, the dependence of the results on the amount of exact exchange in the functional provides valuable information that facilitates the choice of the functional best suited for this type of calculation. In the set of charge-transfer complexes that we have used before, we now compare the results obtained with the GGA functionals B-LYP and PBE and their hybrid variants B3-LYP and PBE0. To demonstrate the effect of an increased amount of exact exchange, we have also added the BH-LYP functional with 50% of it (compared to 20% in B3-LYP). The calculations were performed in the def2-QZVP basis set; we have shown previously that the charge-transfer energies calculated in this basis set are already very close to the CBS limit. The fragment-based Hirshfeld population scheme is used to define the constraint. The resulting charge-transfer energies are listed in Table 2 and plotted in Fig. 1.
| System | ΔEint | ΔECT | ||||
|---|---|---|---|---|---|---|
| B-LYP | B3-LYP | BH-LYP | PBE | PBE0 | ||
| 0 Water dimer | −4.96 | −1.04 | −0.91 | −0.85 | −0.94 | −1.04 |
| 1 ClF⋯ethene | −3.91 | −1.60 | −1.25 | −0.36 | −1.63 | −1.26 |
| 2 F2⋯ethyne | −1.02 | −1.25 | −0.52 | −0.16 | −1.13 | −0.36 |
| 3 ClF⋯water | −5.20 | −2.38 | −1.73 | −1.32 | −2.54 | −1.80 |
| 4 ClF⋯HCN | −4.77 | −0.84 | −0.83 | −0.69 | −1.04 | −0.84 |
| 5 NH3⋯BH3 | −44.27 | −10.57 | −11.26 | −11.59 | −11.58 | −11.63 |
| 6 NH3⋯Cl2 | −4.91 | −3.55 | −2.02 | −1.68 | −3.72 | −2.62 |
| 7 NH3⋯ClF | −11.16 | −8.14 | −7.08 | −5.66 | −8.24 | −7.25 |
| 8 NH3⋯F2 | −1.71 | −2.07 | −0.90 | −0.21 | −2.02 | −0.69 |
| 9 NH3⋯SO2 | −5.72 | −2.11 | −1.79 | −1.35 | −2.42 | −1.91 |
| 10 NMe3⋯BH3 | −55.33 | −11.42 | −12.23 | −12.70 | −11.67 | −12.55 |
| 11 NMe3⋯SO2 | −14.83 | −13.05 | −12.48 | −11.50 | −13.58 | −13.03 |
 | ||
| Fig. 1 Charge-transfer energies calculated with B-LYP (blue) and PBE (red) families of DFT functionals with a varying amount of exact exchange. | ||
The results follow the expectations: the admixture of exact exchange in hybrid functionals reduces the charge transfer. Interestingly, this effect is more pronounced in the systems with weaker charge transfer. In the group of systems with charge-transfer energy smaller than 5 kcal mol−1 (systems 0–4, 6, 8 and 9), the magnitude of the charge-transfer energy is reduced, on average, by 0.61 kcal mol−1 (30%) when passing from B-LYP to B3-LYP, by 1.03 kcal mol−1 (53%) when passing from B-LYP to BH-LYP and by 0.61 kcal mol−1 (31%) in the case of PBE and PBE0. In the remaining systems with stronger charge transfer, there is practically no difference between the charge transfer energies calculated with GGA and hybrid functionals (0.9% for B3-LYP and 2.1% for PBE0) with the exception of BH-LYP, where the charge transfer is 26% weaker. The trends are, however, almost the same, only BH-LYP changes the relative order of the last two systems where the charge transfer is strongest (but a change in the slope between these points is visible already upon the transition from GGA to B3-LYP or PBE0).
Keeping in mind that the charge-transfer energy is not a well-defined variable, the performance of the GGA functional is satisfactory for qualitative purposes and relative comparisons. For accurate quantification of the charge-transfer effects, hybrid functionals can be recommended. In this work, we will discuss systems with weak charge transfer, and the use of hybrid functionals is thus appropriate. B3-LYP and PBE0 yield almost identical results while BH-LYP differs slightly and predicts smaller CT energies. To select a single functional for further discussion, we also looked at the interaction energies in this dataset. DFT-D3 interaction energies57 (calculated in the def2-QZVP basis set, using the BJ damping58) were compared with the benchmark CCSD(T)/CBS interaction energies;20 the resulting errors are listed in Table 3. All the functionals overestimate the strength of the interaction, which can be attributed to overestimated charge-transfer effects due to the self-interaction error. The error decreases with the amount of exact exchange in the functional and the best results are achieved with BH-LYP, where the systematic error (evaluated as the mean signed error, MSE) is only −0.41 kcal mol−1. Although this functional is not the best one for general use, it is the best choice for charge-transfer complexes.
| Functional | RMSE | MSE |
|---|---|---|
| B-LYP | 2.61 | −0.74 |
| B3-LYP | 1.89 | −0.61 |
| BH-LYP | 1.52 | −0.41 |
| PBE | 3.01 | −2.29 |
| PBE0 | 2.33 | −1.58 |
3.3 Alternative population schemes
The fragment-based Voronoi deformation density and Becke deformation density schemes were tested on charge-transfer energies in the dataset of charge-transfer complexes. The calculations were performed using B-LYP, B3-LYP, BH-LYP, PBE and PBE0 functionals in the def2-QZVP basis set. The results obtained with different functionals are very similar. Here we will discuss only BH-LYP CT energies, which are plotted in Fig. 2 (the corresponding tables are available in the ESI,† as Tables S1 and S2). Since the FVDD and FBDD schemes are very similar in principle, it is no surprise that they produce almost identical results. What is more important is the comparison with the fragment-based Hirshfeld scheme that we devised in our previous work.20 | ||
| Fig. 2 BH-LYP/def2-QZVP charge-transfer energies calculated with cDFT constraints based on fragment-based Hirshfeld (FBH), Voronoi deformation density (FVDD) and Becke deformation density (FBDD) population schemes. | ||
In the complexes with weaker charge transfer, the difference between FVDD/FBDD and FBH schemes is small and its distribution is practically random. More significant differences are found only in the two systems with the strongest CT (complexes of BH3); the magnitude of ΔECT is about 2 kcal mol−1 smaller in the FBH calculation. As we have shown earlier,20 the CT energy is very sensitive to the choice of the partitioning scheme in the strong CT complexes with very short intermolecular distances. Even though all the schemes compared here satisfy the condition of yielding zero charge transfer on the superimposed density of noninteracting fragments, this difference is caused by the difference in their formulation.
To decide which scheme is the most accurate, we use the variational principle as the main argument. We search for the lowest energy state where charge transfer is prevented (under the conditions discussed above) and therefore the scheme that yields the smallest CT energies should be preferred. When evaluated across this test set, it is the fragment-based Hirshfeld approach. Moreover, the FBH scheme offers the most straightforward definition of charge transfer and does not use sharp boundaries that may be prone to numerical issues. In the rest of the paper, only the fragment-based Hirshfeld scheme is used without further notice.
3.4 Charge transfer in the X40 dataset
We have calculated charge transfer in the whole X40 dataset; before we focus on the halogen bonds, we will discuss all the classes of interactions featured in the set. For the purpose of this analysis, the interactions in the set are divided into the following groups: weak interactions governed by dispersion or non-specific electrostatics (systems 1–10), π–π stacking (systems 11 and 12), halogen bonds (13–26), halogen–π interactions (27–30) and hydrogen bonds (31–40). The charge-transfer energies were again calculated using B-LYP, B3-LYP, BH-LYP, PBE and PBE0 functionals. The results are summarized in Table 4 as average charge-transfer energies in the groups. The relative importance of charge transfer in the groups was calculated as the ratio of ΔECT and ΔEint (unless noted otherwise, the benchmark CCSD(T)/CBS interaction energies are used), averaged over each group. The differences between the functionals are small; for further discussion, we will use the BH-LYP results because this functional yields the best interaction energies in charge-transfer complexes. The charge-transfer energies and the amount of charge transferred calculated at this level, as well as the benchmark CCSD(T)/CBS interaction energies26 and the donor/acceptor HOMO/LUMO gap, are listed in Table 5.| Group | B-LYP | B3-LYP | BH-LYP | PBE | PBE0 |
|---|---|---|---|---|---|
| (a) | |||||
| Weak | −0.08 | −0.02 | −0.04 | −0.07 | −0.06 |
| Stacking | 0.00 | −0.01 | −0.03 | −0.08 | −0.02 |
| Halogen bonds (all) | −0.42 | −0.44 | −0.36 | −0.49 | −0.35 |
| Halogen bonds (O) | −0.28 | −0.28 | −0.30 | −0.38 | −0.25 |
| Halogen bonds (N) | −1.01 | −0.89 | −0.68 | −1.05 | −0.70 |
| Halogen bonds (S) | −0.12 | −0.45 | −0.20 | −0.14 | −0.23 |
| Halogen–π | −0.17 | −0.15 | −0.20 | −0.07 | −0.33 |
| Hydrogen bonds | −1.85 | −2.25 | −2.07 | −2.22 | −2.17 |
| Hydrogen bonds, S66 | −0.92 | −0.86 | −0.81 | −0.91 | −0.76 |
| Group | B-LYP (%) | B3-LYP (%) | BH-LYP (%) | PBE (%) | PBE0 (%) |
|---|---|---|---|---|---|
| (b) | |||||
| Weak | 7 | 2 | 3 | 8 | 5 |
| Stacking | 0 | 0 | 0 | 1 | 0 |
| Halogen bonds (all) | 11 | 12 | 10 | 14 | 10 |
| Halogen bonds (O) | 9 | 9 | 9 | 13 | 8 |
| Halogen bonds (N) | 23 | 19 | 14 | 24 | 15 |
| Halogen bonds (S) | 5 | 15 | 7 | 5 | 8 |
| Halogen–π | 5 | 5 | 6 | 2 | 10 |
| Hydrogen bonds | 22 | 27 | 25 | 26 | 26 |
| Hydrogen bonds, S66 | 15 | 14 | 13 | 15 | 13 |
| A⋯B | Type | ΔEint (kcal mol−1) | ΔECT (kcal mol−1) | q(A) (e) | ΔEHOMO–LUMO (a.u.) | |
|---|---|---|---|---|---|---|
| 1 | Methane⋯F2 | Dispersion | −0.49 | 0.00 | 0.003 | 0.650 |
| 2 | Methane⋯Cl2 | Dispersion | −1.08 | −0.03 | 0.004 | 0.584 |
| 3 | Methane⋯Br2 | Dispersion | −1.3 | −0.16 | 0.002 | 0.549 |
| 4 | Methane⋯I2 | Dispersion | −1.35 | −0.08 | 0.005 | 0.531 |
| 5 | Fluoromethane⋯methane | Induction | −0.75 | 0.00 | 0.000 | 0.672 |
| 6 | Chloromethane⋯methane | Induction | −0.98 | 0.00 | 0.000 | 0.578 |
| 7 | Trifluoromethane⋯methane | Induction | −0.69 | 0.00 | 0.001 | 0.740 |
| 8 | Trichloromethane⋯methane | Induction | −1.15 | 0.00 | 0.002 | 0.594 |
| 9 | Fluoromethane dimer | Dipole–dipole | −1.65 | −0.12 | 0.003 | 0.673 |
| 10 | Chloromethane dimer | Dipole–dipole | −1.34 | 0.00 | 0.002 | 0.566 |
| 11 | Trifluorobenzene⋯benzene | Stack | −4.4 | 0.00 | −0.004 | 0.449 |
| 12 | Hexafluorobenzene⋯benzene | Stack | −6.12 | −0.05 | −0.008 | 0.432 |
| 13 | Chloromethane⋯formaldehyde | Halogen bond | −1.17 | 0.00 | 0.000 | 0.575 |
| 14 | Bromomethane⋯formaldehyde | Halogen bond | −1.72 | −0.03 | −0.003 | 0.561 |
| 15 | Iodomethane⋯formaldehyde | Halogen bond | −2.38 | −0.30 | −0.011 | 0.538 |
| 16 | Trifluorochloromethane⋯formaldehyde | Halogen bond | −2.25 | −0.14 | −0.008 | 0.613 |
| 17 | Trifluorobromomethane⋯formaldehyde | Halogen bond | −3.1 | −0.25 | −0.012 | 0.555 |
| 18 | Trifluoroiodomethane⋯formaldehyde | Halogen bond | −4.08 | −1.16 | −0.023 | 0.510 |
| 19 | Chlorobenzene⋯acetone | Halogen bond | −1.49 | −0.01 | −0.002 | 0.525 |
| 20 | Bromobenzene⋯acetone | Halogen bond | −2.43 | −0.19 | −0.006 | 0.522 |
| 21 | Iodobenzene⋯acetone | Halogen bond | −3.46 | −0.56 | −0.018 | 0.517 |
| 22 | Chlorobenzene⋯trimethylamine | Halogen bond | −2.11 | −0.10 | −0.008 | 0.470 |
| 23 | Bromobenzene⋯trimethylamine | Halogen bond | −3.78 | −0.39 | −0.019 | 0.467 |
| 24 | Iodobenzene⋯trimethylamine | Halogen bond | −5.81 | −1.55 | −0.048 | 0.460 |
| 25 | Bromobenzene⋯methanethiol | Halogen bond | −2.32 | −0.13 | −0.003 | 0.467 |
| 26 | Iodobenzene⋯methanethiol | Halogen bond | −3.08 | −0.26 | −0.015 | 0.462 |
| 27 | Benzene⋯bromomethane | Halogen–π | −1.81 | −0.03 | 0.005 | 0.454 |
| 28 | Benzene⋯iodomethane | Halogen–π | −2.48 | −0.07 | 0.013 | 0.432 |
| 29 | Benzene⋯trifluorobromomethane | Halogen–π | −3.11 | −0.16 | 0.011 | 0.447 |
| 30 | Benzene⋯trifluoroiodomethane | Halogen–π | −3.91 | −0.53 | 0.023 | 0.404 |
| 31 | Trifluoromethanol⋯water | H-bond | −9.67 | −2.14 | −0.034 | 0.631 |
| 32 | Trichloromethanol⋯water | H-bond | −10.41 | −1.56 | −0.034 | 0.615 |
| 33 | HF⋯methanol | H-bond | −9.59 | −2.49 | −0.036 | 0.590 |
| 34 | HCl⋯methanol | H-bond | −6.3 | −1.57 | −0.033 | 0.571 |
| 35 | HBr⋯methanol | H-bond | −5.36 | −2.16 | −0.031 | 0.556 |
| 36 | HI⋯methanol | H-bond | −3.97 | −1.43 | −0.028 | 0.539 |
| 37 | HF⋯methylamine | H-bond | −14.32 | −3.37 | −0.054 | 0.527 |
| 38 | HCl⋯methylamine | H-bond | −11.42 | −5.64 | −0.087 | 0.500 |
| 39 | Methanol⋯fluoromethane | H-bond | −3.89 | −0.26 | −0.010 | 0.668 |
| 40 | Methanol⋯chloromethane | H-bond | −3.78 | −0.09 | −0.007 | 0.573 |
In the group of weakly interacting systems, the magnitude of the charge-transfer energies is negligible as expected. Since these interactions alone are rather weak, the relative contribution of charge transfer to the interaction energy amounts to 3%. The situation is similar in the π–π stacked systems, but as these feature larger interaction energies, the relative importance of charge transfer drops practically to zero. This is rather surprising because especially in the latter of the two model systems, charge transfer from the π electrons of benzene to the electron-deficient π electron system of the hexafluorobenzene would be possible. However, our calculations suggest that this strong interaction (ΔEint −6.1 kcal mol−1) is driven solely by electrostatics and dispersion.
The average charge-transfer energy in the group of halogen-bonded complexes is surprisingly small – only −0.36 kcal mol−1 (10% of the interaction energy). There are, however, important differences within the group, which will be discussed in detail below. In the halogen–π complexes, which can be seen as halogen bonding between the π electrons on benzene and the positive σ-hole on a halogen atom, the charge-transfer character is even weaker, only 6% of the interaction energy.
The strongest charge transfer in the X40 set is observed in hydrogen bonds where the ΔECT amounts on average to 25% of the interaction energy. The charge-transfer energies are consistently very high (the average: −2.1 kcal mol−1, the maximum: −5.6 kcal mol−1) in all the strong hydrogen bonds in the set (with the interaction energies being −3.97 to −14.32 kcal mol−1). The two hydrogen bonds with fluoro- and chloromethane as the electron donor (the last two complexes) exhibit much smaller charge transfer (−0.26 an −0.09 kcal mol−1, respectively) although the interaction energies are both close −4 kcal mol−1. Surprisingly, the largest ΔECT is not observed in the strongest hydrogen bond in the X40 set, the HF⋯methylamine complex (ΔEint −14.32 kcal mol−1 and ΔECT −3.37 kcal mol−1). Instead, it is found in an analogous complex of HCl with methylamine, which is weaker (ΔEint −11.42 kcal mol−1) because HCl is less polar but the charge transfer is exceptionally strong, with ΔECT −5.64 kcal mol−1. Both these hydrogen bonds are substantially stronger than analogous complexes with the oxygen from methanol serving as the electron donor.
The large charge-transfer energies in the H-bonds from the X40 dataset warrant a comparison with hydrogen bonds in organic molecules involving oxygen and nitrogen. We have used a set of single H-bonds from the S66 dataset (see the Methods for details), for which we calculated ΔECT using the same setup (the charge-transfer energies are available in the ESI,† in Table S3). The average interaction energy in this set, −6.42 kcal mol−1, is not far from the one in the H-bonds from the X40 set, −7.87 kcal mol−1. The contribution of charge transfer is, however, significantly smaller (13%) when compared to 25% in halogenated systems. It is also interesting to note that the ΔECT does not vary much in the organic H-bonds, with the average value being −0.81 kcal mol−1 and the largest value being −1.33 kcal mol−1 (in the methanol⋯pyridine complex). The most significant difference is between systems with the oxygen and nitrogen electron donor, with the average ΔECT being −0.99 and −0.77. This effect is, however, less pronounced than in the X40 set. In contrast to the strong CT complexes and the X40 set, the charge-transfer energies in the organic hydrogen bonds are less sensitive to the choice of the DFT functional (see the last row of Table 4), which explains the good performance of GGA functionals in the prediction of the interaction energies of these systems.
3.5 DFT-SAPT calculations on the X40 dataset
A comparison of the charge-transfer energy with the interaction energy provides some insight into the importance of charge transfer in the complexes studied, but it has one major drawback. Charge transfer as well as the other attractive forces are opposed by the Pauli repulsion. The larger the interaction energy, the stronger the components that cancel each other. More valuable information for the assessment of the importance of the charge transfer in the interaction is provided by its comparison only with the other attractive terms. To achieve that, we have performed the interaction energy decomposition by means of DFT-SAPT. All the individual components are provided in the ESI,† in Tables S4 and S5; for the purpose of our analysis, we have grouped them as follows.The first-order exchange repulsion E(1)exch is set aside and only the remaining (in this case always attractive) terms are considered. The first-order electrostatic term E(1)elst is used as it is; although this is only an approximation, it is calculated on non-symmetrized wavefunctions of the monomers and it does not include the exchange energy resulting from the symmetrization that is part of the E(1)exch. The electrostatic contribution compensated for exchange effects would be slightly weaker, but it cannot be calculated using the present methodology.
In the second and higher orders, we group the terms into induction/charge transfer and dispersion components, which are corrected for exchange effects, calculated as Eind+CT = E(2)ind + E(2)exch–ind + δHF and Edisp = E(2)disp + E(2)exch–disp. This is consistent with our definition of ΔECT, which implicitly includes the corresponding exchange term because both the DFT calculations from which it is derived use the orthonormal wavefunction. Finally, pure induction Eind is obtained by subtracting the ΔECT obtained using the cDFT from the DFT-SAPT Eind+CT term.
These interaction energy components are made relative to their sum, that is to the net attractive energy, and averaged in the groups of complexes defined above. The results are plotted in Fig. 3. In all the groups, charge-transfer energy is the smallest component, induction is the second smallest and the majority of stabilization energy is divided between electrostatics and dispersion according to the nature of the interaction.
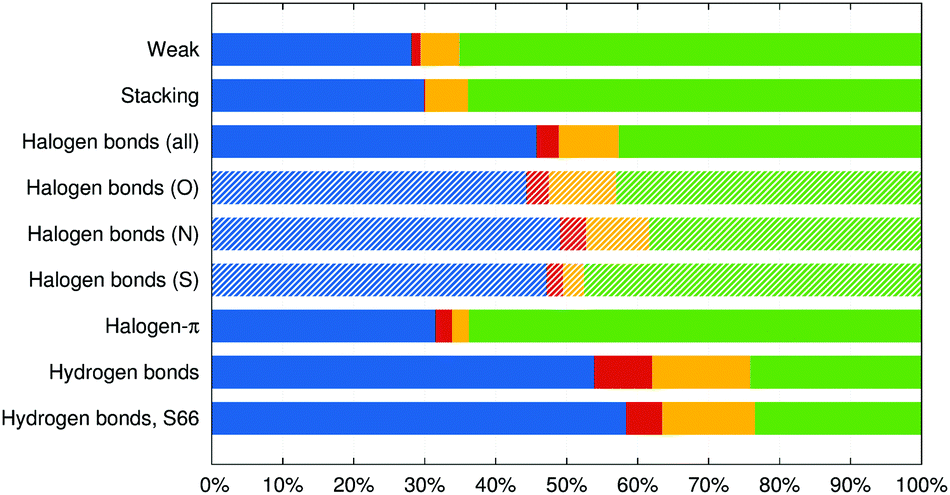 | ||
| Fig. 3 Attractive components of the interaction energy averaged over the groups of interaction of different nature, plotted relative to their sum: electrostatics (blue), charge transfer (red), induction (yellow) and dispersion (green). | ||
It is no surprise that the interaction in the weak and π–π stacked complexes is clearly dominated by dispersion (65 and 64% of the attractive interaction), followed by the electrostatics (starting with dipole–dipole interactions in some systems in the “weak” group and quadrupole–quadrupole interactions in the π–π stacked complexes). Charge transfer is negligible with 1.3 and 0.2%, respectively.
In halogen bonds from the X40 set, dispersion and electrostatics are the most important contributions and are of almost the same size, making 46 and 43% of the overall attraction (it has to be reminded that the electrostatic component is overestimated in this decomposition scheme). When counted this way, the contribution of charge transfer becomes even smaller at 3.1% while induction contributes by 8%. The halogen–π interactions feature a similar amount of charge-transfer energy at 2.4%, but the ratio of dispersion and electrostatics is shifted to 64![[thin space (1/6-em)]](https://www.rsc.org/images/entities/char_2009.gif) :32% and induction is substantially weaker at 2.3%.
:32% and induction is substantially weaker at 2.3%.
Finally, hydrogen bonds are dominated by 54% of electrostatics, followed by 24% of dispersion, and the largest induction and charge transfer contributions among the groups with Eind making 14% and ΔECT making 8% of the overall attraction. This analysis, which makes charge-transfer energy comparable to the other components of the interaction energy, only confirms the conclusions made on the basis of a comparison of ΔECT with the interaction energy itself. Charge transfer is surprisingly weak in the halogen bonds studied, notably weaker than in hydrogen bonds.
3.6 Charge transfer in halogen bonds
The halogen bonds from the X40 will be discussed in more detail. The charge-transfer energies in these systems are plotted in Fig. 4. Overall, the charge-transfer energies correlate well with the strength of the interaction (R2 = 0.85). The correlation is surprisingly good although the ΔECT term itself makes only 10% of the interaction energy. This is caused by the synergic effect of charge transfer, electrostatics (determined by the magnitude of the σ-hole) and dispersion, which follow the same trends in the series of halogens.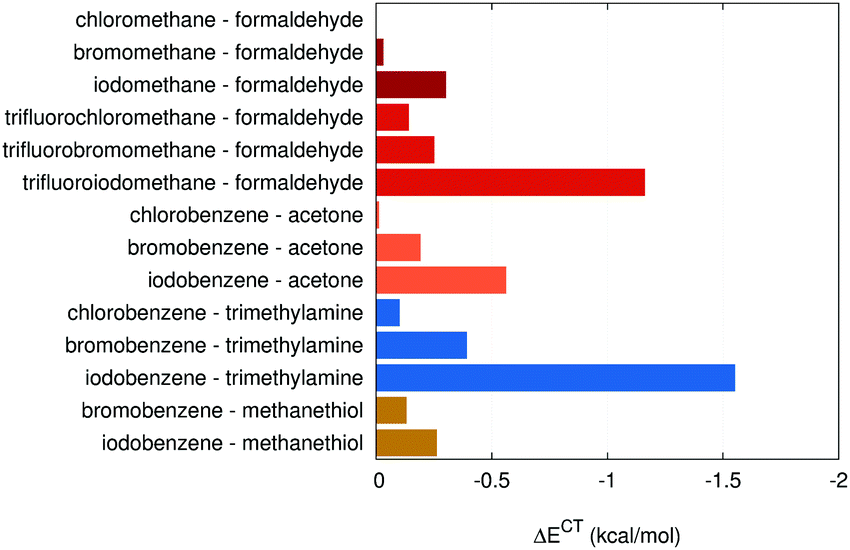 | ||
| Fig. 4 Charge-transfer energies in halogen bonds. The colors indicate different electron-donor atoms: oxygen (red, three separate series are differentiated by shading), nitrogen (blue) and sulfur (brown). | ||
The most obvious trend in charge-transfer energies is their increase in the series from chlorine to iodine. The set of model systems contains five groups of systems, which differ only in the halogen atom, and in each of these ΔECT increases systematically. The increase between Cl and Br is always smaller than the step from Br to I. This is in line with the trend in the strength of the halogen bond, which itself follows the increase of the atomic polarizability of halogens. The question is what the primary cause of this correlation is, whether a large charge transfer results in a stronger interaction or the strong interaction is just accompanied by larger charge transfer. There are two arguments that support the latter hypothesis: firstly, the susceptibility of the system to charge transfer at the molecular orbital level, the energy difference between the HOMO of the electron donor and the LUMO of the acceptor ΔEHOMO–LUMO, does not change in each set of systems where only the halogen is varied. The only series where this quantity changes are the trifluorohalomethane complexes, where the electron-withdrawing effect of the fluorination affects differently halogens of increasing size. Secondly, the charge-transfer energy is only a small part of the total interaction energy, and the remaining contributions are more important. It is the dispersion and electrostatics that dominate the interaction and thus affect the length of the halogen bond. In strong halogen bonds, this length can be very short, significantly shorter than a sum of van der Waals distances (this is caused not only by the attractive force but also by the polar flattening effects4,5), which facilitates the charge transfer. For example, in the series of halobenzene⋯acetone systems, the ΔEHOMO–LUMO remains the same but the distance, expressed relative to the sum of van der Waals radii, decreases in the series Cl, Br and I with the values of 96, 91 and 88%.
The most important feature that determines the magnitude of the charge transfer and also the strength of the interaction of a given halogen is the nature of the electron donor. The halogen bonds involving oxygen and sulfur are weaker than the ones of nitrogen, which correlate well with the charge-transfer energies. The X40 dataset features two analogous series of halobenzenes interacting with acetone and trimethylamine; in the latter series, the charge-transfer energies are more than twice strong and the iodobenzene⋯trimethylamine halogen bond is the strongest one in the set. This difference can be attributed to the lower ΔEHOMO–LUMO in the trimethylamine complexes (0.47 a.u. as compared to 0.52 a.u. in analogous complexes with acetone). However, the CT energies themselves are too small to explain such large differences in interaction energies. The DFT-SAPT decomposition averaged over halogen bonds with different acceptors (Fig. 3) shows that the electrostatic interaction is also stronger in the complexes with nitrogen. On the other hand, in the complexes featuring sulfur donor, induction is substantially weaker than that in the other cases due to the lower polarity of sulfur. This is compensated for by an increased amount of dispersion due to the larger polarizability of sulfur as compared to the first-row atoms.
Finally, the complexes with an oxygen electron donor include three subsets of halogen bonds of varying strengths. The interaction is weakest in the case of halomethanes, where the electron density on the halogen is largest and the σ-hole is thus small. The interaction becomes stronger when we pass to halobenzenes, and the strongest interaction in this set of systems is found in trifluorohalomethanes, where fluorination leads to the reduction of electron density on the halogen and the σ-hole becomes larger and more positive. This is in agreement with our previous studies of substitution effects on halogen bonds59,60 and the magnitude of charge transfer follows these trends.
The halogen bonds included in the X40 dataset represent the common interaction motifs that have relatively small interaction energies. However, in special cases, halogen bonds can be much stronger and it is necessary to study the role of charge transfer also in these systems. One such halogen bond can be obtained by combining the best electron donor from the X40 set, trimethylamine, with the best acceptor, CF3I. This results in a smaller ΔEHOMO–LUMO gap of 0.42 a.u. and ΔECT of −2.87 kcal mol−1, almost 50% more than in the strongest halogen bond in the X40 set. The CCSD(T)/CBS interaction energy in this complex is −8.57 kcal mol−1.
Molecular iodine is an even better electron acceptor and it is found in some of the strongest halogen bonds observed previously.61 Its complex with trimethylamine is extremely strong with a ΔEint value of −14.73 kcal mol−1. Here, the ΔEHOMO–LUMO gap is even lower at 0.32 a.u. and the charge-transfer energy is −8.80 kcal mol−1. The synergy of the attractive contributions makes this halogen bond extremely short (2.57 Å, i.e. 73% of the sum of van der Waals radii), which is another factor supporting the charge transfer. The charge transfer makes 60% of the interaction energy, but in a system with such a short intermolecular distance, this comparison loses its meaning – all the attractive contributions are very strong but they are compensated for by large Pauli repulsion.
This can be confirmed quantitatively by DFT-SAPT calculations (the individual components are provided in Table S4 in the ESI†). It must be, however, noted that the DFT-SAPT becomes rather inaccurate in these very strong halogen bonds and it overestimates the interaction energies by 25 and 37% in the complexes of CF3I and I2 with trimethylamine. This is because the intermolecular interaction is no longer a small perturbation and the approximations in the method are not sufficient to describe it. Nevertheless, this accuracy is still sufficient to make valid conclusions. When the ΔECT in these two complexes is compared to the sum of the attractive terms from DFT-SAPT, it makes only 10 and 13% of it. This is not much more than in the analogous complex of iodobenzene from the X40 dataset, where the contribution of CT is 7%. It is thus clear that even in the very strong halogen bonds, charge transfer does not play any special role, because all the other attractive terms also increase as the intermolecular distance shortens.
4 Conclusions
We have extended our cDFT methodology to hybrid functionals, which makes it possible to analyze the effect of exact exchange (which corrects the self-interaction error of GGA functionals) on charge-transfer energies. In noncovalent complexes with strong charge transfer, increasing the fraction of HF exchange reduces the magnitude of the charge transfer and the best results are obtained with functionals with a large amount of HF exchange such as the BH-LYP. We have also confirmed that cDFT calculations using different population schemes based on the same definition of charge transfer yield very similar results. The combination of the FBH population scheme with the BH-LYP functional reproduces well the experimentally derived estimates of charge transfer in halogen-bonded complexes.Charge transfer is indeed involved in halogen bonding, but its energetic contribution is, in most cases, relatively small. In the set of 14 halogen bonds from the X40 dataset, charge-transfer energy represents on average 10% of the interaction energy. For comparison, charge transfer contributes to hydrogen bonding with 25% in the X40 set and 13% in organic molecules from the S66 set. However, in very strong halogen bonds where there is a good match between the electron donor and the accepting halogen moiety, the charge transfer can become a much larger part of the interaction energy.
The DFT-SAPT calculations have made it possible to put the charge-transfer energy into the context of other components of the interaction energy. Putting the Pauli repulsion (approximated by the first-order exchange from DFT-SAPT) aside, we have decomposed the remaining attractive interaction into first-order electrostatics, induction, charge transfer and dispersion. In all the groups of interactions in the X40 dataset, charge-transfer energy is the smallest component, followed by induction energy. All the interactions are dominated by electrostatics and dispersion, the ratio of which depends on the nature of the interaction. In halogen bonds, these contributions are of very similar magnitude, with electrostatics being slightly stronger. In this analysis, charge transfer in halogen bonds becomes even less significant as it contributes to the total attractive interaction with only 3%.
Two main trends can be observed among the halogen bonds studied: first, the charge-transfer energy always increases in the series of Cl, Br and I analogs, and this effect cannot be explained by donor/acceptor frontier orbital energies. Since the other attractive terms (mainly electrostatics and dispersion) dominate the interaction energy, which also increases in this series, the increase in charge transfer is attributable to the shortening of the halogen-bond length (relative to the van der Waals contact distance), which accompanies the increase of interaction energy. This results in the strong correlation between the charge-transfer energy and the overall interaction energy, which is sometimes incorrectly interpreted as if the charge transfer were the factor determining the strength of the halogen bond.
Second, charge transfer (and also the overall interaction energy) is stronger in complexes with a nitrogen atom as the electron donor, as compared to oxygen. Complexes where a nitrogen atom interacts with iodine are thus the strongest ones from the systems studied here. This is in line with the trends in charge transfer, but electrostatics, induction and dispersion are also strongest in this group of complexes.
In very strong halogen bonds, charge-transfer energy could become rather large and in the complex of molecular iodine with trimethylamine, it makes 60% of the interaction energy. However, this ratio is dramatically reduced when the charge-transfer energy is compared only with the attractive part of the interaction energy from DFT-SAPT, out of which it makes only 13% in this case. This clearly demonstrates that even in complexes where the absolute magnitude of charge-transfer energy is large, it is not the component that determines the strength of the interaction.
Overall, our results suggest that charge transfer indeed occurs in halogen bonding, but its energetic contribution to it is in most cases rather small (about 10% of the interaction energy), smaller than that in hydrogen bonds. Only in the strongest halogen bonds, the charge-transfer energy becomes larger, but so do all the other attractive components of the interaction energy. Therefore, charge transfer cannot be considered the driving force in halogen bonding.
Acknowledgements
We would like to thank Dr Daniel Mejia Rodriguez for his help with implementation of the BH-LYP functional in deMon. This work is part of the research project RVO 61388963 of the IOCB of the AS CR. The funding for this work by the Czech Science Foundation (grant no. P208/12/G016) is gratefully acknowledged.References
- G. Cavallo, P. Metrangolo, R. Milani, T. Pilati, A. Priimagi, G. Resnati and G. Terraneo, Chem. Rev., 2016, 116, 2478–2601 CrossRef CAS PubMed.
- M. H. KoláŘ and P. Hobza, Chem. Rev., 2016, 116, 5155–5187 CrossRef PubMed.
- T. Clark, M. Hennemann, J. S. Murray and P. Politzer, J. Mol. Model., 2007, 13, 291–296 CrossRef CAS PubMed.
- H. Eramian, Y.-H. Tian, Z. Fox, H. Z. Beneberu and M. Kertesz, J. Phys. Chem. A, 2013, 117, 14184–14190 CrossRef CAS PubMed.
- R. Sedlák, M. H. KoláŘ and P. Hobza, J. Chem. Theory Comput., 2015, 11, 4727–4732 CrossRef.
- K. E. Riley and P. Hobza, Phys. Chem. Chem. Phys., 2013, 15, 17742–17751 RSC.
- R. S. Mulliken, J. Am. Chem. Soc., 1950, 72, 600–608 CrossRef CAS.
- A. C. Legon, Phys. Chem. Chem. Phys., 2010, 12, 7736–7747 RSC.
- P. Politzer, J. S. Murray and T. Clark, Phys. Chem. Chem. Phys., 2010, 12, 7748–7757 RSC.
- G. R. Desiraju, P. S. Ho, L. Kloo, A. C. Legon, R. Marquardt, P. Metrangolo, P. Politzer, G. Resnati and K. Rissanen, Pure Appl. Chem., 2013, 85, 1711–1713 CrossRef CAS.
- B. Jeziorski, R. Moszynski and K. Szalewicz, Chem. Rev., 1994, 94, 1887–1930 CrossRef CAS.
- A. Stone, The Theory of Intermolecular Forces, Oxford University Press, 2nd edn, 2013, pp. 100–117 Search PubMed.
- K. E. Riley and P. Hobza, J. Chem. Theory Comput., 2008, 4, 232–242 CrossRef CAS PubMed.
- S. Tsuzuki, A. Wakisaka, T. Ono and T. Sonoda, Chem. – Eur. J., 2012, 18, 951–960 CrossRef CAS PubMed.
- M. Palusiak, THEOCHEM, 2010, 945, 89–92 CrossRef CAS.
- L. P. Wolters and F. M. Bickelhaupt, ChemistryOpen, 2012, 1, 96–105 CrossRef CAS PubMed.
- C. Wang, D. Danovich, Y. Mo and S. Shaik, J. Chem. Theory Comput., 2014, 10, 3726–3737 CrossRef CAS PubMed.
- P. Politzer, J. S. Murray and T. Clark, J. Mol. Model., 2015, 21, 52 CrossRef PubMed.
- A. J. Stone and A. J. Misquitta, Chem. Phys. Lett., 2009, 473, 201–205 CrossRef CAS.
- J. Řezáč and A. de la Lande, J. Chem. Theory Comput., 2015, 11, 528–537 CrossRef PubMed.
- F. L. Hirshfeld, Theor. Chim. Acta, 1977, 44, 129–138 CrossRef CAS.
- P. H. Dederichs, S. Blügel, R. Zeller and H. Akai, Phys. Rev. Lett., 1984, 53, 2512–2515 CrossRef CAS.
- Q. Wu and T. Van Voorhis, Phys. Rev. A: At., Mol., Opt. Phys., 2005, 72, 024502 CrossRef.
- B. Kaduk, T. Kowalczyk and T. Van Voorhis, Chem. Rev., 2012, 112, 321–370 CrossRef CAS PubMed.
- Q. Wu, P. W. Ayers and Y. Zhang, J. Chem. Phys., 2009, 131, 164112 CrossRef PubMed.
- J. Řezáč, K. E. Riley and P. Hobza, J. Chem. Theory Comput., 2012, 8, 4285–4292 CrossRef PubMed.
- H. L. Williams and C. F. Chabalowski, J. Phys. Chem. A, 2001, 105, 646–659 CrossRef CAS.
- A. Heßelmann and G. Jansen, Chem. Phys. Lett., 2002, 362, 319–325 CrossRef.
- J. Řezáč, B. Lévy, I. Demachy and A. de la Lande, J. Chem. Theory Comput., 2011, 8, 418–427 CrossRef.
- R. S. Mulliken, J. Chem. Phys., 1955, 23, 1833–1840 CrossRef CAS.
- P.-O. Löwdin, in Advances in Quantum Chemistry, ed. P.-O. Löwdin, Academic Press, 1970, vol. 5, pp. 185–199 Search PubMed.
- A. D. Becke, J. Chem. Phys., 1988, 88, 2547–2553 CrossRef CAS.
- A. M. Köster, G. Geudtner, P. Calaminici, M. E. Casida, V. D. Domnguez-Soria, R. Flores-Moreno, G. U. Gamboa, A. Goursot, T. Heine, A. Ipatov, F. Janetzko, J. M. del Campo, J. U. Reveles, A. Vela, B. Zuniga-Gutierrez and D. R. Salahub, deMon2k Version 4, 2013 Search PubMed.
- G. Geudtner, P. Calaminici, J. Carmona-Espndola, J. M. del Campo, V. D. Domnguez-Soria, R. F. Moreno, G. U. Gamboa, A. Goursot, A. M. Köster, J. U. Reveles, T. Mineva, J. M. Vásquez-Pérez, A. Vela, B. Zúñinga-Gutierrez and D. R. Salahub, Wiley Interdiscip. Rev.: Comput. Mol. Sci., 2012, 2, 548–555 CrossRef CAS.
- C. Fonseca Guerra, J.-W. Handgraaf, E. J. Baerends and F. M. Bickelhaupt, J. Comput. Chem., 2004, 25, 189–210 CrossRef PubMed.
- Q. Wu, C.-L. Cheng and T. V. Voorhis, J. Chem. Phys., 2007, 127, 164119 CrossRef PubMed.
- Q. Wu, B. Kaduk and T. V. Voorhis, J. Chem. Phys., 2009, 130, 034109 CrossRef PubMed.
- F. Weigend and R. Ahlrichs, Phys. Chem. Chem. Phys., 2005, 7, 3297–3305 RSC.
- P. A. Fantin, P. L. Barbieri, A. Canal Neto and F. E. Jorge, THEOCHEM, 2007, 810, 103–111 CrossRef CAS.
- L. S. C. Martins, F. A. L. de Souza, G. A. Ceolin, F. E. Jorge, R. C. de Berrêdo and C. T. Campos, Comput. Theor. Chem., 2013, 1013, 62–69 CrossRef CAS.
- A. M. Köster, J. U. Reveles and J. M. del Campo, J. Chem. Phys., 2004, 121, 3417–3424 CrossRef PubMed.
- H.-J. Werner, P. J. Knowles, G. Knizia, F. R. Manby, M. Schütz, P. Celani, W. Györffy, D. Kats, T. Korona, R. Lindh, A. Mitrushenkov, G. Rauhut, K. R. Shamasundar, T. B. Adler, R. D. Amos, A. Bernhardsson, A. Berning, D. L. Cooper, M. J. O. Deegan, A. J. Dobbyn, F. Eckert, E. Goll, C. Hampel, A. Hesselmann, G. Hetzer, T. Hrenar, G. Jansen, C. Köppl, Y. Liu, A. W. Lloyd, R. A. Mata, A. J. May, S. J. McNicholas, W. Meyer, M. E. Mura, A. Nicklass, D. P. O'Neill, P. Palmieri, D. Peng, K. Pflüger, R. Pitzer, M. Reiher, T. Shiozaki, H. Stoll, A. J. Stone, R. Tarroni, T. Thorsteinsson and M. Wang, MOLPRO version 2015, a package of ab initio programs, 2015, http://www.molpro.net.
- H.-J. Werner, P. J. Knowles, G. Knizia, F. R. Manby and M. Schütz, Wiley Interdiscip. Rev.: Comput. Mol. Sci., 2012, 2, 242–253 CrossRef CAS.
- K. A. Peterson, D. Figgen, E. Goll, H. Stoll and M. Dolg, J. Chem. Phys., 2003, 119, 11113–11123 CrossRef CAS.
- S. Karthikeyan, R. Sedlák and P. Hobza, J. Phys. Chem. A, 2011, 115, 9422–9428 CrossRef CAS PubMed.
- J. Řezáč, K. E. Riley and P. Hobza, J. Chem. Theory Comput., 2011, 7, 2427–2438 CrossRef PubMed.
- T. Helgaker, W. Klopper, H. Koch and J. Noga, J. Chem. Phys., 1997, 106, 9639–9646 CrossRef CAS.
- J. Řezáč, M. Dubecký, P. Jurečka and P. Hobza, Phys. Chem. Chem. Phys., 2015, 17, 19268–19277 RSC.
- J. Řezáč and P. Hobza, Chem. Rev., 2016, 116, 5038–5071 CrossRef PubMed.
- TURBOMOLE v6.6, 2016, http://www.turbomole.com Search PubMed.
- F. Furche, R. Ahlrichs, C. Hättig, W. Klopper, M. Sierka and F. Weigend, Wiley Interdiscip. Rev.: Comput. Mol. Sci., 2014, 4, 91–100 CrossRef CAS.
- J. Řezáč, Cuby 4, Software Framework for Computational Chemistry, 2015, http://cuby4.molecular.cz/ Search PubMed.
- J. Řezáč, J. Comput. Chem., 2016, 37, 1230–1237 CrossRef PubMed.
- C. H. Townes and B. P. Dailey, J. Chem. Phys., 1949, 17, 782–796 CrossRef CAS.
- A. E. Reed, R. B. Weinstock and F. Weinhold, J. Chem. Phys., 1985, 83, 735–746 CrossRef CAS.
- E. Ronca, L. Belpassi and F. Tarantelli, ChemPhysChem, 2014, 15, 2682–2687 CrossRef CAS.
- S. Grimme, J. Antony, S. Ehrlich and H. Krieg, J. Chem. Phys., 2010, 132, 154104 CrossRef PubMed.
- S. Grimme, S. Ehrlich and L. Goerigk, J. Comput. Chem., 2011, 32, 1456–1465 CrossRef CAS PubMed.
- K. E. Riley and P. Hobza, Wiley Interdiscip. Rev.: Comput. Mol. Sci., 2011, 1, 3–17 CrossRef CAS.
- K. Riley, J. Murray, J. Fanfrlk, J. Řezáč, R. Solá, M. Concha, F. Ramos and P. Politzer, J. Mol. Model., 2013, 19, 4651–4659 CrossRef CAS PubMed.
- P. Deepa, R. Sedlak and P. Hobza, Phys. Chem. Chem. Phys., 2014, 16, 6679–6686 RSC.
Footnote |
| † Electronic supplementary information (ESI) available: Tables of charge-transfer energies calculated using the alternative population schemes (Tables S1 and S2), charge-transfer energies for hydrogen bonds from the S66 dataset (Table S3) and complete DFT-SAPT decomposition for X40 (Table S4) and S66 (Table S5). See DOI: 10.1039/c6cp07475h |
| This journal is © the Owner Societies 2017 |