Solvation behavior of carbonate-based electrolytes in sodium ion batteries†
Arthur V.
Cresce
*a,
Selena M.
Russell
 a,
Oleg
Borodin
a,
Joshua A.
Allen
a,
Marshall A.
Schroeder
a,
Michael
Dai
a,
Jing
Peng
b,
Mallory P.
Gobet
a,
Oleg
Borodin
a,
Joshua A.
Allen
a,
Marshall A.
Schroeder
a,
Michael
Dai
a,
Jing
Peng
b,
Mallory P.
Gobet
 b,
Steven G.
Greenbaum
b,
Reginald E.
Rogers
c and
Kang
Xu
a
b,
Steven G.
Greenbaum
b,
Reginald E.
Rogers
c and
Kang
Xu
a
aElectrochemistry Branch, Sensor and Electron Devices Directorate, U.S. Army Research Laboratory, Adelphi, MD 20783, USA. E-mail: arthur.v.cresce.civ@mail.mil
bDepartment of Physics, Hunter College, City University of New York, New York, NY, USA
cDepartment of Chemical Engineering, Rochester Institute of Technology, Rochester, NY, USA
First published on 29th November 2016
Abstract
Sodium ion batteries are on the cusp of being a commercially available technology. Compared to lithium ion batteries, sodium ion batteries can potentially offer an attractive dollar-per-kilowatt-hour value, though at the penalty of reduced energy density. As a materials system, sodium ion batteries present a unique opportunity to apply lessons learned in the study of electrolytes for lithium ion batteries; specifically, the behavior of the sodium ion in an organic carbonate solution and the relationship of ion solvation with electrode surface passivation. In this work the Li+ and Na+-based solvates were characterized using electrospray mass spectrometry, infrared and Raman spectroscopy, 17O, 23Na and pulse field gradient double-stimulated-echo pulse sequence nuclear magnetic resonance (NMR), and conductivity measurements. Spectroscopic evidence demonstrate that the Li+ and Na+ cations share a number of similar ion–solvent interaction trends, such as a preference in the gas and liquid phase for a solvation shell rich in cyclic carbonates over linear carbonates and fluorinated carbonates. However, quite different IR spectra due to the PF6− anion interactions with the Na+ and Li+ cations were observed and were rationalized with the help of density functional theory (DFT) calculations that were also used to examine the relative free energies of solvates using cluster – continuum models. Ion–solvent distances for Na+ were longer than Li+, and Na+ had a greater tendency towards forming contact pairs compared to Li+ in linear carbonate solvents. In tests of hard carbon Na-ion batteries, performance was not well correlated to Na+ solvent preference, leading to the possibility that Na+ solvent preference may play a reduced role in the passivation of anode surfaces and overall Na-ion battery performance.
Introduction
Electrical energy storage is a critical aspect of modern technology, covering a wide range of devices from mobile communication to domestic products, industrial tools and sensors, and an increasing need for automotive and large-scale grid storage. Lithium ion batteries are the premier technology for portable energy storage due to their energy density advantage over other rechargeable chemistries. Because of increasing applications and demand, the market for lithium ion batteries continues to be on the rise.1–11 Renewed efforts are ongoing to access the full range of lithium ion battery capabilities for high energy and high power applications. However, in recent years, concerns have risen regarding the stability of lithium reserves and the associated costs with developing lithium ion batteries. As these reserves continue to be depleted, the cost for manufacturing next generation lithium ion systems will increase, with the costs being passed to the consumer. With the development of renewable energy sources (e.g., wind and solar), large-scale electric energy storage systems are likely to be key components in the process of integrating intermittent energy generation into the grid.9Sodium ion batteries are gaining significant interest due to their potential to provide similar energy capabilities to lithium ion but at a lower price per kilowatt hour.12–14 The main reason for the reduced cost of sodium ion is the high abundance of sodium in the Earth's crust and oceans compared to lithium; Na is present at ∼23![[thin space (1/6-em)]](https://www.rsc.org/images/entities/char_2009.gif) 600 mg kg−1 of crust compared to just ∼20 mg kg−1 of crust for Li.15 The abundance of sodium leads to lower materials and acquisition costs, and may also reduce the costs of processing and development of sodium raw materials into sodium ion batteries. Additionally, sodium ion batteries have the advantage of serving as a renewable resource, reducing potential issues associated with contamination and degradation of natural resources. The ability to recycle sodium ion batteries after use allows for the possibility of designing a low-cost battery that becomes inherently environmentally friendly.14
600 mg kg−1 of crust compared to just ∼20 mg kg−1 of crust for Li.15 The abundance of sodium leads to lower materials and acquisition costs, and may also reduce the costs of processing and development of sodium raw materials into sodium ion batteries. Additionally, sodium ion batteries have the advantage of serving as a renewable resource, reducing potential issues associated with contamination and degradation of natural resources. The ability to recycle sodium ion batteries after use allows for the possibility of designing a low-cost battery that becomes inherently environmentally friendly.14
Given these advantages, the limitations associated with the development of sodium ion batteries for use in multiple applications merit further attention. Suitable cathode and anode host materials for sodium ions are currently being investigated.16–27 Sodium ion electrolytes make use of organic carbonate solvents, which have been the basis for lithium ion battery solvents since their commercial inception in the early 1990s.28–31 However, questions remain regarding the compatibility of these carbonates to the sodium ion system, and their performance in sodium ion batteries has not proven reliable or safe enough for applications such as grid storage.13,14,32 No experimental works to date have explored the solvation of Na+ in carbonate solvents to understand the preferential nature of Na+ solvation, especially as it relates to the critical process of electrode passivation.
Recent computational studies indicate that mixtures of ethylene carbonate (EC) and propylene carbonate (PC) have the highest free energy of Na+ solvation among investigated candidates.33,34 These studies also find that EC is preferred over PC by Na+ using similar energetic comparisons.34 The calculation of EC preference over PC by Na+ is opposite to observations of EC:PC preference of Li+, which means there may be significant differences in how Na+ and Li+ interact with carbonate solvents.7 Evidence presented in this work, both experimental and computational, will show that Na+ interacts more weakly with carbonate solvents than Li+, and that Na+ possesses many similar competitive solvation trends as Li+ in spite of its weaker ion–solvent interaction while some noticeable differences are observed. The consequences of Na+–solvent interaction are presented in a combination of diffusion, conductivity, and battery cell performance test results.
Methods
Solution preparation
Sodium hexafluorophosphate (NaPF6) was purchased from American Elements and used as received. Ethylene carbonate (EC), propylene carbonate (PC), ethyl methyl carbonate (EMC), fluoroethylene carbonate (FEC), dimethyl carbonate (DMC), and dimethoxyethane (DME) were purchased from BASF and dried over 3 Å molecular sieves that were activated at 400 °C. Diethyl carbonate (DEC) was purchased from Ferro and dried over 3 Å molecular sieves. All electrolyte solvents and solutions were stored and handled in an argon-filled Vacuum Atmospheres Nexus One glovebox with measured levels <1 ppm O2, <1 ppm H2O.Characterization techniques
Electrospray mass spectrometry (ESI-MS) data was collected by a JEOL AccuTOF mass spectrometer operating in positive mode for cation cluster detection. The sample injection chamber was filled with dry nitrogen and heated to 250 °C, with a needle-plate potential of 1000 V. Data was analyzed using JEOL mass spectrometry software, with peak height data culled from mass spectrometry intensity at expected cation–solvent mass/charge (m/z) ranges. Fourier transform infrared spectroscopy (FTIR) was performed with a Nicolet 6700 spectrometer instrument and a Golden Gate single reflection monolithic diamond attenuated total reflection (ATR) sample cell. Data was collected as the accumulation of 128 scans with a 4 cm−1 resolution. Raman spectra were collected in an argon-filled glovebox (Innovative Technology Inc.), with measured levels <0.1 ppm O2 and <0.1 ppm H2O with a Renishaw inVia confocal microscope using a 785 nm laser excitation source and a sample laser power of <0.7 mW, 10 second exposure time and 20 accumulations. FTIR and Raman spectra were analyzed using LabSpec 5 curve fitting software, using a Gaussian–Lorentzian function for deconvolution.17O and 23Na nuclear magnetic resonance (NMR) chemical shift were performed with a 400 SB Bruker Avance III spectrometer (9.4 T). To avoid interaction between the electrolyte and the NMR tube (borosilicate glass), the samples were placed in a 4 mm Teflon tube and inserted in a 5 mm NMR tube containing a chemical shift reference in deuterated solvent. In order to improve the resolution of 17O NMR (by reducing the quadrupolar broadening), and to decrease 23Na relaxation rates for sodium diffusion measurements, all NMR experiments were performed at 60 °C. The chemical shift references for 17O and 23Na were DMSO-d6 (δ = 14.89 ppm, with respect to water) and 1 M NaCl in D2O (δ = 0 ppm), respectively. The transients for 17O and 23Na experiments were 32k and 512, respectively. For diffusion measurements, a pulse field gradient double-stimulated-echo pulse sequence was used to suppress convection effects.35,361H and 19F diffusion measurements were done on the above-mentioned spectrometer, the gradient pulse strength g was arrayed from 1 to 45 G cm−1 (32 values, linearly increased), the gradient pulse duration was δ = 1.2–2.5 ms and the diffusion delay was Δ = 100–200 ms. Since the 23Na relaxation times were extremely short, 23Na NMR diffusion experiments were done with a 300 WB Varian S-Direct Drive spectrometer (7.15 T) equipped with a DOTY z-axis high-gradient diffusion probe. The gradient pulse strength g was arrayed from 10 to 1000 G cm−1 (32 values, linearly increased), the gradient pulse duration δ was 1.5 ms, and the diffusion delay Δ was 15 ms. The diffusion coefficient D was calculated by using following equation:
 | (1) |
Transference number of sodium electrolytes was measured using a symmetrical Na metal two-electrode cell with an electrode diameter of 11 mm and an electrolyte volume of 250 μL. Transference number was calculated using the potentiostatic polarization method established by Bruce and Vincent and used for dilute solutions with correction for contact resistance.37–39
Results and discussion
Na and Li are both alkali metals, have similar electronegativities (0.869 for Na+ and 0.912 for Li+ on the Allen scale), and similar cathodic plating potentials in the vicinity of 0–200 mV vs. Li/Li+ in carbonate electrolytes. The Pauling radii for Li+ and Na+ are 60 pm and 95 pm, respectively, making Na+ about 60% larger than Li+. Because of their alkali metal similarities, the initial assumptions of this study were that Na+ should exhibit similar solvation characteristics to Li+, though it was kept in mind that published computational results suggest that Na+ prefers EC, rather than PC, in EC:PC.34A. Raman spectroscopy and cation solvation numbers
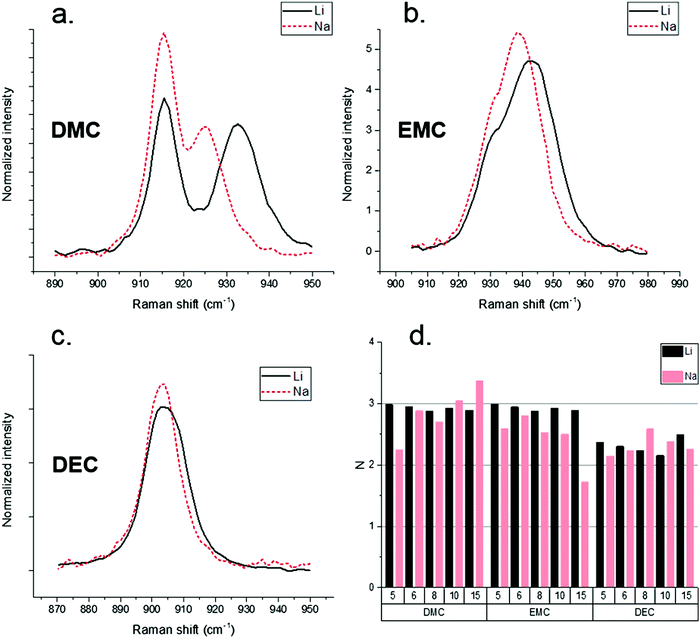
Raman spectroscopy provided an efficient tool to probe the Na–solvent interaction and compare Na+ and Li+ solvation numbers. Previous work performed by Allen et al. demonstrated that the racemic nature of PC as a solvent complicates the analysis of the solvated PC C![[double bond, length as m-dash]](https://www.rsc.org/images/entities/char_e001.gif) O peak.40 PC was therefore omitted from Raman analysis and attention focused on the linear carbonates DMC, EMC, and DEC. Raman spectroscopy results for solvent–Na+ and solvent–Li+ systems are shown in Fig. 1(a–c). The high activity vibrational band around 905 cm−1 of linear carbonate solvents with NaPF6 reveals a weaker Na–solvent interaction compared to Li–solvent interaction,41 with the Na+ solvation peak less separated from the parent unperturbed peak than the Li+ solvation peak. The Li+ and Na+ solvation numbers were extracted from Raman spectra assuming the same Raman activity of the solvent peaks with and without cation coordination.
O peak.40 PC was therefore omitted from Raman analysis and attention focused on the linear carbonates DMC, EMC, and DEC. Raman spectroscopy results for solvent–Na+ and solvent–Li+ systems are shown in Fig. 1(a–c). The high activity vibrational band around 905 cm−1 of linear carbonate solvents with NaPF6 reveals a weaker Na–solvent interaction compared to Li–solvent interaction,41 with the Na+ solvation peak less separated from the parent unperturbed peak than the Li+ solvation peak. The Li+ and Na+ solvation numbers were extracted from Raman spectra assuming the same Raman activity of the solvent peaks with and without cation coordination.
Fig. 1(d) demonstrates similar solvation numbers for the Li+ and Na+-based solvates. It is significant that solvation numbers are similar between Li+ and Na+. Note that due to very small peak separations between the solvated and un-solvated peaks for EMC and DEC compared to DMC solvates, the solvation numbers for DMC-based electrolytes are expected to be more accurate than for the NaPF6–EMC and NaPF6–DEC electrolytes. It should be noted that the cation solvation numbers by linear carbonate account only for the solvent in the cis–cis conformation around C–O–C![[double bond, length as m-dash]](https://www.rsc.org/images/entities/char_e001.gif) O dihedrals solvating cation via the carbonyl group, because the cis–trans conformers scatter at lower frequencies as demonstrated in DFT calculations41,42 and experiments.43 The derived solvation numbers by DMC also exclude the cation–DMC complexes with the solvation via non-carbonate oxygens.42 Previous Born–Oppenheimer molecular dynamics (BOMD) simulations of EC:DMC/LiPF6 mixtures, however, found a small but non-negligible population of Li+ solvating DMC via non-carbonate oxygens, especially at high concentration.42 Solvation numbers shown in Fig. 1(d) also assume that activity of the carbonyl ca. 905 cm−1 mode for DMC does not change upon cation complexation. DFT calculations of the NaPF6(DMC)4, NaPF6(DMC)5 complexes shown in Fig. S1 (ESI†) show that it is a reasonable approximation, while for more accurate predictions one should divide the solvation numbers by a/a0 = 0.93–0.95 ratio which represents the ratio of DMC bound to Na+vs. non-coordinated DMC. Thus, the Na+ and Li+ solvation numbers for linear carbonates should be treated as low bound estimates of the solvation numbers. Fig. S1 (ESI†) also shows that DMC ca. 905 cm−1 band shift upon complexation with Na+ is much smaller than the previously reported shift for DMC(cis–cis)/Li+ complexes.42
O dihedrals solvating cation via the carbonyl group, because the cis–trans conformers scatter at lower frequencies as demonstrated in DFT calculations41,42 and experiments.43 The derived solvation numbers by DMC also exclude the cation–DMC complexes with the solvation via non-carbonate oxygens.42 Previous Born–Oppenheimer molecular dynamics (BOMD) simulations of EC:DMC/LiPF6 mixtures, however, found a small but non-negligible population of Li+ solvating DMC via non-carbonate oxygens, especially at high concentration.42 Solvation numbers shown in Fig. 1(d) also assume that activity of the carbonyl ca. 905 cm−1 mode for DMC does not change upon cation complexation. DFT calculations of the NaPF6(DMC)4, NaPF6(DMC)5 complexes shown in Fig. S1 (ESI†) show that it is a reasonable approximation, while for more accurate predictions one should divide the solvation numbers by a/a0 = 0.93–0.95 ratio which represents the ratio of DMC bound to Na+vs. non-coordinated DMC. Thus, the Na+ and Li+ solvation numbers for linear carbonates should be treated as low bound estimates of the solvation numbers. Fig. S1 (ESI†) also shows that DMC ca. 905 cm−1 band shift upon complexation with Na+ is much smaller than the previously reported shift for DMC(cis–cis)/Li+ complexes.42
DFT calculations of the Li+(DMC) and Na+(DMC) complexes indicated a significantly smaller shift of not only Raman but also IR active bands for the Na+-based electrolyte compared to the Li+-based as shown in Fig. S2 (ESI†). The difference in shifts is attributable to the size difference between Li+ and Na+ and their interaction strength with solvents. DFT calculations performed on clusters yielded a significantly larger Na+–carbonate distance of 2.4–2.5 Å compared to the Li+–carbonate distance of 1.9 Å. A question arises from these calculations: if the Li+ cation was to be located as far from the solvent as the Na+ cation is, would it results in the similar shifts of vibrational bands as the Na+ cation? To answer this question, the band shifts were calculated using DFT (PBE/6-31+G(d,p), SMD(ether)) along the metal–DMC path (along the C![[double bond, length as m-dash]](https://www.rsc.org/images/entities/char_e001.gif) O bond). DFT calculations indicate that beyond the metal–oxygen separation of 2.4 Å, the influence of Na+ and Li+ on the band shifts is quite similar, and plotted in Fig. S2 (ESI†). This suggests that the interaction strength and the cation–DMC separation largely determine the band shift. When Li+ is moved from its most probable position of 1.9 Å to 2.4 Å, the Raman shift of the ∼903 cm−1 band is reduced by half, in agreement with the experimental results. A slightly smaller but still quite pronounced effect is observed for the C
O bond). DFT calculations indicate that beyond the metal–oxygen separation of 2.4 Å, the influence of Na+ and Li+ on the band shifts is quite similar, and plotted in Fig. S2 (ESI†). This suggests that the interaction strength and the cation–DMC separation largely determine the band shift. When Li+ is moved from its most probable position of 1.9 Å to 2.4 Å, the Raman shift of the ∼903 cm−1 band is reduced by half, in agreement with the experimental results. A slightly smaller but still quite pronounced effect is observed for the C![[double bond, length as m-dash]](https://www.rsc.org/images/entities/char_e001.gif) O IR active band as also shown in Fig. S2 (ESI†) and will be discussed below.
O IR active band as also shown in Fig. S2 (ESI†) and will be discussed below.
B. Infrared spectroscopy
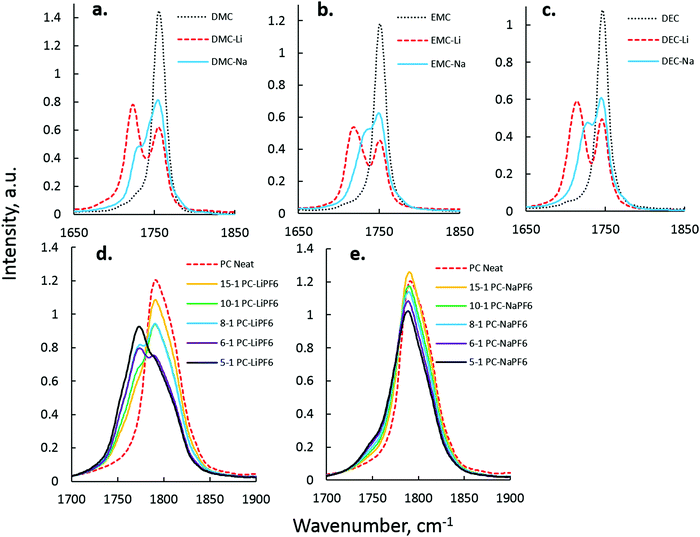
Na+–solvent interaction was next investigated in single-solvent electrolytes by FTIR.44 The C![[double bond, length as m-dash]](https://www.rsc.org/images/entities/char_e001.gif) O stretching mode (∼1808 cm−1 for PC, ∼1750 cm−1 for linear carbonates) was observed and compared to the C
O stretching mode (∼1808 cm−1 for PC, ∼1750 cm−1 for linear carbonates) was observed and compared to the C![[double bond, length as m-dash]](https://www.rsc.org/images/entities/char_e001.gif) O peak that arises due to Na+–carbonyl interaction. Fig. 2 shows the difference in C
O peak that arises due to Na+–carbonyl interaction. Fig. 2 shows the difference in C![[double bond, length as m-dash]](https://www.rsc.org/images/entities/char_e001.gif) O perturbation between Li+ and Na+ in DEC (a), DMC (b), EMC (c), and PC (d and e), with data on Li–solvent interaction quite similar to that presented in the spectroscopic work of Seo et al.44 Analysis of the EC–Na+ system, though fairly central to the study of carbonate-based electrolytes, was excluded due to Fermi resonance present in the IR spectra of EC vibration states.44–46Table 1 summarizes peak separations between Li+ and Na+ electrolyte spectra.
O perturbation between Li+ and Na+ in DEC (a), DMC (b), EMC (c), and PC (d and e), with data on Li–solvent interaction quite similar to that presented in the spectroscopic work of Seo et al.44 Analysis of the EC–Na+ system, though fairly central to the study of carbonate-based electrolytes, was excluded due to Fermi resonance present in the IR spectra of EC vibration states.44–46Table 1 summarizes peak separations between Li+ and Na+ electrolyte spectra.
![[thin space (1/6-em)]](https://www.rsc.org/images/entities/char_2009.gif) :
:![[thin space (1/6-em)]](https://www.rsc.org/images/entities/char_2009.gif) 1) to concentrated (5
1) to concentrated (5![[thin space (1/6-em)]](https://www.rsc.org/images/entities/char_2009.gif) :
:![[thin space (1/6-em)]](https://www.rsc.org/images/entities/char_2009.gif) 1) solutions
1) solutions
15![[thin space (1/6-em)]](https://www.rsc.org/images/entities/char_2009.gif) : :![[thin space (1/6-em)]](https://www.rsc.org/images/entities/char_2009.gif) 1 1 |
10![[thin space (1/6-em)]](https://www.rsc.org/images/entities/char_2009.gif) : :![[thin space (1/6-em)]](https://www.rsc.org/images/entities/char_2009.gif) 1 1 |
8![[thin space (1/6-em)]](https://www.rsc.org/images/entities/char_2009.gif) : :![[thin space (1/6-em)]](https://www.rsc.org/images/entities/char_2009.gif) 1 1 |
6![[thin space (1/6-em)]](https://www.rsc.org/images/entities/char_2009.gif) : :![[thin space (1/6-em)]](https://www.rsc.org/images/entities/char_2009.gif) 1 1 |
5![[thin space (1/6-em)]](https://www.rsc.org/images/entities/char_2009.gif) : :![[thin space (1/6-em)]](https://www.rsc.org/images/entities/char_2009.gif) 1 1 |
||||||
|---|---|---|---|---|---|---|---|---|---|---|
| Na+ | Li+ | Na+ | Li+ | Na+ | Li+ | Na+ | Li+ | Na+ | Li+ | |
| DMC | 26.06 | 30.40 | 26.28 | 29.72 | 26.28 | 30.40 | 26.51 | 30.18 | 26.51 | 30.40 |
| EMC | 21.12 | 36.00 | 19.97 | 36.00 | 19.29 | 35.77 | 19.51 | 36.68 | 18.37 | 36.00 |
| DEC | 21.23 | 31.76 | 20.55 | 32.29 | 19.86 | 31.99 | 21.01 | 31.99 | 20.78 | 32.68 |
In linear carbonates, it is clear that Na+ C![[double bond, length as m-dash]](https://www.rsc.org/images/entities/char_e001.gif) O peak separations are smaller than Li+ C
O peak separations are smaller than Li+ C![[double bond, length as m-dash]](https://www.rsc.org/images/entities/char_e001.gif) O peak separations. This is interpreted as a reduced effect of Na+ on C
O peak separations. This is interpreted as a reduced effect of Na+ on C![[double bond, length as m-dash]](https://www.rsc.org/images/entities/char_e001.gif) O stretching that is a direct consequence of weaker Na+–carbonate solvation coupling to the lower-dielectric linear carbonates. In cyclic carbonates such as PC, C
O stretching that is a direct consequence of weaker Na+–carbonate solvation coupling to the lower-dielectric linear carbonates. In cyclic carbonates such as PC, C![[double bond, length as m-dash]](https://www.rsc.org/images/entities/char_e001.gif) O shifts with Na+ were smaller than Li+, as seen in Fig. 2(d) and (e). The Fermi resonance of the PC C
O shifts with Na+ were smaller than Li+, as seen in Fig. 2(d) and (e). The Fermi resonance of the PC C![[double bond, length as m-dash]](https://www.rsc.org/images/entities/char_e001.gif) O vibration prevents accurate deconvolution of the PC–Na+ peak, as there was not sufficient separation from the parent uncoordinated PC peaks. However, in the PC–LiPF6 system, there is a clear development of PC–Li+ coordinated peaks at 1751 and 1775 cm−1 with increasing LiPF6 content. In the PC–NaPF6 system, some growth of the 1751/1775 cm−1 peaks with increasing NaPF6 content is observed, but is significantly less intense than in PC–LiPF6. This difference is interpreted as a reduced interaction strength and increased interaction length of PC–Na+ as compared to PC–Li+.
O vibration prevents accurate deconvolution of the PC–Na+ peak, as there was not sufficient separation from the parent uncoordinated PC peaks. However, in the PC–LiPF6 system, there is a clear development of PC–Li+ coordinated peaks at 1751 and 1775 cm−1 with increasing LiPF6 content. In the PC–NaPF6 system, some growth of the 1751/1775 cm−1 peaks with increasing NaPF6 content is observed, but is significantly less intense than in PC–LiPF6. This difference is interpreted as a reduced interaction strength and increased interaction length of PC–Na+ as compared to PC–Li+.
DFT calculations shown in Fig. S1 and S2 (ESI†) also show a much smaller shifts of the carbonyl band upon Na+ binding compared to Li+ binding. The C![[double bond, length as m-dash]](https://www.rsc.org/images/entities/char_e001.gif) O band for DMC was found to be red shifted by 21–23 cm−1 from DFT calculations (see Fig. S1, ESI†), which is only a few wave numbers smaller shift than the experimentally observed (see Table 1). A larger spread between shifts from 18 to 33 cm−1 indicates dependence of the C
O band for DMC was found to be red shifted by 21–23 cm−1 from DFT calculations (see Fig. S1, ESI†), which is only a few wave numbers smaller shift than the experimentally observed (see Table 1). A larger spread between shifts from 18 to 33 cm−1 indicates dependence of the C![[double bond, length as m-dash]](https://www.rsc.org/images/entities/char_e001.gif) O band shift on the environment and suggest broadening of the peak for DMC/Na+ compared to DMC liquid making extraction of the Na+ solvation numbers from IR spectrum more cumbersome. The PC C
O band shift on the environment and suggest broadening of the peak for DMC/Na+ compared to DMC liquid making extraction of the Na+ solvation numbers from IR spectrum more cumbersome. The PC C![[double bond, length as m-dash]](https://www.rsc.org/images/entities/char_e001.gif) O peak was found to be red shifted by only 5 cm−1 with a broad distribution of shifts from 0 to 13 cm−1 suggesting that extraction of the Na+ solvation numbers in PC from the IR C
O peak was found to be red shifted by only 5 cm−1 with a broad distribution of shifts from 0 to 13 cm−1 suggesting that extraction of the Na+ solvation numbers in PC from the IR C![[double bond, length as m-dash]](https://www.rsc.org/images/entities/char_e001.gif) O peak decomposition is going to be inaccurate.
O peak decomposition is going to be inaccurate.
C. Anion–cation coordination
The anion–cation coordination in DMC and PC electrolytes with NaPF6 and LiPF6 was probed via FTIR, focusing on the region of P–F stretch of PF6− around 845–877 cm−1. The PC–LiPF6 spectrum is shown in Fig. 3(a) is quite similar to the spectrum of PC–NaPF6 indicating similar interaction and degree of dissociation of PF6− from cation in these electrolytes. In order to aid interpretation of the PF6− vibrational bands, DFT calculations were performed on the LiPF6 and NaPF6-based solvates. The first situation examined was the P–F band shift due to monodentate (single F⋯Na+ coordination) PF6− binding to the Li+ and Na+ cations. Fig. S3 (ESI†) shows that the degenerate P–F stretch band of PF6− splits upon monodentate binding to a Li+ cation into three bands: one the has essentially the same position as the solvent separated ion pair (SSIP) or isolated PF6− in implicit solvent, while the other two bands are blue shifted by around 30 cm−1.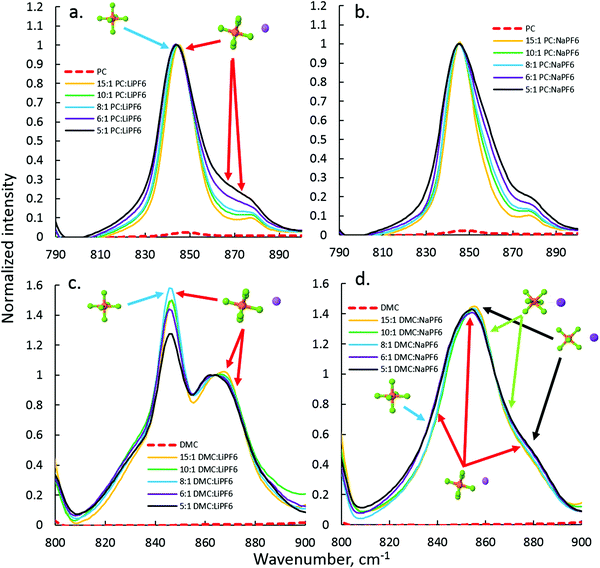 | ||
| Fig. 3 FTIR analysis of the PF6− stretch region for the PC–LiFP6 (a), PC–NaPF6 (b), DMC–LiPF6 (c), and DMC–NaPF6 (d) electrolytes. | ||
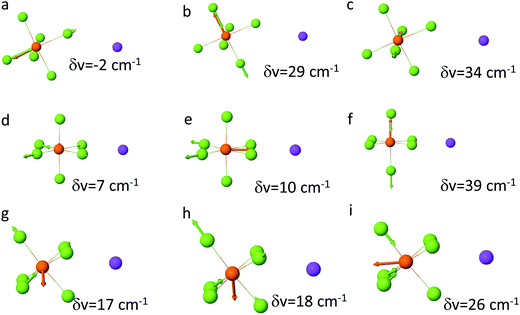
A similar picture is observed for the monodentate NaPF6 solvate shown in Fig. 4(a and b) with the exception of smaller shifts (∼20 cm−1) of the P–F stretch for NaPF6 compared to the LiPF6 monodentate solvate. DFT calculations show that the P–F stretch peak at 845 cm−1 should be attributed to both SSIP and contact ion pairs (CIP) and not only to SSIPs as was done in the previous FTIR study of the LiPF6-based electrolytes,44 while the peak ∼870 cm−1 is attributed to the PF6− anions coordinated by cation(s). Similarity of the 870 cm−1 shoulder (or peak) increase with increasing salt concentration in PC–NaPF6 and PC–LiPF6 indicates that the extent of the CIP formation and aggregation is similar in these electrolytes. Initial examination of the SSIP and CIP shows similar stability in DFT calculations, as demonstrated in Fig. S4 (ESI†). Thus, in dilute solution, PC–NaPF6 is expected to have about half of the salt dissociated, which is consistent with a low area under the 870 cm−1 peak (shoulder) for PC:Na >8. Because of similar stability of NaPF6(PC)5 SSIP and CIP solvates, Na+ coordination number (from oxygens of solvent and fluorine of PF6−) is expected to be in between 5 and 6. Comparison of mono- and bi-dentate binding indicates a preference for the monodentate binding by 2 kcal mol−1 compared to bi-dentate.
The DMC–LiPF6 and DMC–NaPF6 spectra shown in Fig. 3(c and d) were normalized to match the peak positions around 866 cm−1. This normalization made clear that magnitude of the 845 cm−1 peak, which has contributions from both SSIPs and CIPs, is noticeably smaller for the concentrated electrolytes (DMC![[thin space (1/6-em)]](https://www.rsc.org/images/entities/char_2009.gif) :
:![[thin space (1/6-em)]](https://www.rsc.org/images/entities/char_2009.gif) Li ≤ 6
Li ≤ 6![[thin space (1/6-em)]](https://www.rsc.org/images/entities/char_2009.gif) :
:![[thin space (1/6-em)]](https://www.rsc.org/images/entities/char_2009.gif) 1) compared to electrolytes with DMC
1) compared to electrolytes with DMC![[thin space (1/6-em)]](https://www.rsc.org/images/entities/char_2009.gif) :
:![[thin space (1/6-em)]](https://www.rsc.org/images/entities/char_2009.gif) Li ≥ 8
Li ≥ 8![[thin space (1/6-em)]](https://www.rsc.org/images/entities/char_2009.gif) :
:![[thin space (1/6-em)]](https://www.rsc.org/images/entities/char_2009.gif) 1 for DMC–LiPF6 electrolytes. Because the 845 cm−1 peak is attributed to both SSIPs and CIPs, its decrease compared to the CIP peak around 866 cm−1 upon increasing salt concentration clearly demonstrates the decrease of the fraction of SSIPs in DMC–LiPF6 with increasing salt concentration. The IR spectrum for DMC–NaPF6 looks quite different from the corresponding spectrum for DMC–LiPF6. No noticeable peak around 845 cm−1 is observed, indicating little or no SSIPs in DMC–NaPF6. In contrast to the DMC–LiPF6 spectrum, only a broad peak around 854 cm−1 and a shoulder around 880 cm−1 are observed, further suggesting heavy aggregation in DMC–NaPF6.
1 for DMC–LiPF6 electrolytes. Because the 845 cm−1 peak is attributed to both SSIPs and CIPs, its decrease compared to the CIP peak around 866 cm−1 upon increasing salt concentration clearly demonstrates the decrease of the fraction of SSIPs in DMC–LiPF6 with increasing salt concentration. The IR spectrum for DMC–NaPF6 looks quite different from the corresponding spectrum for DMC–LiPF6. No noticeable peak around 845 cm−1 is observed, indicating little or no SSIPs in DMC–NaPF6. In contrast to the DMC–LiPF6 spectrum, only a broad peak around 854 cm−1 and a shoulder around 880 cm−1 are observed, further suggesting heavy aggregation in DMC–NaPF6.
In order to clarify the puzzling difference between the DMC–LiPF6 and DMC–NaPF6 spectra additional DFT examination of the P–F band shifts in the PF6–cation complexes were performed. A recent study47 of the Raman active PF6− modes demonstrated a strong sensitivity of the PF6− vibrational modes to the relative position of the Li+ cation around PF6−. Following that work the shifts were calculated for the P–F stretch band upon Li+ and Na+ cation binding for the bidentate and tridentate binding scenarios as shown in Fig. 4(b and c). As expected from symmetry considerations, the tridentate shifts are similar to each other (17, 18, 26 cm−1), while bidentate shifts lead to more spread out peaks, with shifts of (7, 10, 39 cm−1). Using the DFT calculated shifts, we conclude that there is little or no SSIP or monodentate binding for NaPF6 in DMC due to absence of 845 cm−1 peak. The main peak around 855 cm−1 is due to combination of the bi- and tridentate binding, while the shoulder at 885 cm−1 largely is due to bidentate binding.
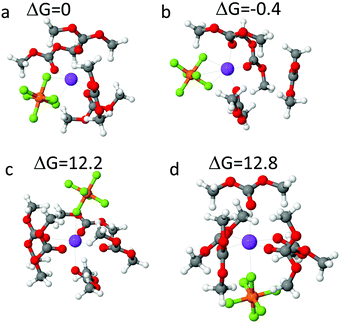
Free energies of the mono-, bi- and tridentate Na+ solvates in DMC were estimated from DFT calculations shown in Fig. 5. Free energy of the NaPF6(DMC)4 solvate shown in Fig. 5(a) surrounded by SMD(ether) implicit solvent was used as a reference. The tri-dentate complex shown in Fig. 5(b) has one DMC desolvated from the Na+ cation was found to be slightly more stable, with free energy 0.4 kcal mol−1 lower than the bi-dentate complex. Free energy of NaPF6(DMC)5 mono-dentate complex formation is 12.2–12.8 kcal mol−1, indicating that mono-dentate NaPF6 binding is significantly less probable energetically. Thus, the solvate stabilities estimated from DFT calculations indicating the ratio of bi- to tri-dentate NaPF6 complexes of 1:2 are in accord with analysis of the IR spectra of PF6− anion shown in Fig. 3.
D. Electrolyte conductivity
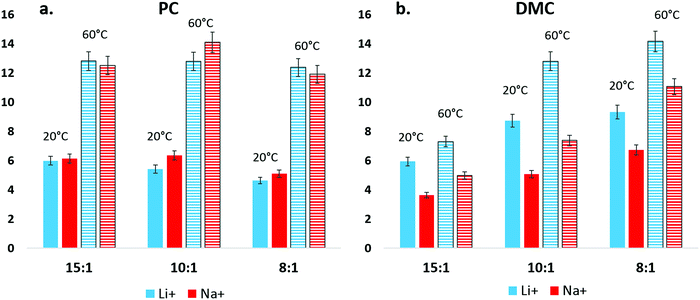
The conductivity of NaPF6 and LiPF6 was compared between a linear carbonate and a cyclic carbonate, DMC and PC, and results are plotted in Fig. 6. Here, differences in the ion pairing/aggregation behavior of Na+ and Li+ become apparent. In Fig. 6(a), the conductivity of Na+ in DMC is seen to be lower than Li+ in all tested solvent:salt compositions and temperatures. In contrast, conductivity differences between Na+ and Li+ in PC solution are nearly indistinguishable within error. Spectroscopic and computational results indicate that DMC–Na+ binding is weaker than DMC–Li+, and it is unlikely that Na+ conductivity is reduced by a persistent, strongly bound solvation shell as compared to Li+. Therefore, the DMC conductivity result can be interpreted as a difference in the amount of aggregation that Na+ and Li+ experience in DMC solution, though this inference is limited as the contributions of PF6− to conductivity for Na+ and Li+ in DMC is not explicitly known. By the same reasoning, while Na+ appears to have a weaker association with PC than Li+ in IR, the high dielectric of the PC solution prevents a measurable decrease of Na+ conductivity compared to Li+.The question then becomes: if the solvent–Na+ interaction is less intense than solvent–Li+ for carbonate solvents, will there be a consequence for competitive binding between Na+ and cyclic/linear carbonate solvent combinations?
E. Electrospray ionization mass spectrometry and competitive solvation trends
To answer the question of solvent preference, gas-phase electrospray ionization mass spectrometry (ESI-MS) was used to sample solvation competition trends for Na+. ESI-MS employs comparatively harsh experimental conditions compared to FTIR/Raman spectroscopy, and probes strong and relatively long-lasting solvent–ion interactions. In previous work, relatively dilute solutions of 1.0 M (∼11![[thin space (1/6-em)]](https://www.rsc.org/images/entities/char_2009.gif) :
:![[thin space (1/6-em)]](https://www.rsc.org/images/entities/char_2009.gif) 1 solvent
1 solvent![[thin space (1/6-em)]](https://www.rsc.org/images/entities/char_2009.gif) :
:![[thin space (1/6-em)]](https://www.rsc.org/images/entities/char_2009.gif) salt), Li+ exhibited a preference for high polarity cyclic carbonates over linear carbonates. Additionally, it was observed that PC is favored over EC by the Li+ ion.
salt), Li+ exhibited a preference for high polarity cyclic carbonates over linear carbonates. Additionally, it was observed that PC is favored over EC by the Li+ ion.
As Fig. 7 shows, ESI-MS observes Na+ solvation trends that are nearly identical to Li+. The distinct similarity of Na+ and Li+ in favored association with solvents indicates that although Na+ is larger, more polarizable, and appears to interact more weakly with solvents than Li+, its preferred association with solvents remains the same as Li+. Competition between EC and the ether dimethoxyethane (DME) for Na+ is also similar to Li+.
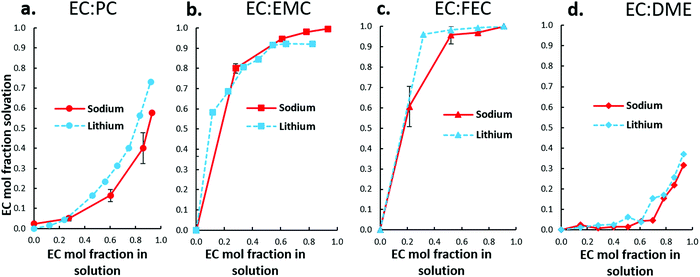 | ||
| Fig. 7 ESI-MS solvation analysis of Na+ in four electrolyte solutions containing EC, including (a) EC:PC, (b) EC:EMC, and (c) EC:FEC. (d) Shows similar solvation trends between Li+/Na+ in EC:DME. | ||
An interesting difference is noted in the EC:PC system, Fig. 7(a). For both Li+ and Na+, PC is the preferred solvent. At most EC:PC fractions (within uncertainty), Na+ favors PC even more than Li+, shown by the greater depression of the Na+ solvation curve. It is clear, therefore, that Na+ solvent preferences compared to Li+ are largely unaffected by weaker solvent–Na+ association.
F. Nuclear magnetic resonance
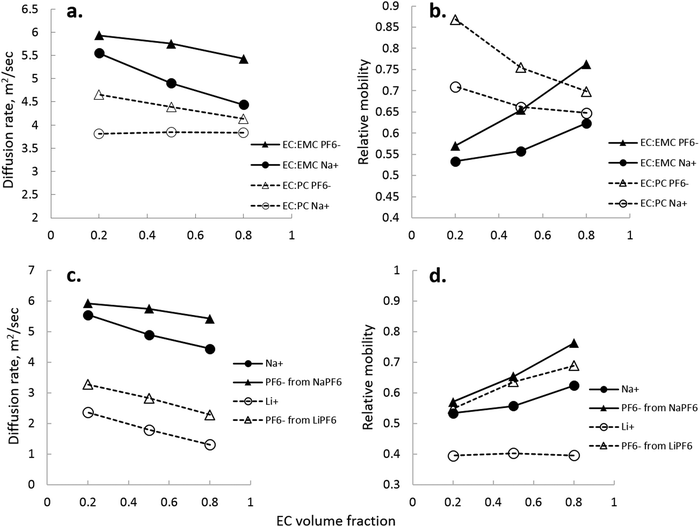
NMR, being an extremely versatile technique, allowed measurement of both Na+ and PF6− diffusion in two key electrolytes that are important to the development of Na-ion batteries: EC:EMC and EC:PC. Fig. 8 shows calculated values of diffusion for Na+ and PF6−, and directly compared NaPF6 and LiPF6 in EC:EMC. In Fig. 8, the viscosity-correcting value “relative mobility” is calculated by , where DEC is the diffusion rate of EC in the electrolyte.
Several interesting comparisons arise between the EC:EMC and EC:PC solvent systems containing 1 M NaPF6. Diffusion rates of both ions in EC:EMC are higher, seen in Fig. 8(a), owing to the lower viscosity of the EC:EMC electrolytes compared to EC:PC. However, Na+ is significantly more mobile, correcting for solvent viscosity, in EC:PC compared to EC:EMC. This is most likely due to significant contact ion pair and aggregate formation in EC:EMC at low EC fraction, which is quite clear in Fig. 8(b) where Na+ and PF6− mobility are nearly equal. NMR observations also show that Na+/PF6− are better separated in PC-rich solution rather than EC-rich solutions. In Fig. 8(a and b), the difference between Na+/PF6− diffusion rate and mobility in EC:PC narrows as EC fraction increases, even though the dielectric of the solution increases as EC fraction increases. While this is not an indicator of Na+ preference of PC or EC, it does seem to be consistent with the observation that Na+ clusters prefer to have PC over EC as observed by ESI-MS.
Comparing Li+ to Na+ in EC:EMC in Fig. 8(c), there is a greater indication of ion pairs and aggregates, which is seen for Na+/PF6− as the rates of Na+ and PF6− approach each other at low EC content. A direct comparison of Na+ and Li+ diffusion rates is not made, as Li+ diffusion was measured at 298 K and Na+ diffusion at 333 K due to NMR requirements for measuring 23Na. Supporting the notion of contact pairs and aggregates is the transference number of Na+, which was measured to be 0.56 ± 0.12 in EC![[thin space (1/6-em)]](https://www.rsc.org/images/entities/char_2009.gif) :
:![[thin space (1/6-em)]](https://www.rsc.org/images/entities/char_2009.gif) DMC 2
DMC 2![[thin space (1/6-em)]](https://www.rsc.org/images/entities/char_2009.gif) :
:![[thin space (1/6-em)]](https://www.rsc.org/images/entities/char_2009.gif) 8 (vol) and 0.38 ± 0.09 in EC
8 (vol) and 0.38 ± 0.09 in EC![[thin space (1/6-em)]](https://www.rsc.org/images/entities/char_2009.gif) :
:![[thin space (1/6-em)]](https://www.rsc.org/images/entities/char_2009.gif) DMC 8
DMC 8![[thin space (1/6-em)]](https://www.rsc.org/images/entities/char_2009.gif) :
:![[thin space (1/6-em)]](https://www.rsc.org/images/entities/char_2009.gif) 2 (vol). This means at EC
2 (vol). This means at EC![[thin space (1/6-em)]](https://www.rsc.org/images/entities/char_2009.gif) :
:![[thin space (1/6-em)]](https://www.rsc.org/images/entities/char_2009.gif) DMC 2
DMC 2![[thin space (1/6-em)]](https://www.rsc.org/images/entities/char_2009.gif) :
:![[thin space (1/6-em)]](https://www.rsc.org/images/entities/char_2009.gif) 8, Na+ is less encumbered by solvation than Li+ (transference number of ∼0.4). The lower transference number of Na+ in EC
8, Na+ is less encumbered by solvation than Li+ (transference number of ∼0.4). The lower transference number of Na+ in EC![[thin space (1/6-em)]](https://www.rsc.org/images/entities/char_2009.gif) :
:![[thin space (1/6-em)]](https://www.rsc.org/images/entities/char_2009.gif) DMC 8:2 is quite reminiscent of the transference number of Li+ in EC
DMC 8:2 is quite reminiscent of the transference number of Li+ in EC![[thin space (1/6-em)]](https://www.rsc.org/images/entities/char_2009.gif) :
:![[thin space (1/6-em)]](https://www.rsc.org/images/entities/char_2009.gif) DMC 2
DMC 2![[thin space (1/6-em)]](https://www.rsc.org/images/entities/char_2009.gif) :
:![[thin space (1/6-em)]](https://www.rsc.org/images/entities/char_2009.gif) 8.
8.
Fig. 8(d) shows how closely Na+ mobility is correlated to PF6− mobility in EC:EMC, and how sensitive they are to EC content. Li+ mobility is not significantly changed in the EC:EMC range measured, owing to the fact that EC is an strong Li+-coordinating solvent and maintains separation of ions even at an EC fraction of 0.2. While IR and Raman spectroscopy were not used to quantify the Na+–EC interaction strength, Fig. 8(d) suggests that it is weaker than Li–solvent. Na+ and PF6− mobilities are much more closely correlated than Li+ and PF6− at 0.2 EC, and this trend continues through the EC:EMC range.
NMR spectroscopy was also used extensively to study condensed-phase interactions in carbonate-based electrolytes containing Na+. Because of the interactions between solvent oxygen and Na+, both 17O and 23Na were employed as atomic probes of the solvation behavior of 23Na. In existing literature, EC:PC has become a fairly standard electrolyte for sodium ion battery studies, and therefore is of particular interest to this work. Chemical shifts in Fig. 9 and 10 are presented as difference between the Na-containing electrolyte and a salt-free EC:PC solution of the same EC:PC ratio:
Δppm = δelectrolyte − δneat![[thin space (1/6-em)]](https://www.rsc.org/images/entities/char_2009.gif) solvent solvent | (2) |
![[thin space (1/6-em)]](https://www.rsc.org/images/entities/char_2009.gif) solvent, the chemical shift of the corresponding neat solvent. This simple operation removes solvent–solvent interactions from the ion-related chemical shift data, which would otherwise complicate interpretation of solvent–ion interactions. Data presented in Fig. 9 and 10 is thus expressed as a relative shift from the neat solvent, with positive numbers indicating a downfield shift (de-shielding) from the neat solvent, and negative numbers indicating an upfield shift (shielding).
solvent, the chemical shift of the corresponding neat solvent. This simple operation removes solvent–solvent interactions from the ion-related chemical shift data, which would otherwise complicate interpretation of solvent–ion interactions. Data presented in Fig. 9 and 10 is thus expressed as a relative shift from the neat solvent, with positive numbers indicating a downfield shift (de-shielding) from the neat solvent, and negative numbers indicating an upfield shift (shielding).
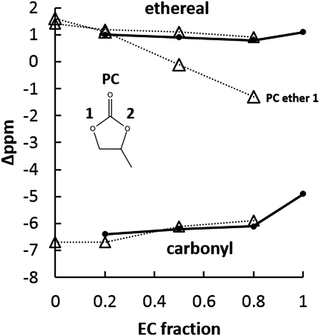
Fig. 9 summarizes carbonyl oxygen and ether oxygen responses from the EC:PC solvent system containing NaPF6. Concerning the carbonyl oxygens, it is clear that EC and PC carbonyl shifts are quite similar across all tested EC:PC fractions. Second, the PC carbonyl at pure PC is further upfield from the pure EC carbonyl with Na+ in solution. The similarity of the EC and PC carbonyl shifts was quite unexpected, given the indication from ESI-MS that there was a significant preference for PC-rich clusters over most EC:PC fractions. In such a situation of PC preference, it was thought that the PC carbonyl would experience a larger magnitude chemical shift reflecting its greater perturbation over time compared to EC. Since this is not the case, the explanation for the difference in solvation preference of PC must come from another source: the ether 17O shift.
17O NMR reveals significant shifting of the PC non-methyl-side ether. In pure PC solution with 1 M NaPF6, both PC ethers have a similar ∼2 ppm downfield chemical shift. As EC fraction increases, the PC non-methyl ether shift moves from 2 ppm downfield to 2 ppm upfield. At EC![[thin space (1/6-em)]](https://www.rsc.org/images/entities/char_2009.gif) :
:![[thin space (1/6-em)]](https://www.rsc.org/images/entities/char_2009.gif) PC 1
PC 1![[thin space (1/6-em)]](https://www.rsc.org/images/entities/char_2009.gif) :
:![[thin space (1/6-em)]](https://www.rsc.org/images/entities/char_2009.gif) 1, the shift of the PC non-methyl ether is quite close to 0. EC ethers, which are equivalent, and the PC methyl-side ether remain largely unchanged as EC concentration increases. From an NMR perspective, this continuous upfield shifting indicates the PC non-methyl-side ether oxygen is going from a de-shielded condition to a shielded one compared to salt-free PC. Any significant chemical shift by carbonate ether oxygens is quite interesting considering their limited participation in the solvation of Li+.
1, the shift of the PC non-methyl ether is quite close to 0. EC ethers, which are equivalent, and the PC methyl-side ether remain largely unchanged as EC concentration increases. From an NMR perspective, this continuous upfield shifting indicates the PC non-methyl-side ether oxygen is going from a de-shielded condition to a shielded one compared to salt-free PC. Any significant chemical shift by carbonate ether oxygens is quite interesting considering their limited participation in the solvation of Li+.
The changing condition of the PC non-methyl-side ether indicates that the asymmetry of the PC molecule may be enhancing its chances of solvating Na+ compared to EC, especially considering the larger volume of the first solvation shell afforded by Na+ compared to Li+. Given that carbonyl interaction fails to indicate any solvent-specific behavior in the solvation of Na+, the changing electronic environment of the PC non-methyl-side ether may explain why PC is able to participate actively in the solvation of Na+.
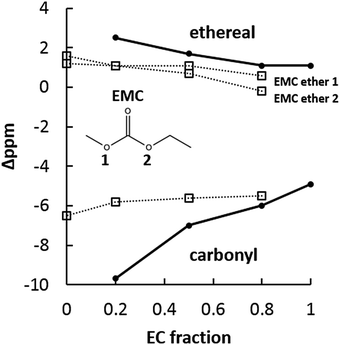
The EC:EMC electrolyte system with NaPF6 provides a better comparison to standard Li-ion electrolytes, as EC:PC is generally avoided in Li-ion batteries except when high concentrations of salt (>1 M) are used.48,49Fig. 10 shows 17O NMR for the EC:EMC system with 1 M NaPF6. Like the EC:PC system, carbonyl oxygens are significantly upfield from ether oxygens. Unlike the smaller, locked-together carbonyl shifts of EC and PC, in the EC:EMC system the EC carbonyl shifts dramatically downfield from −10 ppm to −4.9 ppm as EC fraction increases. The EMC carbonyl, by comparison, is shifted less upfield than the EC carbonyl and its downfield movement is halted as EC fraction increases. Some upfield movement is noted for both EC and EMC ethers. The large EC carbonyl 17O shift suggests significant participation of the EC carbonyl in Na+ solvation, which is consistent with 17O behavior observed in the lithium system with EC:EMC.
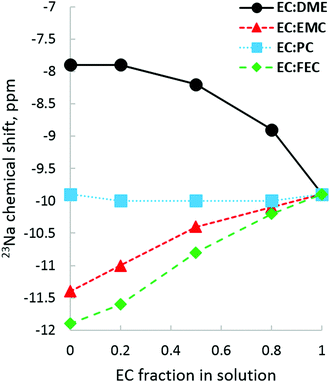
23Na NMR allows us to examine solvation from the perspective of the Na+ ion. Fig. 11 plots 23Na shifts in each pure solvent on the y-axis and tracks how the addition of EC affects that chemical shift. Quite visible is the fact that DME shifts 23Na more downfield than any of the carbonates tested, which is an indication of its strong de-shielding of the 23Na nucleus compared to carbonates. The distinctly non-linear upfield shift as EC fraction increases reflects the difference between DME bidentate solvation and EC carbonate solvation. For the EC:PC system, 23Na upfield shifts indicate that neither EC nor PC have a significantly different effect on the electronic environment of the 23Na nucleus, in seeming agreement with the lack of difference in carbonate 17O shifts. There is no indication by 23Na that there is preference for EC over PC; in fact, the 23Na shifts for pure EC and PC are nearly identical, though it is likely that the highly time-averaged and bulk-phase nature of NMR observation allows 23Na to sample many solvation environments, erasing traces of specific preferential interactions. When it comes to solvents where EC has a competitive advantage, as it is in the case with EC:EMC and EC:FEC, there is a linear downfield movement from pure FEC/EMC as EC fraction increases and Na+ becomes increasingly de-shielded, with EC:FEC having a greater upfield slope than EC:EMC.
G. Sodium ion battery hard carbon anode cycling analysis
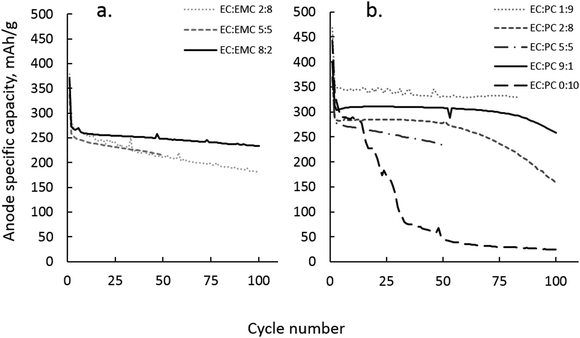
The situation becomes more complex when considering the interplay of solvation in a working EC:PC or EC:EMC electrolyte in a sodium ion battery. In lithium ion batteries, PC with dilute lithium salt (∼1 M LiPF6) is avoided as a solvent due to exfoliation problems during initial graphite lithiation. Because of the preference for PC by Li+, the mere presence of EC is not sufficient to prevent graphite exfoliation; EC must be present in volume fractions of at least 0.7 with PC to form a protective interphase layer.7 Sodium ion batteries do not use graphite as anode materials, and therefore have no exfoliation-based restrictions on the use of PC. PC is still a poor SEI former, even on hard carbon anodes, and must be supplemented with a co-solvent or additive that can form a durable SEI, as shown in Fig. 12(b).In Fig. 12(a), it is apparent that significant EC is required in EC:EMC with 1 M NaPF6 to ensure effective electrode passivation and battery performance. In the equivalent lithium system with 1 M LiPF6, acceptable cycling performance in the graphite:LiCoO2 system can be achieved with EC![[thin space (1/6-em)]](https://www.rsc.org/images/entities/char_2009.gif) :
:![[thin space (1/6-em)]](https://www.rsc.org/images/entities/char_2009.gif) EMC 2
EMC 2![[thin space (1/6-em)]](https://www.rsc.org/images/entities/char_2009.gif) :
:![[thin space (1/6-em)]](https://www.rsc.org/images/entities/char_2009.gif) 8. This is not true in the EC:EMC 1 M NaPF6 system, where significant fade is observed for electrolytes with less than 80% EC. The implication is that the preference of EC by Na+ is overshadowed by weak Na+–solvent association, and the passivation of the hard carbon anode occurs in an environment where the overall solution dielectric is low and EC is less vulnerable to reduction due to the cation solvation effect. EC:EMC performed poorly compared to EC:PC, with a repeatable tendency toward greater capacity fade and lower capacity utilization of the hard carbon. While poor conductivity of Na+ by EMC may be partly to blame, there may also be a component of salt aggregation due to weak Na+–EMC interaction that is only moderated by the use of large proportions of EC.
8. This is not true in the EC:EMC 1 M NaPF6 system, where significant fade is observed for electrolytes with less than 80% EC. The implication is that the preference of EC by Na+ is overshadowed by weak Na+–solvent association, and the passivation of the hard carbon anode occurs in an environment where the overall solution dielectric is low and EC is less vulnerable to reduction due to the cation solvation effect. EC:EMC performed poorly compared to EC:PC, with a repeatable tendency toward greater capacity fade and lower capacity utilization of the hard carbon. While poor conductivity of Na+ by EMC may be partly to blame, there may also be a component of salt aggregation due to weak Na+–EMC interaction that is only moderated by the use of large proportions of EC.
The EC:PC electrolyte system presented similar difficulties in interpreting passivation behavior as a function of Na+ solvation. ESI-MS indicated that PC is favored over EC in Na+ solvation, in practice the EC![[thin space (1/6-em)]](https://www.rsc.org/images/entities/char_2009.gif) :
:![[thin space (1/6-em)]](https://www.rsc.org/images/entities/char_2009.gif) PC ratio did not correlate well with performance. As Fig. 12(b) shows, electrolytes of the composition EC
PC ratio did not correlate well with performance. As Fig. 12(b) shows, electrolytes of the composition EC![[thin space (1/6-em)]](https://www.rsc.org/images/entities/char_2009.gif) :
:![[thin space (1/6-em)]](https://www.rsc.org/images/entities/char_2009.gif) PC 1
PC 1![[thin space (1/6-em)]](https://www.rsc.org/images/entities/char_2009.gif) :
:![[thin space (1/6-em)]](https://www.rsc.org/images/entities/char_2009.gif) 9 with 1 M NaPF6 cycled well, with less than 5% capacity loss over 100 cycles at a rate of ∼C/24. Conversely, EC
9 with 1 M NaPF6 cycled well, with less than 5% capacity loss over 100 cycles at a rate of ∼C/24. Conversely, EC![[thin space (1/6-em)]](https://www.rsc.org/images/entities/char_2009.gif) :
:![[thin space (1/6-em)]](https://www.rsc.org/images/entities/char_2009.gif) PC 1
PC 1![[thin space (1/6-em)]](https://www.rsc.org/images/entities/char_2009.gif) :
:![[thin space (1/6-em)]](https://www.rsc.org/images/entities/char_2009.gif) 1 displayed a higher fade rate than EC
1 displayed a higher fade rate than EC![[thin space (1/6-em)]](https://www.rsc.org/images/entities/char_2009.gif) :
:![[thin space (1/6-em)]](https://www.rsc.org/images/entities/char_2009.gif) PC 1
PC 1![[thin space (1/6-em)]](https://www.rsc.org/images/entities/char_2009.gif) :
:![[thin space (1/6-em)]](https://www.rsc.org/images/entities/char_2009.gif) 9 and greater cycling longevity than more EC-rich EC
9 and greater cycling longevity than more EC-rich EC![[thin space (1/6-em)]](https://www.rsc.org/images/entities/char_2009.gif) :
:![[thin space (1/6-em)]](https://www.rsc.org/images/entities/char_2009.gif) PC electrolytes. In the case of EC
PC electrolytes. In the case of EC![[thin space (1/6-em)]](https://www.rsc.org/images/entities/char_2009.gif) :
:![[thin space (1/6-em)]](https://www.rsc.org/images/entities/char_2009.gif) PC 1
PC 1![[thin space (1/6-em)]](https://www.rsc.org/images/entities/char_2009.gif) :
:![[thin space (1/6-em)]](https://www.rsc.org/images/entities/char_2009.gif) 9, ESI-MS estimates that 10% EC in solution equates to about 5% EC in Na+ solvation from Fig. 7(a). Apparently, such a small representation of EC in EC:PC is sufficient to form a functional SEI while the PC majority solvent provides cathodic stability and sufficient Na+ conductivity. Such a situation could not be repeated in a lithium battery, where PC preference by Li+ dominates anode passivation chemistry and requires significant excess of EC, at least EC
9, ESI-MS estimates that 10% EC in solution equates to about 5% EC in Na+ solvation from Fig. 7(a). Apparently, such a small representation of EC in EC:PC is sufficient to form a functional SEI while the PC majority solvent provides cathodic stability and sufficient Na+ conductivity. Such a situation could not be repeated in a lithium battery, where PC preference by Li+ dominates anode passivation chemistry and requires significant excess of EC, at least EC![[thin space (1/6-em)]](https://www.rsc.org/images/entities/char_2009.gif) :
:![[thin space (1/6-em)]](https://www.rsc.org/images/entities/char_2009.gif) PC 7
PC 7![[thin space (1/6-em)]](https://www.rsc.org/images/entities/char_2009.gif) :
:![[thin space (1/6-em)]](https://www.rsc.org/images/entities/char_2009.gif) 3, to properly passivate a graphite anode.
3, to properly passivate a graphite anode.
Therefore, in Na-ion batteries, it appears that battery performance is significantly decoupled from Na+–solvent interaction as compared to the effect of solvation interaction in Li-ion batteries. With less solvation meaning that there can be more freedom in choosing solvent systems that exploit SEI-forming additives and high conductivity redox-stable solvents. With EC effectively reduced to the role of SEI former, new electrolyte chemistries optimized to Na anodes and cathodes are poised to make leaps in the capacity and utility of Na-ion batteries as a cheap electrochemical energy storage technology.
Conclusions
The solvation trends of the Na+ ion have some similarity with the Li+ ion in carbonate electrolytes, with a few key differences. While the Li+ and Na+ solvation numbers from Raman measurements are found to be similar in linear carbonates, IR spectra of PF6− anion are quite different with mono-dentate LiPF6 binding prevailing in LiPF6–DMC, and a combination of bi- and tri-dentate binding dominating in NaPF6–DMC in agreement with the free energies of solvates estimated from DFT cluster – continuum calculations. Combined analysis indicates that while the Li+ cation is coordinated by roughly four carbonate oxygens and fluorines of PF6−, the Na+ coordination number in DMC is slightly below six: with about ∼3.1 carbonyl oxygens and ∼2.5 fluorine atoms from PF6−. While the coordination number of carbonyl oxygens and fluorine (from PF6−) are quite different (6 vs. 4) for LiPF6 and NaPF6 the overall number of anions near Li+ and Na+ differ less dramatically giving rise to slightly higher aggregation and lower conductivity up to a factor of two in NaPF6–DMC vs. LiPF6–DMC. On the other hand, IR spectra of LiPF6 and NaPF6 in PC indicated strong dissociation of salt compared to DMC-based electrolytes and the state of PF6− aggregation being quite similar for both LiPF6–PC and NaPF6–PC, which is in accord with similar conductivities and relative ion mobilities found in these electrolytes. DFT cluster continuum calculations indicate the Na+ coordination number by solvent oxygens and fluorines of PF6− in PC to be between 5 and 6.Electrospray mass spectrometry reveals that competitive solvation trends in the gas phase are practically identical within uncertainty for Na+ and Li+, but careful NMR analysis reveals that Na+ binds more weakly to EC than Li+, leading to greater Na salt aggregation in EC-containing electrolytes like EC:EMC. NMR also indicated that the asymmetric PC non-methyl ether may participate in the solvation of Na+, which is not expected in the Li+ system. While consistent with mass spectrometry results, more thorough validation of this result with additional NMR analysis and computational modeling is needed. While Li+ solvation for lithium ion batteries plays a key role in SEI formation and development, cell cycling tests indicate that Na+ solvation may play a reduced role in the formation of a protective anode SEI. The consequences of weaker Na+ interaction with solvents are still to be explored fully, but it is likely that Na+ electrolytes can take advantage of the high permittivity and wider liquid range of PC while supplementing SEI growth with low-percentage co-solvents and/or additives.
Acknowledgements
The authors would like to acknowledge the assistance of Dr Yue Li of the University of Maryland for performing ESI-MS data collection using neat sodium electrolytes. This research was supported in part by an appointment to the U.S. Army Research Laboratory Postdoctoral Fellowship Program administered by the Oak Ridge Associated Universities through a cooperative agreement with the U.S. Army Research Laboratory. The work at Hunter College was supported by a grant from the U.S. Office of Naval Research, and the Hunter NMR facility is funded by a National Institutes of Health RCMI infrastructure grant (MD007599).References
- D. P. Abraham, M. M. Furczon, S. H. Kang, D. W. Dees and A. N. Jansen, J. Power Sources, 2008, 180, 612–620 CrossRef CAS
.
- J. Alvarenga, P. R. Jarosz, C. M. Schauerman, B. T. Moses, B. J. Landi, C. D. Cress and R. P. Raffaelle, Appl. Phys. Lett., 2010, 97, 182106 CrossRef
.
- C. Ban, Z. li, Z. Wu, M. J. Kirkham, L. Chen, Y. S. Jung, E. A. Payzant, Y. Yan, M. S. Whittingham and A. C. Dillon, Adv. Energy Mater., 2011, 1, 58–62 CrossRef CAS
.
- C. K. Chan, X. F. Zhang and Y. Cui, Nano Lett., 2007, 8, 307–309 CrossRef PubMed
.
- Y. H. Chen, C. W. Wang, G. Liu, X. Y. Song, V. S. Battaglia and A. M. Sastry, J. Electrochem. Soc., 2007, 154, A978–A986 CrossRef CAS
.
- S.-L. Chou, Y. Zhao, J.-Z. Wang, Z.-X. Chen, H.-K. Liu and S.-X. Dou, J. Phys. Chem. C, 2010, 114, 15862–15867 CAS
.
- A. v. Cresce, O. A. Borodin and K. Xu, J. Phys. Chem. C, 2012, 116, 26111–26117 Search PubMed
.
- B. J. Landi, C. D. Cress and R. P. Raffaelle, J. Mater. Res., 2010, 25, 1636–1644 CrossRef CAS
.
- B. J. Landi, M. J. Ganter, C. D. Cress, R. A. DiLeo and R. P. Raffaelle, Energy Environ. Sci., 2009, 2, 638–654 CAS
.
- P. Larsson, R. Ahuja, A. Nyten and J. O. Thomas, Electrochem. Commun., 2006, 8, 797–800 CrossRef CAS
.
- M. E. Spahr, D. Goers, A. Leone, S. Stallone and E. Grivei, J. Power Sources, 2011, 196, 3404–3413 CrossRef CAS
.
- H. Y. Kang, Y. C. Liu, K. Z. Cao, Y. Zhao, L. F. Jiao, Y. J. Wang and H. T. Yuan, J. Mater. Chem. A, 2015, 3, 17899–17913 CAS
.
- M. D. Slater, D. Kim, E. Lee and C. S. Johnson, Adv. Funct. Mater., 2013, 23, 947–958 CrossRef CAS
.
- B. L. Ellis and L. F. Nazar, Curr. Opin. Solid State Mater. Sci., 2012, 16, 168–177 CrossRef CAS
.
-
CRC Handbook of Chemistry and Physics, ed. W. M. Haynes, CRC Press/Taylor & Francis, Boca Raton, FL, 97th edn, 2017 Search PubMed
.
- A. J. Fernández-Ropero, D. Saurel, B. Acebedo, T. Rojo and M. Casas-Cabanas, J. Power Sources, 2015, 291, 40–45 CrossRef
.
- J. Wang, C. Luo, T. Gao, A. Langrock, A. C. Mignerey and C. Wang, Small, 2014, 473–481, DOI:10.1002/smll.201401521
.
- E. M. Lotfabad, J. Ding, K. Cui, A. Kohandehghan, W. P. Kalisvaart, M. Hazelton and D. Mitlin, ACS Nano, 2014, 8, 7115–7129 CrossRef CAS PubMed
.
- L. Fu, K. Tang, K. Song, P. A. van Aken, Y. Yu and J. Maier, Nanoscale, 2014, 6, 1384–1389 RSC
.
- L. David, R. Bhandavat and G. Singh, ACS Nano, 2014, 8, 1759–1770 CrossRef CAS PubMed
.
- C. Bommier, W. Luo, W.-Y. Gao, A. Greaney, S. Ma and X. Ji, Carbon, 2014, 76, 165–174 CrossRef CAS
.
- Y. Zhu, Y. Xu, Y. Liu, C. Luo and C. Wang, Nanoscale, 2013, 5, 780–787 RSC
.
- H. Zhu, Z. Jia, Y. Chen, N. Weadock, J. Wan, O. Vaaland, X. Han, T. Li and L. Hu, Nano Lett., 2013, 13, 3093–3100 CrossRef CAS PubMed
.
- W.-J. Li, S.-L. Chou, J.-Z. Wang, H.-K. Liu and S.-X. Dou, Nano Lett., 2013, 13, 5480–5484 CrossRef CAS PubMed
.
- S.-W. Kim, D.-H. Seo, X. Ma, G. Ceder and K. Kang, Adv. Energy Mater., 2012, 2, 710–721 CrossRef CAS
.
- X. Xie, M.-Q. Zhao, B. Anasori, K. Maleski, C. E. Ren, J. Li, B. W. Byles, E. Pomerantseva, G. Wang and Y. Gogotsi, Nano Energy, 2016, 26, 513–523 CrossRef CAS
.
- Y.-X. Yu, J. Phys. Chem. C, 2016, 120, 5288–5296 CAS
.
- A. von Cresce and K. Xu, Electrochem. Solid-State Lett., 2011, 14, A154–A156 CrossRef CAS
.
- A. von Cresce and K. Xu, J. Electrochem. Soc., 2011, 158, A337 CrossRef CAS
.
- K. Xu, Chem. Rev., 2014, 114, 11503–11618 CrossRef CAS PubMed
.
- K. Xu and A. von Cresce, J. Mater. Chem., 2011, 21, 9849–9864 RSC
.
- R. Tripathi, S. M. Wood, M. S. Islam and L. F. Nazar, Energy Environ. Sci., 2013, 6, 2257–2264 CAS
.
- G. Kamath, R. W. Cutler, S. A. Deshmukh, M. Shakourian-Fard, R. Parrish, J. Huether, D. P. Butt, H. Xiong and S. K. R. S. Sankaranarayanan, J. Phys. Chem. C, 2014, 118, 13406–13416 CAS
.
- M. Shakourian-Fard, G. Kamath, K. Smith, H. Xiong and S. K. R. S. Sankaranarayanan, J. Phys. Chem. C, 2015, 119, 22747–22759 CAS
.
- N. M. Loening, J. Keeler and G. A. Morris, J. Magn. Reson., 2001, 153, 103–112 CrossRef CAS PubMed
.
- A. Jerschow and N. Müller, J. Magn. Reson., 1997, 125, 372–375 CrossRef CAS
.
- V. Mauro, A. D’Aprano, F. Croce and M. Salomon, J. Power Sources, 2005, 141, 167–170 CrossRef CAS
.
- J. Evans, C. A. Vincent and P. G. Bruce, Polymer, 1987, 28, 2324–2328 CrossRef CAS
.
- S. Zugmann, M. Fleischmann, M. Amereller, R. M. Gschwind, H. D. Wiemhöfer and H. J. Gores, Electrochim. Acta, 2011, 56, 3926–3933 CrossRef CAS
.
- J. L. Allen, O. Borodin, D. M. Seo and W. A. Henderson, J. Power Sources, 2014, 267, 821–830 CrossRef CAS
.
- O. Borodin and G. D. Smith, J. Phys. Chem. B, 2009, 113, 1763–1776 CrossRef CAS PubMed
.
- O. Borodin, M. Olguin, P. Ganesh, P. R. C. Kent, J. L. Allen and W. A. Henderson, Phys. Chem. Chem. Phys., 2016, 18, 164–175 RSC
.
- Y. Kameda, S. Saito, Y. Umebayashi, K. Fujii, Y. Amo and T. Usuki, J. Mol. Liq., 2016, 217, 17–22 CrossRef CAS
.
- D. M. Seo, S. Reininger, M. Kutcher, K. Redmond, W. B. Euler and B. L. Lucht, J. Phys. Chem. C, 2015, 119, 14038–14046 CAS
.
- M. M. Mitambo and G. R. Loppnow, Chem. Phys. Lett., 1996, 261, 691–697 CrossRef CAS
.
- P. Mukherjee, A. Lagutchev and D. D. Dlott, J. Electrochem. Soc., 2012, 159, A244–A252 CrossRef CAS
.
- S. D. Han, S. H. Yun, O. Borodin, D. M. Seo, R. D. Sommer, V. G. Young and W. A. Henderson, J. Phys. Chem. C, 2015, 119, 8492–8500 CAS
.
- D. W. McOwen, D. M. Seo, O. Borodin, J. Vatamanu, P. D. Boyle and W. A. Henderson, Energy Environ. Sci., 2014, 7, 416–426 CAS
.
- Y. Yamada and A. Yamada, J. Electrochem. Soc., 2015, 162, A2406–A2423 CrossRef CAS
.
Footnote |
| † Electronic supplementary information (ESI) available. See DOI: 10.1039/c6cp07215a |
| This journal is © the Owner Societies 2017 |

