Proton conduction mechanisms in the phosphoric acid–water system (H4P2O7–H3PO4·2H2O): a 1H, 31P and 17O PFG-NMR and conductivity study†
Jan-Patrick
Melchior
,
Klaus-Dieter
Kreuer
* and
Joachim
Maier
Max-Planck-Institute für Festkörperforschung, Heisenbergstraße 1, Stuttgart, Germany. E-mail: kreuer@fkf.mpg.de
First published on 5th December 2016
Abstract
Ionic charge carrier formation and mobility, including the underlying conduction mechanisms, are investigated for phosphoric acid at water contents relevant for the acid's application as electrolyte in fuel cells. The high conductivity contribution from structural diffusion involving intermolecular proton transfer (∼97%) in neat phosphoric acid (H3PO4) passes through a maximum at this composition. Hydrogen bond network frustration (imbalance of the number of proton donors and acceptors), which is closely related to the appearance of structural diffusion, decreases with both elimination and addition of water. Structural diffusion is virtually disappearing for H3PO4·2H2O, yet, the overall conductivity increases with increasing water content and reaches a maximum at a composition of H3PO4·5H2O. The conductivity increase is a consequence of the progressive de-coupling of the diffusion of aqueous species from that of phosphate species and the strongly enhanced acidity of phosphoric acid at low water contents. High concentrations of protonated aqueous species with high diffusivity then lead to high conductivity contributions from vehicular transport. The increased water transport associated with the change in transport mechanism is suggested to have severe implications for fuel cell applications. At low water contents the conductivity contribution of structural diffusion is also reduced, but it is accompanied by conductivity contributions from a high concentration of multiply charged condensation products (e.g. H2P2O72−, H3P3O102− and H2P3O103−). The results underline the singularity of structure diffusion in neat phosphoric acid (H3PO4) and its sensitivity against any perturbation.
Introduction
Neat fused phosphoric acid (H3PO4) is the compound with the highest reported intrinsic proton conductivity, which is mainly the consequence of its “frustrated” hydrogen bond network (there is a severe imbalance of potential proton donors and acceptors) and the strength of its highly polarizable hydrogen bonds. The underlying proton conduction mechanism (structural diffusion) comprises very rapid intermolecular proton transfer and hydrogen bond formation reactions within the highly viscous environment of pure phosphoric acid. This mechanism was revealed by a recent ab initio molecular dynamics study1 of a model pure ortho-phosphoric acid system in combination with quasielastic neutron scattering.2 The presence of other species involved in internal condensation/hydrolysis equilibria, especially di-phosphoric acid (H4P2O7, sometimes termed pyro-phosphoric acid) and aqueous species (H2O, H3O+) had been omitted although such species coexist in nominally “dry” phosphoric acid.3In other words, aqueous species are intrinsic constituents of neat ortho-phosphoric acid and probably affect proton conductivity.4,5 As a matter of fact, the total conductivity responds sensitively to changes in water content,5–15 which are known to change the concentrations of a multitude of phosphate and aqueous species.16,17 This also suggests a change of the underlying proton conduction mechanism. On the other hand, there is putative experimental evidence that addition of a large amount of water to phosphoric acid (1![[thin space (1/6-em)]](https://www.rsc.org/images/entities/char_2009.gif) :
:![[thin space (1/6-em)]](https://www.rsc.org/images/entities/char_2009.gif) 1 mixture of phosphoric acid and water corresponding to an aqueous solution of 85 wt% phosphoric acid) does not change the nature of the proton transport process, i.e., 97% of the conductivity of this system is claimed to result from structural diffusion just as in pure phosphoric acid.11,12
1 mixture of phosphoric acid and water corresponding to an aqueous solution of 85 wt% phosphoric acid) does not change the nature of the proton transport process, i.e., 97% of the conductivity of this system is claimed to result from structural diffusion just as in pure phosphoric acid.11,12
Clarification of this confusing situation is of fundamental relevance as the proton conduction mechanisms of phosphoric acid and aqueous systems are quite different in nature. While neat phosphoric acid is an intrinsic proton conductor, proton conductivity of pure water is very low because of its very low concentration of intrinsic protonic defects (H3O+, OH−) formed through water auto-dissociation. The mobility of such defects takes place by solvent driven structural diffusion processes within a network of moderately strong hydrogen bonds18–20 and by simple diffusion of these species as a whole (vehicle mechanism21,22). This mobility (equivalent conductivity) is exceptionally high, which is the reason for the high (extrinsic) ionic conductivity of acidic and basic aqueous solutions.
Insights into the role water plays in the proton conduction process in the phosphoric acid–water system may also establish a basis for better understanding the proton transport properties of more complex phosphate containing systems23,24 as a function of water activity. Prominent examples are proton transport along the aqueous cytoplasmic side of phospholipid membranes25,26 and the conduction behavior of phosphoric acid containing membranes for application in fuel cells in which the reacting gases are humidified, and water is produced as a product of the electrochemical reaction.27 The performance of such fuel cells is known to depend on both the humidification of anode and cathode stream28,29 affecting water permeability and proton conductivity of the corresponding membranes (mostly adducts of poly-benzimidazole and phosphoric acid).30–33
This also holds for phosphoric acid containing glasses and gels,34,35 acidic salts of phosphoric acid such as CsH2PO436 and even salts of di-phosphoric acid, e.g. SnP2O7,37,38 which are also considered as electrolyte materials for fuel cell applications. These systems are reported to be among the few showing high proton conductivity in the so-called “intermediate temperature regime” (T ∼ 100–250 °C) provided some minimum hydration is guaranteed.
In the present work, we provide temperature dependent conductivity and diffusion data for molten P2O5·λH2O covering a wide composition range from λ = 2 (di-phosphoric acid, H4P2O7) to dilute aqueous solutions of ortho-phosphoric acid with λ ∼ 1000 (1 wt% H3PO4(aq.)). Apart from reproducing and completing literature data on 1H and 31P diffusion and total ionic conductivity, we were able to separate the transport (diffusion and conductivity) contributions of the diverse species. This was accomplished by discriminating between different phosphate species in 31P PFG-NMR diffusion measurements, by performing 17O PFG-NMR and electrochemical transference number measurements. The latter allowed separating proton conductivity contributions stemming from the diffusion of protonated water molecules (H3O+) and structural diffusion.
Thermo-gravimetric analysis as a function of temperature T and relative humidity RH was carried out to relate the nominal water content λ to the chemical potential of water.
Here, we present the complete data set with detailed analysis and discussion restricted to compositions λ = 2–7 around ortho-phosphoric acid (H3PO4 corresponding to λ = 3).
Experimental
Thermo gravimetric analysis (TGA)
Equilibrium thermogravimetric analysis (TGA) was carried out by using a balance (Mettler AT20) magnetically coupled (Rubotherm) to a PTFE crucible containing the sample. This technique allowed for weighing even at high temperature T and high relative humidity RH, as described before.39 Changes of the buoyancy were compensated by a two parameter (temperature of sample and humidifier) baseline correction. Equilibration times of up to several days (especially at low T and RH) were chosen in order to ensure that thermodynamic equilibrium was reached. Reversibility was cross-checked through comparing the weights recorded during heating and cooling runs which also allowed to exclude the uptake and release of species other than water. The weight of nominally dry phosphoric acid was taken as reference point (λ = 3). This was obtained by centrifuging crystalline phosphoric acid (Aldrich, >99.999%) for removing surface water. About 1 g of centrifuged sample was weighed in the crucible under the nitrogen atmosphere of a dry box before the loaded crucible was transferred to the balance under the same dry gas.Water uptake has been cross-checked by NMR analysis of samples equilibrated at the RH/T conditions corresponding to λ = 3 in comparison to “pristine” nominally dry H3PO4 obtained as described above and the accuracy of the TGA measurement was found to be.
Sample preparation
Since all measurements were done in gas tight sample holders containing phosphoric acid of defined hydration number λ, the water content had to be adjusted beforehand. For this, the samples were equilibrated in special in-house made PTFE NMR tubes under RH/T conditions obtained from above described TGA measurements. The tubes were inserted into a chamber providing defined RH/T conditions, and lids were screwed on the tubes after equilibration without opening the chamber (see the ESI†).Samples with water contents λ < 2.5 were obtained by adding bidistilled water to P2O5 by weight in a glovebox under dry nitrogen atmosphere. The resulting viscous liquids were either filled in impedance cells for conductivity measurements, or in 5 mm NMR tubes with screw lids. Dead volume above the sample was filled with a glass filler and the NMR tube was closed with its lid inside the nitrogen atmosphere and subsequently heat-sealed outside the glove box. The water contents were then verified using the intensity of the different 31P NMR lines which depend on water content (see below).
Samples with phosphoric acid contents between 85 and 99 wt% H3PO4(aq.) (λ = 4.92–3.1) were prepared by adding corresponding amounts of bi-distilled water to nominally dry crystalline phosphoric acid (see above). For higher water contents 85 wt% H3PO4(aq.) (Merck VLS selectipur) was diluted with bi-distilled water. All concentrations were controlled and verified by acid/base titration using a 877 plus Titrino by Metrohm and sealed in the NMR tubes without dead volume as described above.
Samples for conductivity measurements were prepared in similar ways and placed in homebuild conductivity cells (see below).
17O enriched samples for PFG-NMR measurements were prepared inside NMR tubes by adding 10% 17O enriched water (Enritech NW 17-20 Batch 179501) to nominally dry phosphoric acid. Samples had to be equilibrated for up to one month in order to ensure homogeneous distribution of the 17O tracer over aqueous and phosphate species. This long equilibration time is controlled by the rate of the condensation/hydrolysis reaction3 which increases with increasing water content (see the ESI† for details).
Impedance spectroscopy
Temperature-dependent dc-conductivities were derived from impedance spectra measured with a HP-ac-impedance analyzer (4192A LF) in the frequency range from 10 Hz to 1 MHz. A closed conductivity cell made from glass (Duran, sample volume 0.6–1 ml) with platinum electrodes (diameter ∼ 6 mm) was used for measurements in the temperature range T = 20 to 160 °C. The maximum temperature was limited by the reactivity of phosphoric acid with glass. Heating and cooling runs were performed to ensure reversibility. The cell constant was determined by calibration with standard KCl solutions of different normalities (0.1 N and 0.01 N CertiPUR® Merck).NMR spectroscopy
NMR measurements were performed with a Bruker Avance III 400 spectrometer equipped with a diff60 gradient probe. 1H and 31P nuclei were used at natural abundance, while for 17O diffusion measurements samples had to be enriched using 17O enriched water as a source for this nucleus (see above). The data obtained for the different nuclei will further be referred to by index “1H”, “31P”, or “17O”, respectively.Spin lattice relaxation times T1 were measure by the inversion recovery sequence with recovery times in the order of seconds for 1H and 31P and milliseconds for 17O.40 The 17O signals from aqueous and phosphate species were well separated, and 31P-NMR spectra showed distinct signals for H3PO4, H4P2O7 and H5P3O10. Since protons exchange on the sub-NMR time scale, a single 1H-NMR line is observed in the entire T and λ range.
The stimulated echo pulsed field gradient NMR technique (PFGSTE-NMR)41 was used to measure 1H and 31P diffusion coefficients with a diffusion time Δ = 20 ms. The choice of the latter was confirmed to have no influence on the obtained diffusion coefficient by varying Δ within the range 7–40 ms for a few measurements. Since T1 of 17O was generally found to be short, 17O diffusion coefficients were measured with the Hahn-spin-echo pulse sequence (PFG-SE) setting the diffusion time to Δ = 5 ms (see the ESI† for details).
Infrared spectroscopy
Infrared spectra of phosphoric acid–water mixtures were recorded at room temperature in the attenuated back reflection mode using a Spectrum Two FT-IT spectrometer by Perkin Elmer.Electrochemical transference number measurements
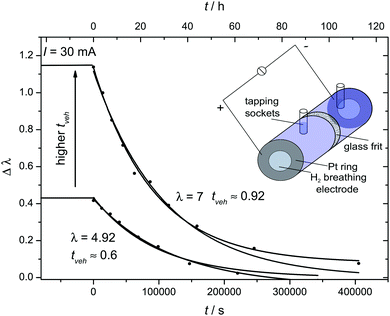
For electrochemical transference number measurements we have designed an electrochemical cell which allows determination of the flow of water and phosphoric acid associated with a protonic current. This glass cell consists of an anode and cathode compartment separated by a ceramic diaphragm (pore size 10–16 μm), each compartment containing a hydrogen (5% H2 in Ar) breathing hydrophobic gas diffusion electrode (area A = 6.15 cm2) as commonly used in PEM fuel cells. Both compartments (volume V = 8.3 ml) were filled with a phosphoric acid–water solution of identical composition (experiments were carried out for two compositions λ = 4.92 and λ = 7.0) before applying a current of I = 30 mA at T = 60 °C. In order to minimize compositional changes through water gas exchange between the solutions and the hydrogen gas streams, the latter were humidified (see the ESI†). Compositional changes of the solutions in anode and cathode compartment were then recorded by 31P-NMR as a function of time using a calibration curve for 31P chemical shift δ versus λ (see Fig. 5). The compositional changes are the consequence of water (by H3O+) and phosphoric acid (by H2PO4−) transport from the anode to the cathode and vice versa which is slowed down by back-transport increasing with increasing concentration gradient. The rates of the two opposing transport modes then define a steady state concentration gradient between the solutions of the two compartments. The back-transport rate was separately determined by following re-equilibration of the concentration gradient after turning off the current. From the steady state and transient concentration gradient then water and phosphoric acid transport associated with the applied protonic current is calculated (see the ESI†).Results and discussion
Before entering a quantitative discussion of equilibrium composition and transport (diffusion and conductivity) for water contents (λ = 2–7, hydration number λ = [H2O]/[P2O5]) around that of nominally dry ortho-phosphoric acid (λ = 3), a more extended transport data set is presented together with viscosity data taken from the literature.11,42 This allows identification of principal regimes with respect to transport, i.e., diffusion and mobility of neutral and charged species, with a special emphasis on the prevailing proton diffusion and conduction mechanism.Transport regimes
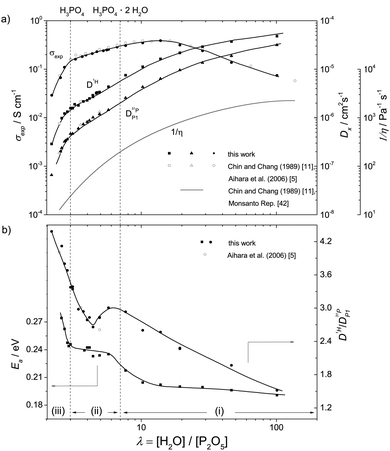
(i) For high water contents (λ > 7) proton conductivity including the conductivity maximum close to λ = 13 and proton diffusion (Fig. 1a) are very similar for aqueous solutions of any acid (for comparison see e.g. proton diffusion and conductivity of aqueous hydrochloric acid42). This compositional range we therefore term the “acidic aqueous solution regime”. The regime is characterized by steadily increasing fluidity 1/η (decreasing viscosity η) and diffusion coefficients of H (D1H) and P (D31P) (Fig. 1a) and decreasing activation enthalpy of H diffusion Ea (Fig. 1b) with increasing water content. Together with the effect of increasing dilution (decreasing concentration) of ionic charge carriers this produces the conductivity maximum. The decrease of conductivity with increasing dilution beyond the conductivity maximum is mainly related to the decreasing concentration of ionic charge carriers. The fact that this decrease is significantly sub-linear with concentration indicates the increasing contribution of structural diffusion within the aqueous hydrogen bonded structure (λ > 25 corresponding to 5 M) and is also expected from the decrease of fluidity 1/η (Fig. 1a) associated with an increasing rate of hydrodynamic transport of ionic species.(ii) At lower water concentrations (λ < 7), the retardation of the global dynamics goes along with a change of the conduction mechanism leading to features such as the maximum of the D1H/D31P ratio at about λ = 6 and stagnation of the D1H activation enthalpy Ea below the same water content (Fig. 1b). While at high water contents vehicular contributions to conductivity prevail, with decreasing water content the increasing aggregation of phosphate species through strong hydrogen bonding leads to an increasing contribution of structural proton diffusion. We therefore suggest calling this composition range “transition regime”. At the lower water concentration limit of this regime (H3PO4) structural diffusion contributes ∼97% to the total ionic conductivity.1,3,7
(iii) For lower water contents (λ < 3), the increasing concentration of condensation products (e.g. H4P2O7) accompanies a severe viscosity increase (fluidity decrease, Fig. 1a). Even though this further reduces hydrodynamic diffusion with a corresponding increase of activation enthalpies, the conductivity decreases only moderately. The increase in D1H/D31P (Fig. 1b) indicates further de-coupling of proton diffusion from the hydrodynamic background diffusion of phosphate species. The composition range λ ∼ 2–3 may therefore be signified as “proton de-coupling regime”.
The above assignments are based on data recorded at T = 70 °C (343 K), and it goes without saying that all properties described depend on temperature. Nevertheless the assignments serve as a setting for discussing transport properties of the phosphoric acid–water system at any temperature.
Hydration isotherms (external equilibrium)
Since the transport features discussed in this work are for fixed values of λ (hydration number λ = [H2O]/[P2O5]), understanding transport as a function of the chemical potential of water μH2O (μH2O = RT![[thin space (1/6-em)]](https://www.rsc.org/images/entities/i_char_2009.gif) ln
ln![[thin space (1/6-em)]](https://www.rsc.org/images/entities/char_2009.gif) RH) requires information about the relation between water content λ and relative humidity RH as a function of temperature T. We have obtained this by recording hydration isotherms with a very high accuracy of Δλ ≲ 0.03 given essentially by the precision of the reference point, i.e., weight and composition of crystalline ortho-phosphoric acid (λ = 3) (see Experimental). The data are shown as Fig. 2 together with isotherms reported by MacDonald and Boyack43 demonstrating virtually identical functional dependence between λ and RH. The apparent offset, which is about twice the error bar of the present data, is most likely due to the limited precision of the reference point in the literature data. In the following, we therefore use data from the present work only.
RH) requires information about the relation between water content λ and relative humidity RH as a function of temperature T. We have obtained this by recording hydration isotherms with a very high accuracy of Δλ ≲ 0.03 given essentially by the precision of the reference point, i.e., weight and composition of crystalline ortho-phosphoric acid (λ = 3) (see Experimental). The data are shown as Fig. 2 together with isotherms reported by MacDonald and Boyack43 demonstrating virtually identical functional dependence between λ and RH. The apparent offset, which is about twice the error bar of the present data, is most likely due to the limited precision of the reference point in the literature data. In the following, we therefore use data from the present work only.
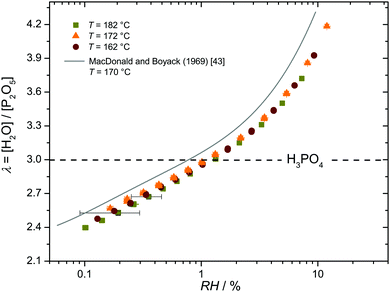 | ||
| Fig. 2 Hydration isotherms for three different temperatures. The composition of nominally dry phosphoric acid (H3PO4, λ = 3) is indicated by the dashed line. | ||
Species concentrations as a function of T and λ (internal equilibria)
For separating diffusion and conductivity contributions and identifying the underlying transport mechanisms, the concentrations of the involved species have to be determined first. For the composition range discussed in the present work these are mainly H2O, H3PO4, H4P2O7 and H5P3O7, including the corresponding ionic species (H3O+, H2PO4−, H4PO4+, H3P2O7−etc.). The concentrations of the different phosphate species are given by the equilibrium constants of the following internal hydrolysis/condensation reactions:| 2H3PO4 ⇄ H4P2O7 + H2O | (1) |
| 3H4P2O7 ⇄ 2H5P3O10 + H2O | (2) |
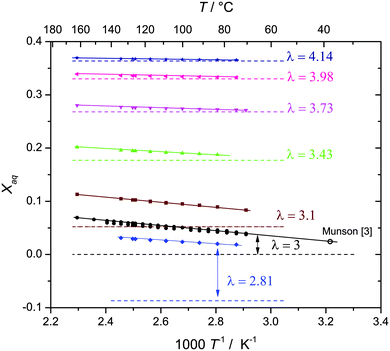
For selected water contents λ, data are also recorded as a function of temperature as displayed in Fig. 4 together with the T = 311 K value of nominally dry phosphoric acid reported by Munson,3 which is in perfect agreement with the present data (see the ESI† for a discussion of other literature data).
But when it comes to the equilibrium proton distribution over the different phosphate and aqueous species, we would like to slightly modify the assumptions of Munson suggesting the co-existence of H2P2O72− and H4PO4+ as major products of the condensation reaction.3 Assuming a minimum difference in pKa of coexisting species, this is very unlikely. With the pKa of possible species44,45 (Scheme 1), the acidity of the condensation products (di-phosphoric and tri-phosphoric acid species) is significantly higher than the acidity of ortho-phosphoric acid species, indeed. (See Krueger et al.15 for a discussion of the acidity of di-phosphoric acid.) But the de-protonation of di- and tri-phosphoric acid is expected to proceed only to the formation of H3P2O7− and H3P3O102− coexisting with ortho-phosphoric acid. The acidic protons then rather transfer to the ortho-phosphoric acid species or the even more basic water formed in the condensation reaction. For water contents below λ = 3 (H3PO4), the evolution of the chemical shift δ (Fig. 5) of the ortho-phosphoric 31P NMR signal shows an increasing de-shielding with decreasing water content while the di-phosphate signal becomes more shielded. This suggests some proton transfer from di-phosphate species to ortho-phosphoric acid (formation of H4PO4+)46,47 rather than the formation of hydronium ions (H3O+) under these very dry conditions. In any case, decreasing water content in the “de-coupling regime” (λ < 3) decreases the Brønsted acidity of ortho-phosphate species relative to the acidity of their environment just as the addition of water reduces ortho-phosphoric acid's acidity in the “transition regime” (λ > 3), as will be discussed in the section on transport.
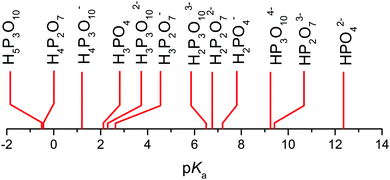 | ||
| Scheme 1 pKa values of different hydrogen phosphate species.44,45 Note the similar values for H3PO4, H3P3O102−, and H3P2O7− (see text). | ||
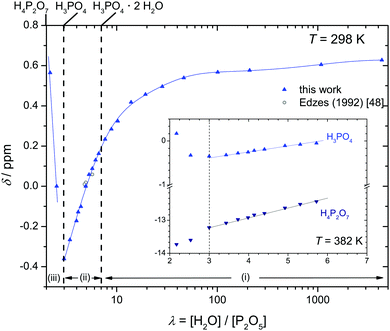 | ||
| Fig. 5 Chemical shift δ of ortho-phosphate 31P NMR signals as a function of the hydration number λ (the position of the 31P-NMR line of an 85 wt% aqueous solution of ortho-phosphoric acid is set to zero48). The inset additionally shows the chemical shift of the di-phosphate signal in a narrower range of λ. Note that the distinct minimum in δ (maximum shielding of the 31P nucleus) at λ = 3 (H3PO4) corresponds to a maximum of ortho-phosphate's Brønsted acidity relative to its environment. | ||
Reactions (1) and (2) may therefore be expanded to:
| 3H3PO4 ⇄ H3P2O7− + H4PO4+ + H2O | (3) |
| 3H3P2O7− + H3PO4 ⇄ 2H3P3O102− + H4PO4+ + H2O | (4) |
As an additional source for the formation of H4PO4+, we consider the auto-dissociation reaction of ortho-phosphoric acid:
| 2H3PO4 ⇄ H2PO4− + H4PO4+ | (5) |
For high water contents (transition regime, λ = 3–7), the major issue is the degree of protonation of the aqueous species, i.e., the ratio of [H3O+]/[H2O]. In fact, H2O is mainly protonated through the reaction:
| H3PO4 + H2O ⇄ H2PO4− + H3O+ | (6) |
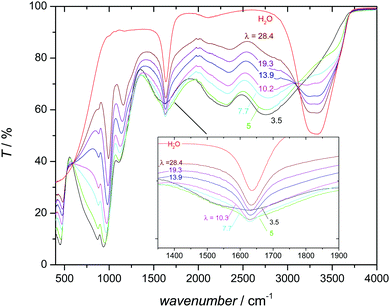
This distinct behavior is probably the consequence of a significant change in the hydrogen bond interaction between aqueous and phosphate species with increasing hydration as evidenced by the changes of the infrared (IR) spectrum with composition (Fig. 6). Two prominent features of the IR spectrum of pure water are the broad intense absorption above 3000 cm−1 and the water deformation mode around 1640 cm−1. The first corresponds to the stretching vibration of OH involved in hydrogen bonding with the proton-accepting oxygen of another water molecule. The well-known red shift, broadening and intensity increase compared to the corresponding features of a non-hydrogen bonded OH are characteristic for the moderately strong hydrogen bonding between water molecules.49 With increasing phosphoric acid content, this feature continuously decreases before vanishing at a phosphoric acid–water ratio of about 1![[thin space (1/6-em)]](https://www.rsc.org/images/entities/char_2009.gif) :
:![[thin space (1/6-em)]](https://www.rsc.org/images/entities/char_2009.gif) 1 (corresponding to λ = 5). Apparently, water molecules are completely separated by phosphate species at this composition, i.e., water molecules may form hydrogen bonds with phosphate species only. These bonds seem to be almost as strong as the very strong hydrogen bonds between phosphate species, with two characteristic broad absorption features between 2000 and 3000 cm−1.50–53 The 31P chemical shift increase of phosphate species (Fig. 5) may therefore reflect the weakening of the hydrogen bond interaction with increasing water content. Weaker hydrogen bonds correspond to stronger (shorter) covalent OH bonds54 which has a de-shielding effect on both the 17O nucleus55,56 (see Fig. S19, ESI†) and the 31P nucleus (Fig. 5). As we will show later, increasing water content reduces ortho-phosphoric acid's acidity, which explains the decreasing hydrogen bond strength between ortho-phosphate and aqueous species and the decreasing degree of dissociation, i.e., less proton transfer from phosphate to aqueous species.
1 (corresponding to λ = 5). Apparently, water molecules are completely separated by phosphate species at this composition, i.e., water molecules may form hydrogen bonds with phosphate species only. These bonds seem to be almost as strong as the very strong hydrogen bonds between phosphate species, with two characteristic broad absorption features between 2000 and 3000 cm−1.50–53 The 31P chemical shift increase of phosphate species (Fig. 5) may therefore reflect the weakening of the hydrogen bond interaction with increasing water content. Weaker hydrogen bonds correspond to stronger (shorter) covalent OH bonds54 which has a de-shielding effect on both the 17O nucleus55,56 (see Fig. S19, ESI†) and the 31P nucleus (Fig. 5). As we will show later, increasing water content reduces ortho-phosphoric acid's acidity, which explains the decreasing hydrogen bond strength between ortho-phosphate and aqueous species and the decreasing degree of dissociation, i.e., less proton transfer from phosphate to aqueous species.
The formation of strong hydrogen bonds between phosphate and aqueous species in the composition range λ ∼ 3–5 is supported by a quantum molecular dynamics simulation of the system H3PO4·H2O,57 and consistent with the evolution of the water deformation absorption (Fig. 6). In aqueous systems the formation of hydronium ions (H3O+) is indicated by the appearance of an additional distinct absorption above 1700 cm−1 (usually seen as a blue shifted shoulder of the water deformation absorption).58,59 Instead of such a distinct feature, the IR spectra of phosphoric acid–water mixtures show not only a blue shifted shoulder but also a less pronounced red shifted shoulder (Fig. 6). This asymmetric broadening indicates some extra protonation of the aqueous species, but not the existence of distinct hydronium ions in the ground state. Since the protons are involved in relatively strong hydrogen bonds at low water contents (λ < 5, see above), they are virtually shared between the phosphate and water oxygens. Proton assignment to one or the other is therefore meaningless, and so is the specification of H3O+ (and H2PO4−) concentrations.
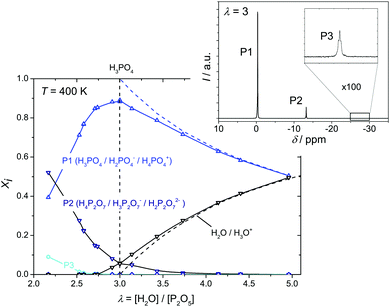
The extent to which water diffusion is associated with the diffusion of protonic charge (and vice versa) may therefore be determined only through direct transference experiments as specified in the section on transport. Otherwise, we have used the evolution of the ionic species' (H3P3O102−, H3P2O7−, H2PO4−, H4PO4+) concentrations shown in Fig. 7 for separating the diverse transport coefficients.
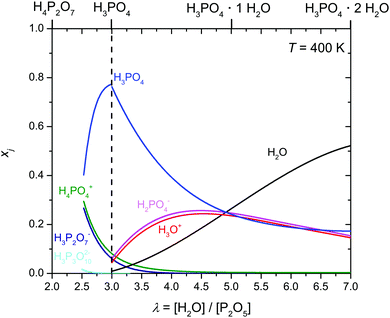 | ||
| Fig. 7 Evolution of the mole fractions xi of ionic species (i: H3P3O102−, H3P2O7−, H2PO4−, H4PO4+) as a function of water content λ at T = 400 K (the mole fractions of H3O+ and H2PO4− have been obtained through transference measurements at T = 333 K). Concentrations of the ionic species according to equilibrium 6 are obtained from the analysis of transport data (see below). Note that for lower λ values (λ < 2.5) increasing concentration of condensates is expected to lead to increasing concentrations of highly charged anions (H2P2O72−, H3P3O102− and even H2P3O103−) which are not included here (see text). | ||
Transport (diffusion and conductivity)
The diffusion coefficients of species appearing as distinct lines in the 1H and 31P NMR spectra are measured separately as a function of temperature T and water content λ. Since all protons exchange on the NMR time scale, the single proton line is used for measuring the average proton diffusion coefficient. As in the case of the determination of phosphate species concentrations (see above), three diffusion coefficients corresponding to the three groups of species (P1: H3PO4, H2PO4−, H4PO4+; P2: H3P2O7−; P3: H3P3O102− and higher condensates) are determined separately. For water contents λ > 3.75 the diffusion coefficients of aqueous (aq.: H2O, H3O+) and phosphate species are also separated through 17O-NMR. The following discussion of proton transport is based on these data together with direct transference data, the total ionic conductivity and species concentrations (Fig. 3 and 7). The analysis is carried out separately for the “proton de-coupling” (λ = 2–3) and the “transition regime” (λ = 3–7). | (7) |
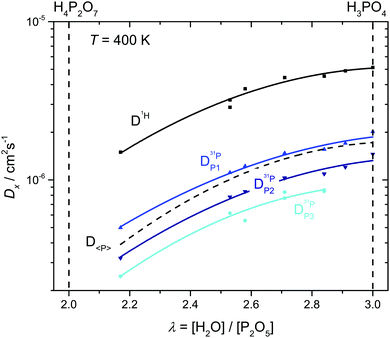 | ||
| Fig. 8 H and P diffusion coefficients as obtained by 1H and 31P PFG-NMR at T = 400 K in the composition range between di- and ortho-phosphoric acid (λ = 2–3). The average P diffusion coefficient D〈P〉 is calculated by eqn (7). | ||
For both species, the decrease of their diffusion coefficients is quite expected, although for different reasons. The progressive condensation of phosphate leading to the formation of higher molecular weight species (Fig. 3) naturally leads to a decrease in the average P diffusion coefficient D〈P〉. At the same time, condensation leads to a decreasing hydrogen bond density and hydrogen bond network frustration similar to the situation in phosphonic acid (H3PO3)60 as shown by a recent ab initio MD-simulation.15 In the case of phosphonic acid, decreasing hydrogen bond density leads to a viscosity decrease and a corresponding P diffusion increase while decreasing hydrogen bond network frustration is associated with a slight decrease in proton conductivity.1 In the present case, the effect of molecular weight increase on the P diffusion clearly dominates the effect of decreasing hydrogen bond density. The fact that diffusion also decreases, albeit less severely than P diffusion, may have different reasons. Structural diffusion of H may still have some weak coupling to the P dynamics, and the symmetry decrease of the hydrogen bond network associated with the formation of various species may have an additional retarding effect on the structural diffusion of protons.
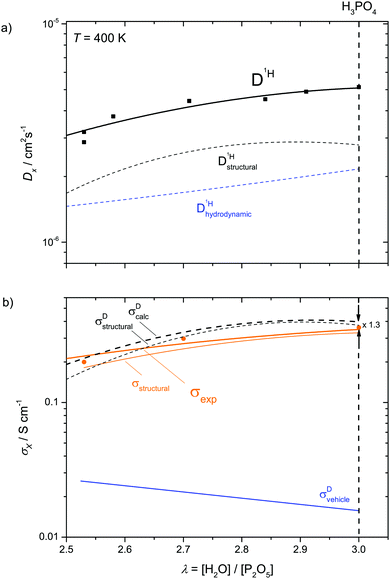
From the diffusion coefficients ( , Fig. 8), the mole fractions of all neutral and charged species xj, i.e., j = {H3PO4, H2PO4−, H4PO4+, H3P2O7−, H3P3O102−, H2O, H3O+} (see Fig. 3 and 7) and the number of protons per species pj (e.g., pH2PO4− = 2, pH3P2O7− = 3) the proton diffusion contribution arising from hydrodynamic diffusion is readily obtained:
 | (8) |
 is different from D〈P〉, eqn (7). The structural H diffusion contribution then is (Fig. 9a):
 | (9) |
 | (10) |
 through:
 | (11) |
With this, the total ionic conductivity σDcalc is accessible through diffusion and concentration data only:
| σDcalc = σDvehicle + σDstructural | (12) |
As reported recently for a composition close to λ = 2 (di-phosphoric acid), σDstructural accounts for less than half of the measured conductivity σexp.15 Since different correlation effects for proton diffusion and conductivity corresponding to a Haven ratio of H = σDcalc/σexp < 1 are very unlikely in proton conducting hydrogen bonded networks,61 the relatively high experimental ionic conductivity is suspected to have its origin in a higher-than-calculated vehicular contribution σDvehicle. The appearance of higher charged species (H2P2O72−, H3P3O102−, H2P3O103−, see above) expected at very low water contents (see the pKa values summarized in Scheme 1 and Krueger et al.15) may sensitively increase this conductivity contribution. Note that the charge z enters to the square into the Nernst–Einstein relationship (eqn (10)).
For higher water contents approaching that of nominally dry ortho-phosphoric acid (λ = 3), the calculated conductivity surpasses the experimental conductivity, reaching a value about a factor of 1.3 (see Fig. 9 and Fig. S14, ESI†) higher than the experimental one at λ = 3. As will be explained below, this has to do with different correlations for structural proton diffusion and structural proton mobility (conductance). A more quantitative way to obtain σstructural is therefore to simply subtract σDvehicle from the experimentally measured total conductivity which already contains such correlation effects:
| σstructural = σexp − σDvehicle | (13) |
On the dry side of this composition, the fact that σDcalc falls below σexp has most likely to do with conductivity contribution from highly charged higher condensates which could not be included into the present analysis (see above).
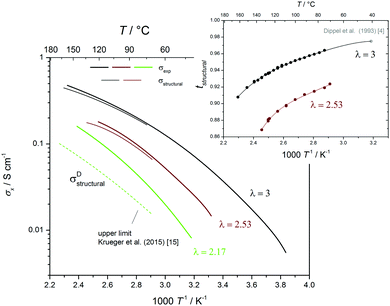
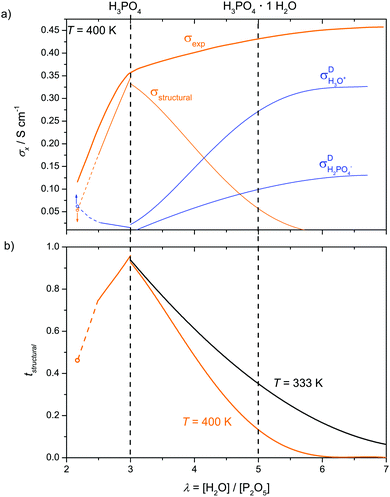
The structural diffusion contribution of the ionic conductivity not only decreases with decreasing λ (Fig. 9b), it also decreases with T over the whole composition range as shown for three cases in Fig. 10. As expected,25,63 the hydrogen bonded liquids progressively lose their structural diffusion capability, thus becoming more similar to common (ionic) liquids with increasing T, which is especially true for di-phosphoric acid.
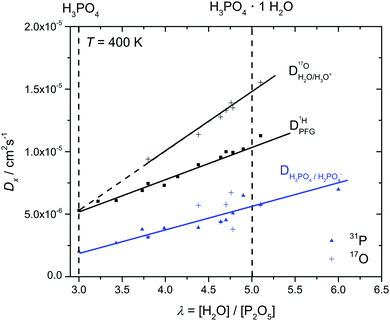
In order to investigate the effect of additional water on proton transport, we have therefore not only measured 1H and 31P diffusion coefficients but also the diffusion coefficient of 17O as part of aqueous and phosphate species in the composition range λ = 3.7–6.1. The corresponding 17O-NMR signals do not average on the NMR time scale (exchange of oxygen takes place through the very slow condensation/hydrolysis reaction). Despite the strong hydrogen bonding between aqueous and phosphate species (see above and IR spectra, Fig. 6), the diffusion coefficient of aqueous species is more than a factor of 2 higher than the phosphate diffusion coefficient in nominally dry phosphoric acid (see extrapolated data in Fig. 11). The  ratio further increases with hydration, reaching a value of 2.6 at λ = 5 and T = 400 K, which is close to the ratio of 2.3 for dilute aqueous solutions.65 Obviously, significant de-coupling of aqueous and phosphate species takes place in the regime λ = 3–5 (Fig. 11). This is expected to also increase the ratio
  , because the higher diffusion coefficient of aqueous species Daq contributes to D1H but not to
  But as we will show later, this increase is opposed to the decrease of
  stemming from decreasing structural diffusion. The different water concentration dependences of both effects may then explain the appearance of a minimum of
  followed by a maximum at slightly higher water content (Fig. 1b).
At any composition in the regime λ = 3–5, the diffusion coefficient of aqueous species is distinctly higher than the average proton diffusion coefficient D1H which naturally raises the question of the extent to which the diffusion of aqueous species (in particular H3O+) contributes to the overall proton conductivity. In the case of pure phosphoric acid (λ = 3), the major part of the conductivity is due to structural diffusion of protons. With increasing water content, this mechanism is expected to die out because phosphoric acid species lose their mutual hydrogen bonding, and proton transfer to water reduces frustration within the hydrogen bond network. The formation of hydronium ions (H3O+) is then expected to initiate another conductivity contribution, namely vehicular proton transport through the diffusion of protonated aqueous species.20,21 This mechanism could explain the total ionic conductivity at λ ∼ 4.92 if all water molecules were charged with an extra proton. But as discussed above, the identification of distinct species (H2O, H3O+) is meaningless for the ground state of the system, and so is the expression of a vehicular conductivity contribution through the mobility and concentration of a distinct charge carrier (H3O+). The only way to determine the extent to which the diffusion of aqueous species is associated with the mobility of protonic charge is through direct measurements of water fluxes associated with protonic currents or vice versa.
This, we have done for two compositions close to H3PO4·H2O (λ = 4.92) and H3PO4·2H2O (λ = 7.0) as described in the experimental section. The steady state compositional difference Δλ developing between anode and cathode compartment in the presence of a protonic current and the relaxation after turning off the current are consistent with a net transport of 0.63 (±0.1) H2O and 0.92 ± 0.07 H2O per transported protonic charge for λ = 4.92 and λ = 7.0, respectively (note that the net transport of water has contributions from the transport of water and phosphoric acid).
At such water contents where water molecules mainly interact with phosphate species (see above) we may assume that H3O+ and H2PO4− diffuse without transport of any additional hydration water. As these species are identical to the ones constituting the hydrodynamic part of the conductivity (vehicle mechanism), the number of water molecules transported per protonic charge (0.63 and 0.91) then equals the transference number for vehicle transport tvehicle (data points included in Fig. 13). This transference has a much higher contribution from the transport of H3O+ than from H2PO4− transport according to the ratio of the diffusion coefficients of the two species (Fig. 11). With the diffusion coefficients of both species, the concentrations of H3O+ and H2PO4− are calculated from tvehicle:
 | (14) |
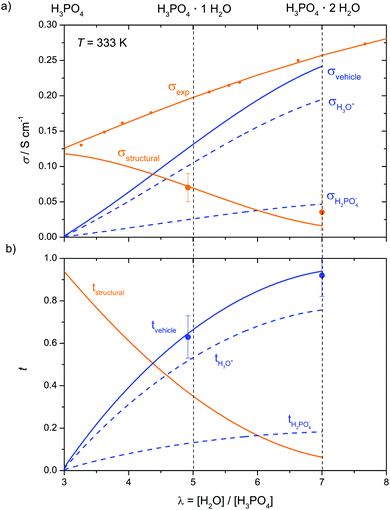 | ||
| Fig. 13 (a) Conductivity contributions in the transition regime λ = 3–7 and (b) corresponding transference numbers (λ = 3–7). For two compositions λ = 4.92 and 7.0 (bold points) coupling of proton and water transport has been determined by electrochemical transference measurements (see Fig. 12 and text). | ||
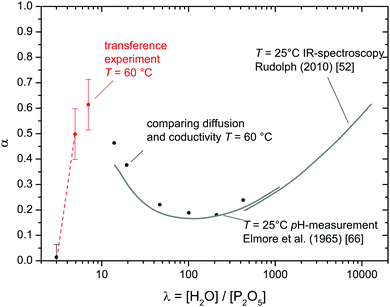 | ||
| Fig. 14 Degree of dissociation α of phosphate species as function of the water content λ. Literature data for high water contents52,66 (gray lines) are combined with values obtained from the transference measurement (red points) and such obtained through comparison of diffusion and conductivity data (see text). | ||
For higher water concentrations (λ > 10), data on the degree of dissociation (reaction (6)) are available from IR spectroscopy53 and pH-measurements.66 In the present work, such data are obtained by relating the total conductivity to H and P diffusion data (Fig. 1a) through ionic charge carrier concentrations. Since considering vehicle diffusion of hydrated protons (H3O+·aq) and H2PO4− being the only conductivity contributions is a safe assumption for high water contents, the concentration of [H3O+] = [H2PO4−] is assessable through the Nernst–Einstein relation (eqn (10)). Data obtained in this way are expressed as degree of dissociation α shown in Fig. 14 together with above mentioned literature data. The fact that α values determined through transference experiments follow the trend anticipated by the literature data provides further confidence in above made assumption that water is transported through the migration of H3O+ and H2PO4− only. In particular, the data are not in favor of transport of higher aggregates such as Zundel ions (H5O2+).
Interestingly, the degree of phosphate dissociation α decreases with increasing water content before passing through a shallow minimum below λ ∼ 100 (Fig. 14). The decrease below the minimum is an immediate indication for a decreasing acidity while the increasing dissociation at high water contents is simply the consequence of the increasing water activity. As adumbrated above the high acidity at low water contents is probably the consequence of hydrogen bond network frustration which is expected to emerge as soon as phosphate species start to aggregate. The minimum in α around λ = 100 therefore suggests that phosphoric acid aggregation controls the dissociation behavior for λ < 100. It is clear that phosphoric acid's degree of dissociation (reaction (6)) approaches zero with decreasing water content, i.e., some maximum of α is expected for low water contents. The fact that α for λ = 4.92 is slightly lower than for λ = 7 may be related to this expected feature.
When expressing the data as equilibrium constant K of reaction (6), the monotonous increase of K with decreasing λ (Fig. S18, ESI†) allows easy interpolation. With K(λ) obtained in this way, the evolution of the concentrations of H3O+ and H2PO4− are obtained for the hydration range λ = 3–7. Together with the concentration of H4PO4+ stemming from phosphoric acids self dissociation (only relevant for low water contents close to λ = 3, Fig. 7) and diffusion coefficients for aqueous and phosphate species, the hydrodynamic conductivity contribution σDvehicle is readily obtained via the Nernst–Einstein relation (10). Together with the conductivity contribution from proton structural diffusion σDstructural obtained through eqn (13), this is shown in Fig. 13a with the corresponding transference numbers presented in Fig. 13b. Obviously, the hydrodynamic conductivity contribution progressively takes the role as the dominant ion conduction mechanism in the transition regime (λ = 3–7) at the expense of proton structural diffusion which dies out around λ = 7 (H3PO4·2H2O) The severe increase of the total conductivity with increasing water concentration is mainly the consequence of phosphoric acid's high acidity (high degree of dissociation α, Fig. 14) at low water contents and the efficient de-coupling of the diffusion of aqueous from phosphate species, i.e., the high diffusion coefficients of aqueous species (Fig. 11).
Since the equilibrium constant of reaction (6) is expected to depend on temperature, and since high T transference numbers are not available yet, we cannot safely extend above analysis to higher T. Nevertheless we have compiled the available T-dependent diffusion and conductivity data within the supporting information (Fig. S23ff, ESI†). Qualitatively, structural conductivity breaks down at lower water contents for higher temperatures which is consistent with the lower structural diffusion contribution to conductivity in nominally dry H3PO4 at higher temperature (see Fig. 10).
Summary and final remarks
If we consider the different ionic (protonic) conductivity contributions of phosphoric acid as a function of water content, as revealed in the present work, the unique proton transport properties (structure diffusion) of neat phosphoric acid1,4 (H3PO4, λ = 3) turn out to be a singularity in the given system. Although the total ionic conductivity σexp monotonically increases with increasing water content, the absolute (Fig. 15a) and relative conductivity contributions from structural diffusion pass through maxima (tstructural = 0.97, Fig. 15b) for nominally dry phosphoric acid. This is not surprising considering the fact that fast structure diffusion is related to a high degree of hydrogen bond network frustration.1 On the dry side of this composition progressive phosphate condensation reduces hydrogen bond network frustration by the elimination of water, while the addition of water releases frustration through proton transfer to aqueous species. The maximum hydrogen bond network frustration for nominally dry H3PO4 corresponds to the highest Brønsted acidity of ortho-phosphate species relative to its environment as evidenced by the distinct minimum of the 31P chemical shift at this composition (Fig. 5). This is suggested to be the reason for phosphoric acid's strong hydrogen bonding with other phosphate and aqueous species.The protonation of fast diffusing aqueous species (H3O+) and a corresponding concentration of H2PO4− with increasing water content then evoke other conductivity contributions through the diffusion of these species as a whole (vehicle mechanism). In the “transition regime” (H3PO4–H3PO4·2H2O corresponding to λ = 3–7), conductivity contributions from this mechanism increase on the expense of contributions from structure diffusion. For higher water contents (λ > 7), where the hydrogen bond network between phosphate species is disrupted and frustration is relaxed through proton transfer to aqueous species, phosphoric acid–water mixtures behave like aqueous solutions of other oxo-acids such as sulfuric and sulfonic acids. The latter are stronger acids with very weak hydrogen bonding in the pure acid and very little self-dissociation and ionic conductivity. The addition of water to these acids leads to proton transfer from acid to water, where the protonic charge is highly stabilized. The high ionic conductivity of such mixtures therefore exclusively originates from the mobility of protonated water molecules (H3O+) and the conjugate base (HSO4− or –SO3−)67 at any water content.
For phosphoric acid one should keep in mind that its high hygroscopicity (which is another consequence of hydrogen bond network frustration, see above) leads to significant water uptake, even at low relative humidity (Fig. 2). Then, the presence of a protonic current induces a water flux as a consequence of emerging vehicle-type conductivity. This is expected to change the local water content, i.e., water is depleted at the anode while it tends to accumulate at the cathode. Since proton conductivity is sensitively dependent on the water content in this system, this is expected to lead to a change in proton conductivity in the presence of ionic currents. As we will show in a forth coming publication,68 this effect is critical for the application of phosphoric acid containing electrolytes used in high-drain electrochemical applications such as fuel cells. We will also provide a rational for the observation that electroosmotic water drag in poly-benzimidazole/phosphoric acid membranes is low.69
On the dry side of neat phosphoric acid (λ < 3), proton diffusion is even further de-coupled from phosphate diffusion (“de-coupling regime”), but this mainly reflects the increasing retardation of the diffusion of the increasingly larger phosphate species (condensation products). Condensation goes along with a further acidity increase (see Scheme 1) which leads to the formation of highly charged phosphate anions, such as H2P2O72−, H3P3O102− and H2P3O103−, coexisting with smaller singly charged cations (mainly H4PO4+). With decreasing water content, the system therefore progressively behaves like an ionic liquid. But even for the conductivity of pure di-phosphoric acid, there is a structural diffusion contribution of close to half of the total conductivity,15 which was shown to be one consequence of the fact that the central oxygen is excluded from any participation within the hydrogen bond network, keeping the degree of frustration relatively high. With this, di-phosphoric acid has not only a significant proton conductivity (approx. 10−1 S cm−1 at T = 160 °C), but it also exists at a very low relative humidity (Fig. 2) of RH ∼ 0.01%. It is actually thermodynamically stabilized by ambient humidity at temperatures around T = 200 °C, which makes di-phosphoric acid a true intermediate temperature proton conductor with very high conductivity.
Acknowledgements
The authors would like to thank A. Fuchs for preparing and analyzing the aqueous solutions, as well as for Impedance Spectroscopy measurements, and U. Klock and M. L. Schreiber for help with TGA/humidification and IR-Spectroscopy, respectively. Furthermore we thank E. Schmitt and the MPI glass workshop for building the transference cell and the humidifier system. We are particularly grateful to L. Vilčiauskas and R. Krueger (Caltech) for valuable discussions and thank R. Krueger and I. Moudrakovski (MPI FKF) for proofreading the manuscript. We would like to thank R. F. Savinell (Case Western Reserve University) for making the DOE report45 available to us. The authors kindly acknowledge financial support by the Bundesministerium für Bildung und Forschung and Energie Baden Württemberg EnBW (project PSUMEA-2 No. 03SF0473).References
- L. Vilčiauskas, M. E. Tuckerman, G. Bester, S. J. Paddison and K. D. Kreuer, Nat. Chem., 2012, 4, 461–466 CrossRef PubMed.
- B. Frick, L. Vilčiauskas, P. P. Deen and S. Lyonnard, Solid State Ionics, 2013, 252, 26–33 CrossRef CAS.
- R. A. Munson, J. Phys. Chem., 1964, 68, 3374–3377 CrossRef CAS.
- T. Dippel, K. D. Kreuer, J. C. Lassègues and D. Rodriguez, Solid State Ionics, 1993, 61, 41–46 CrossRef CAS.
- Y. Aihara, A. Sonai, M. Hattori and K. Hayamizu, J. Phys. Chem. B, 2006, 110, 24999–25006 CrossRef CAS PubMed.
- H. E. W. Phillips, J. Chem. Soc., Trans., 1909, 95, 59–66 RSC.
- A. Smith and A. W. C. Menzies, J. Am. Chem. Soc., 1909, 31, 1191–1194 CrossRef.
- N. N. Greenwood and A. Thompson, J. Chem. Soc., 1959, 3485–3492 RSC.
- N. N. Greenwood and A. Thompson, J. Chem. Soc., 1959, 3864–3867 RSC.
- R. A. Munson and M. E. Lazarus, J. Phys. Chem., 1967, 71, 3245–3248 CrossRef CAS.
- D.-T. Chin and H. Chang, J. Appl. Electrochem., 1989, 19, 95–99 CrossRef CAS.
- S. H. Chung, S. Bajue and S. G. Greenbaum, J. Chem. Phys., 2000, 112, 8515–8521 CrossRef CAS.
- C. Korte, in Fuel Cells Science and Engineering – Materials, Processes, Systems and Technologies, ed. B. Emonts and D. Stolten, Wiley, 2012, vol. 1, pp. 335–359 Search PubMed.
- Y. Wang, N. A. Lane, C.-N. Sun, F. Fan, T. A. Zawodzinski and A. P. Sokolov, J. Phys. Chem. B, 2013, 117, 8003–8009 CrossRef CAS PubMed.
- R. A. Krueger, L. Vilčiauskas, J.-P. Melchior, G. Bester and K. D. Kreuer, J. Phys. Chem. B, 2015, 119, 15866–15875 CrossRef CAS PubMed.
- A.-L. Huhti and P. A. Gartaganis, Can. J. Chem., 1956, 34, 785–797 CrossRef CAS.
- R. F. Jameson, J. Chem. Soc., 1959, 752–759 RSC.
- N. Agmon, Chem. Phys. Lett., 1995, 244, 456–462 CrossRef CAS.
- M. Tuckerman, K. Laasonen, M. Sprik and M. Parrinello, J. Chem. Phys., 1995, 103, 150–161 CrossRef CAS.
- A. Hassanali, F. Giberti, J. Cuny, T. D. Kühne and M. Parrinello, Proc. Natl. Acad. Sci. U. S. A., 2013, 110, 13723–13728 CrossRef CAS PubMed.
- K. D. Kreuer, W. Weppner and A. Rabenau, Solid State Ionics, 1981, 3–4, 353–358 CrossRef CAS.
- K. D. Kreuer, A. Rabenau and W. Weppner, Angew. Chem., Int. Ed., 1982, 21, 208–209 CrossRef.
- F. H. Westheimer, Science, 1987, 235, 1173–1178 CAS.
- M. W. Bowler, M. J. Cliff, J. P. Waltho and G. M. Blackburn, New J. Chem., 2010, 34, 784–794 RSC.
- K. D. Kreuer, Chem. Mater., 1996, 8, 610–641 CrossRef CAS.
- J. Heberle, J. Riesle, G. Thiedmann, D. Oesterhelt and N. A. Dencher, Nature, 1994, 370, 379–382 CrossRef CAS PubMed.
- U. Reimer, J. Ehlert, H. Janßen and W. Lehnert, Int. J. Hydrogen Energy, 2016, 41, 1837–1845 CrossRef CAS.
- S. Galbiati, A. Baricci, A. Casalegno and R. Marchesi, Int. J. Hydrogen Energy, 2012, 37, 2462–2469 CrossRef CAS.
- D. Bezmalinovic, S. Strahl, V. Roda and A. Husar, Int. J. Hydrogen Energy, 2014, 39, 10627–10640 CrossRef CAS.
- J. Mader, L. Xiao, T. J. Schmidt and B. C. Benicewicz, in Fuell Cells II, ed. G. G. Scherer, Springer Berlin Heidelberg, 2008, pp. 63–124 Search PubMed.
- Q. Li, J. O. Jensen, R. F. Savinell and N. J. Bjerrum, Prog. Polym. Sci., 2009, 34, 449–477 CrossRef CAS.
- M. Molleo, T. Schmidt and B. Benicewicz, in Fuel Cells, ed. K. D. Kreuer, Springer, New York, 2013, pp. 391–431 Search PubMed.
- Q. Li, D. Aili, H. A. Hjuler and J. O. Jensen, High Temperature Polymer Electrolyte Membrane Fuel Cells – Approaches, Status, and Perspectives, Springer International Publishing, Cham Heidelberg New York Dordrecht London, 2016 Search PubMed.
- Y. Ansari, T. G. Tucker and C. A. Angell, J. Power Sources, 2013, 237, 47–51 CrossRef CAS.
- Y. Abe, G. M. Li, M. Nogami, T. Kasuga and L. L. Hench, J. Electrochem. Soc., 1996, 143, 144–147 CrossRef CAS.
- D. A. Boysen, T. Uda, C. R. I. Chisholm and S. M. Haile, Science, 2004, 303, 68–70 CrossRef CAS PubMed.
- M. Nagao, A. Takeuchi, P. Heo, T. Hibino, M. Sano and A. Tomitab, Electrochem. Solid-State Lett., 2006, 9, A105–A109 CrossRef CAS.
- Y. Jin, Y. Shen and T. Hibino, J. Mater. Chem., 2010, 20, 6214–6217 RSC.
- K. D. Kreuer, Solid State Ionics, 2013, 252, 93–101 CrossRef CAS.
- J.-P. Melchior, PhD thesis, Universität Stuttgart, 2015.
- W. S. Price, NMR Studies of Translational Motion – Principles and Applications, Cambridge University Press, Cambridge, 2009 Search PubMed.
- Monsanto, Technical Bulletin IC/DP-239.
- D. I. MacDonald and J. R. Boyack, J. Chem. Eng. Data, 1969, 14, 380–384 CrossRef CAS.
- A. F. Kerst, in Environmental Phosphorus Handbook, ed. E. J. Griffith, A. M. Beeton, J. M. Spencer and D. T. Mitchell, John Wiley & Sons, New York, 1973, ch. 12, pp. 265–279 Search PubMed.
- S. Sarangapani, P. Bindra and E. Yeager, Physical and Chemical Properties of Phosphoric Acid, Report DE-AC02-76CH00016, U.S. Department of Energy, 1981.
- R. A. Y. Jones and A. R. Katritzky, J. Inorg. Nucl. Chem., 1960, 15, 193–194 CrossRef CAS.
- M. M. Crutchfield, C. F. Callis, R. R. Irani and G. C. Roth, Inorg. Chem., 1962, 1, 813–817 CrossRef CAS.
- H. T. Edzes, Magn. Reson. Chem., 1992, 30, 850–854 CrossRef CAS.
- A. Novak, Structure and Bonding, Springer Berlin Heidelberg, 1974, vol. 18, pp. 177–216 Search PubMed.
- A. C. Chapman and L. E. Thirlwell, Spectrochim. Acta, 1964, 20, 937–947 CrossRef CAS.
- W. Rudolph and W. E. Steger, Z. Phys. Chem., 1991, 172, 49–59 CAS.
- W. W. Rudolph, Dalton Trans., 2010, 39, 9642–9653 RSC.
- W. Rudolph, J. Solution Chem., 2012, 41, 630–645 CrossRef CAS.
- H. Alig, J. Lösel and M. Trömel, Z. Kristallogr., 1994, 209, 18–21 CAS.
- H. A. Christ, P. Diehl, H. Schneider and H. Dahn, Helv. Chim. Acta, 1961, 44, 865–880 CrossRef CAS.
- I. P. Gerothanassis and N. Sheppard, J. Magn. Reson., 1982, 46, 423–439 CAS.
- L. Vilčiauskas, PhD thesis, Universität Stuttgart, 2012.
- M. Falk and P. A. Giguère, Can. J. Chem., 1957, 35, 1195–1204 CrossRef CAS.
- P. A. Giguère and S. Turrell, Can. J. Chem., 1976, 54, 3477–3482 CrossRef.
- M. Schuster, K. D. Kreuer, H. Steininger and J. Maier, Solid State Ionics, 2008, 179, 523–528 CrossRef CAS.
- K. D. Kreuer, S. J. Paddison, E. Spohr and M. Schuster, Chem. Rev., 2004, 104, 4637–4678 CrossRef CAS PubMed.
- M. Spaeth, K. D. Kreuer, T. Dippel and J. Maier, Solid State Ionics, 1997, 97, 291–297 CrossRef CAS.
- K. D. Kreuer, Solid State Ionics, 1997, 94, 55–62 CrossRef CAS.
- A. Schechter and R. F. Savinell, Solid State Ionics, 2002, 147, 181–187 CrossRef CAS.
- CRC Handbook of Chemistry and Physics, CRC Press, Boca Raton, 94th edn, 2013 Search PubMed.
- K. L. Elmore, J. D. Hatfield, R. L. Dunn and A. D. Jones, J. Phys. Chem., 1965, 69, 3520–3525 CrossRef CAS.
- A. Telfah, G. Majer, K. D. Kreuer, M. Schuster and J. Maier, Solid State Ionics, 2010, 181, 461–465 CrossRef CAS.
- J.-P. Melchior, G. Majer and K. D. Kreuer, Phys. Chem. Chem. Phys., 2016 10.1039/c6cp05331a.
- D. Weng, J. S. Wainright, U. Landau and R. F. Savinell, J. Electrochem. Soc., 1996, 143, 1260–1263 CrossRef CAS.
Footnote |
| † Electronic supplementary information (ESI) available. See DOI: 10.1039/c6cp04855b |
| This journal is © the Owner Societies 2017 |

