A heat capacity model of T3/2 dependence for quantum dots†
Received
19th October 2016
, Accepted 19th November 2016
First published on 22nd November 2016
Abstract
This article addresses the heat capacity of quantum dots (QDs) using density functional theory (DFT). By analyzing the evolution of phonon density of states and heat capacity as CdSe clusters grow from a molecular cluster into larger quantum confined solids, we have shown that their heat capacity does not fit very well with the Debye T3 model. We observed that the number of phonon modes, which is discrete, increases as the particles grow, and the dispersion relation shows a quadratic behavior in contrast to the bulk solids whose dispersion relation is linear and equal to the sound velocity. The phonon density of states showed a square root variation with respect to frequency whereas that of the bulk is a quadratic variation of frequency. From the observed variation in the phonon density of states and holding the fact that the atomic vibrations in solids are elastically coupled, we have re-derived the expression for total energy of the QDs and arrive at a T3/2 model of heat capacity, which fits very well to the observed heat capacity data. These results give promising directions in the understanding of the evolution of the thermophysical properties of solids.
1. Introduction
Colloidal semiconducting nanostructures with sizes less than their exciton Bohr radius at least in one of their dimensions, known as quantum confined structures (QCSs), offer unique technological and fundamental opportunities. Many QCSs, viz. quantum dots (QDs), quantum wires (QWs), and quantum sheets (QSs) of semiconductors,1,2 have been extensively studied experimentally and theoretically.3 As the size of QCSs decreases, the allowed energy bands become substantially broader than that of the corresponding bulk solid, leading to a larger spacing of energy levels than that of the bulk semiconducting crystal.4 Technologically, the size-dependent optoelectronic properties of QCSs are exploitable to develop tunable absorbers and emitters in nanoscale electronics, high power lasers, quantum computing, and so on. On the other hand, fundamentally, the QCSs offer an opportunity to study the evolution of the bulk properties of matter.
The thermophysical properties of the QCSs (i.e., zero-point energy, entropy, thermal energy, heat capacity, enthalpy, and Gibbs free energy) have attracted increasing research attention because their evolution is still not clearly understood.5 The experimental studies of QCSs meet some difficulties due to the small size of these structures,6 which has resulted in very few studies focusing on the effects of size on the thermodynamic properties, especially the heat capacity of QCSs.1 Much attention has been paid to how quantum confinement affects the heat capacity of QCSs7 compared to the corresponding bulk materials predicted by the Debye T3 model.8 The failure of the Debye T3 model for very small particles has been noticed as early as 1921,9 suggesting the development of theoretical models based on experimental observations to understand the evolution of the thermophysical properties of QCSs.10
Novotny et al.11 experimented on fine lead particles of 2.2, 3.7, and 6.0 nm diameters with a large surface-to-volume ratio, which exhibited non-quadratic behavior of heat capacity at low temperatures. Baltes and Hilf12 solved the scalar wave equation for a homogeneous elastically vibrating sphere under free-surface boundary conditions to model the theoretical heat capacity that was related to the particle radius and effective sound velocity, which has been compared with experimental data of 2.2 nm diameter lead particles.11 Lautenschläger13 extended the theoretical model of Baltes and Hilf12 by proposing temperature-dependent effective sound velocity and size-dependent Debye temperature, and then compared the extended model with the experimental results.11
The theoretical model of Baltes and Hilf12 was also applied by Comsa et al.14 to compare with the experimental heat capacity of ultrafine palladium particles smaller than 10 nm between 1.4 and 30 K, with the realization of heat capacity enhancement of small particles compared with that of bulk materials.6,13–15 This phenomenon can be related to the modulation of the frequency spectrum of phonons due to surface and size effects.15 Nishiguchi and Sakuma15 refined the theoretical model of Baltes and Hilf12 by solving a vector wave equation rather than the scalar one, and comparing the refined model with experimental results,11 together with the calculations of the theoretical heat capacity of 2, 3, and 5 nm tungsten particles. Neeleshwar et al.16 used this model to compare with the experimental heat capacity of CdSe QDs of 2.8, 4.1, and 5.6 nm diameters, determined by calorimetric studies in the low temperature range (0.3 to 40 K).
Some researchers1,7 argued that for a very small number of atoms along specific spatial directions in QCSs, the contribution of discretized lattice vibration modes in those directions should be evaluated by summation over wave vector components, rather than replacement by an integral in the Debye model. Prasher and Phelan1 used this argument to derive a non-dimensional form of the Debye model by considering the size effect on the heat capacity of nanoparticles to be a function of a dimensionless variable, related to the effective number of atoms and temperature. This model is compared with the computed heat capacity of a linear chain of atoms using Monte Carlo simulations by McGurn et al.;17 however this theoretical model focused only on the number of atoms along spatial directions rather than the sizes of QCSs. This argument has also been used by McNamara et al.7 to derive a set of theoretical models, which found that planar vibrational modes are responsible for the T2 dependence of heat capacity for QS, while axial vibrational modes for the T dependence of heat capacity of QW: both expressions in terms of reduced temperature and the number of atoms along specific dimensions.
Wang et al.18 studied the contribution of size and surface effects on acoustic and optical phonons, by calculating the heat capacity of CuO nanoparticles of different diameters and particle shapes, and also proposed a modification of the dimensionless variable from Prasher and Phelan.1 Another set of theoretical models proposed by Huang et al.19 evaluated the heat capacity and Debye temperature of QW and QS; it was found that the dispersion relation, acoustic heat capacity, and effective Debye temperature are influenced by longitudinal and transverse sound velocities. Zhu et al.20 modeled the heat capacity of metallic nanoparticles, predicted fairly consistently with the available experimental and theoretical results in the high temperature range (150 to 380 K).
Gafner et al.6 suggested the consideration of computer models and simulations as a possible approach for studying QCSs, by applying molecular dynamics calculations using a tight-binding potential to compute the heat capacity of ideal metallic nanoclusters with diameters of up to 6 nm, in the high temperature range (150 to 800 K). Density functional theory (DFT) calculations have been used to systematically study the structures (i.e., crystal and electronic) and physical properties (i.e., mechanical, thermodynamic, and vibrational) of bulk CdSe; however, the effect of temperature on CdSe QCSs has not been fully addressed.21 The experimental study of CdSe QDs by Neeleshwar et al.16 focused on the contribution of electronic heat capacity and size-dependent Debye temperature.
Previous researchers have proposed many modifications on the Debye model for QCSs; they differ from each other and are specific to the cluster concerned. The previous models also have been tested with theoretical and experimental results in certain temperature ranges only: either in high or low temperature regions. Combining DFT calculations and a first principles approach accepting quantum harmonic atomic oscillations, this research article proposes a modification in the Debye model of heat capacity for QDs, which could be applied to diverse chemical compounds for a wide range of temperatures. This model fits well with the simulated heat capacity using DFT with a high degree of accuracy.
2. Methodology
In this work, CdSe QDs with the molecular formula (CdSe)n, where the subscript n = 6, 13, 16, and 26 represents the number of CdSe molecules, are used as a model system. These QD structures are an extension of the (CdSe)3 cluster of C2V symmetry with a six-membered ring structure of hexagonal shape, well discussed in the literature previously.22–24 CdSe has been the material of choice in this research because it is one of the most investigated II–VI QDs25 due to the ease of synthesis3,22,25 and that its size-dependent absorption edge can be tuned through the entire visible spectrum.25 The CdSe QDs have also received considerable theoretical and experimental focus;26 therefore, they can be considered as prototypical QDs.5
DFT calculations were performed using the Gaussian 09W program package27 using Becke's three-parameter hybrid method28 with the Lee, Yang, and Parr (B3LYP) gradient corrected correlation functional,29 together with standard double-ζ quality LanL2DZ basis sets,30 to optimize the initial CdSe QD clusters based on the CdSe crystal structure from X-ray diffraction (XRD) data. This method of DFT calculations simulates optimized geometries and binding energies very well at low computational cost;24 however, the duration of optimization processes is different for different QD clusters, as larger and complex structures require more time for optimization.
The heat capacity of CdSe QD clusters as a function of temperatures was determined from thermochemical calculations at 32 temperatures from 5 to 400 K. To check the consistency of the results, typical calculations were also performed using the Hartree–Fock (HF) method with LanL2DZ basis sets (HF/LanL2DZ), and using the local-density approximation (LDA) method with LanL2DZ basis sets (LDA/LanL2DZ). The calculations show that the results are in agreement with an accuracy of 0.02 (see ESI†). The plotted heat capacity curves are then fitted using the Debye model of heat capacity to determine the Debye temperature TD of each simulated CdSe QD.
3. Results and discussion
Fig. 1 shows the geometrical structures of the clusters considered in this study. The first three clusters, (CdSe)6, (CdSe)13, and (CdSe)16, are theoretically simulated and experimentally identified earlier,23 followed by the fourth cluster (CdSe)26.24 The results of thermochemical calculations at different temperatures for the optimized CdSe QD clusters are inclusive of total electronic energies E0, zero-point energies EZPE, molar entropies Smolar, molar thermal energies Umolar, molar constant-volume heat capacities CV,molar, thermal enthalpies H, thermal Gibbs free energies G, and the number of vibrational modes n.31 In addition, the results of Smolar, Umolar, and CV,molar are comprised of contributions from translational, rotational, and vibrational motions. Among these parameters, E0 and EZPE are temperature independent, whereas the others are temperature dependent.
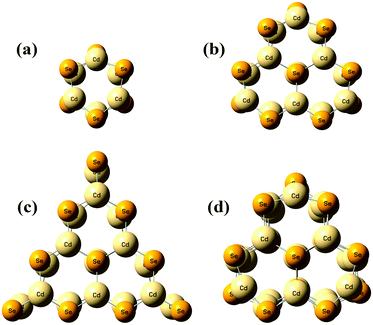 |
| | Fig. 1 Optimized geometries of (a) (CdSe)6, (b) (CdSe)13, (c) (CdSe)16, and (d) (CdSe)26 QD clusters. | |
Fig. 2 shows the variation of CV,molar as a function of temperature for the CdSe QD clusters. We used total molar constant-volume heat capacity CV,total,molar for Fig. 2, which is the sum of CV,molar from the contribution of translational, rotational, and vibrational motions. It is shown that CV,total,molar for all CdSe QD clusters increased as the temperature increased from low to intermediate temperature ranges; however, in the high temperature range, the CV,total,molar remained almost constant.
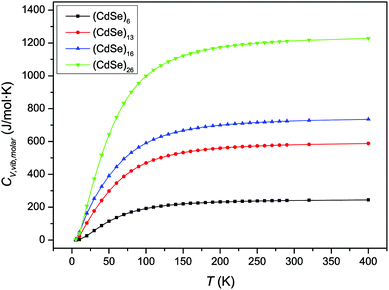 |
| | Fig. 2 Variation of CV,total,molar over temperature for CdSe QD clusters. | |
The increase in the CV,total,molar at intermediate temperatures is due to the quantum of lattice vibration or phonon. In the low and intermediate temperature ranges, only vibrational modes with long wavelengths having an energy ℏω < kBT are thermally excited,32 where ℏ is the reduced Planck constant, ω is the angular frequency, and kB is the Boltzmann constant. As the temperature is increased, the increasing number of thermally excited vibrational modes would increase the vibrational molar thermal energies Uvib,molar and heat capacities CV,vib,molar,33 as well as CV,total,molar.
In the high temperature range, the classical Dulong–Petit law34 based equipartition of energy takes place, with (1/2)kBT of thermal energy being assigned to each of the three degrees of freedom for kinetic energies and three degrees of freedom for potential energies in three-dimensional bulk solids.35 As the CdSe QD clusters grow larger and the number of atoms increases in each cluster, the degrees of freedom are increased as well as their heat capacities in the high temperature range. These observations are consistent with the heat capacity enhancement of small particles as discussed before.6,13–15
As the Debye T3 model considers a solid to be a continuous and elastically coupled harmonic oscillator, it is valid only for bulk solids. The QDs, on the other hand, maintain the bulk periodicity only on an average; their bonds are of considerably different lengths than those of the corresponding bulk solids.22,23 Besides, a single QD particle could be reconsidered as a free, single, individual particle that moved independently like a massive Bose–Einstein particle, or similar to a non-interacting Bose gas,36 with a negligible interaction potential between other individual QD particles. The quantum lattice vibrations (phonons) of this single QD particle are confined (phonon confinement) to propagate within that individual particle, and limited, not interacting and not continuously propagating over other QD particles. Using non-relativistic quantum mechanics and the particle-in-a-box model, relationships between the kinetic energy E, angular frequency ω, momentum p, wave vector k, and number of vibrational modes n, are derived as follows:
| |  | (1) |
where
h is the Planck constant,
m is the mass of individual QD particle, and
L is the quantum confinement size of that QD particle.
The dispersion relation in eqn (1) between the angular frequency ω (or kinetic energy E) and the wave vector k (or the number of vibrational modes n)19,32,37 takes the form of a quadratic curve, which can be proved when the parameters obtained from thermochemical calculations are plotted. For the case of QD particles, the kinetic energy E in eqn (1) can be assigned as molecular vibrational thermal energy Uvib, because the vibrational motion and quantum lattice vibration modes are the main contributors to the kinetic energy of QD particles. Fig. 3 shows the number of discrete phonon modes (n) of the CdSe clusters (solid vertical lines) with Uvib; the locus of which could be fitted to a square root relation (dashed line), using eqn (1). One would see that the number of phonon modes increased with the cluster size. Further, we note that the dispersion relations of QDs as shown in Fig. 3 have some contribution from EZPE (from the x-axis offset of the Uvib). In contrast, the existing Debye T3 model predicted linear dispersion relation for bulk solids with a proportionality constant is the constant sound velocity νs.19,32,37
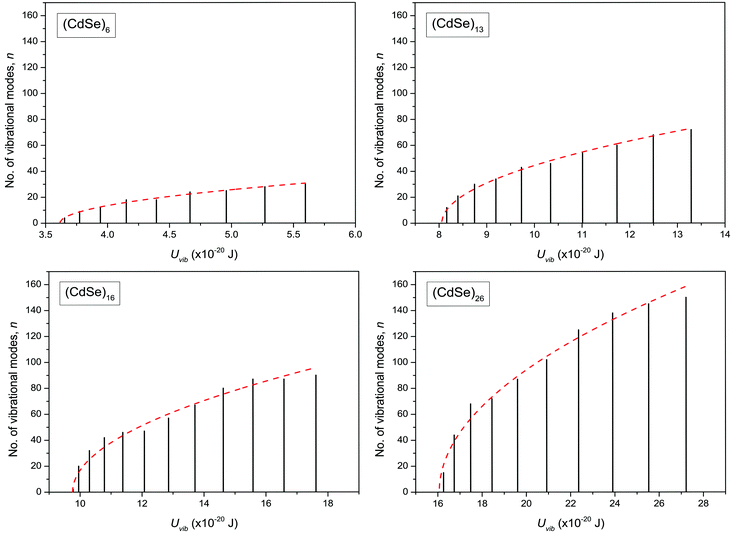 |
| | Fig. 3 Variation of the number of vibrational modes n, with molecular vibrational thermal energy Uvib, in CdSe QD clusters. The solid vertical lines represent the calculated discrete phonon modes and dashed line envelope is the fit using eqn (1). | |
The differences in the dispersion relation between bulk solids and QDs influence the phonon density of states between these two structures. Using the quadratic dispersion relation of QDs from eqn (1), we found that the phonon density of states D(ω) for QDs have a square root relation (see eqn (A7) in Appendix A), as
| |  | (2) |
where
V is the quantum confinement volume of the QD particle. The Debye T
3 model assumed that bulk solids have a quadratic relation of phonon density of states.
32,35,37–39
All these modifications of dispersion relation i.e., eqn (1), and phonon density of states i.e., eqn (2) for QDs led to the derivation of Uvib,molar and CV,vib,molar equations for QDs (see Appendices A and B), different from the existing Debye T3 model. We found that the Debye T3 model of heat capacity for bulk solids changed to the T3/2 model for QDs, as
| |  | (3) |
| |  | (4) |
where
R is the gas constant,
f = 3
N − 6 is the maximum or total vibrational mode for a nonlinear polyatomic QD system of
N number of atoms, and
TD is a new characteristic Debye temperature. Note here that the contribution from
EZPE is not included in the
CV,vib,molar equation for QDs, as it is independent of temperature and did not contribute to
CV,vib,molar, it is therefore neglected.
33
The TD of QDs is to be refined in light of the expression modified definition for CV,vib,molar. The TD of the existing Debye T3 model is directly proportional to the sound velocity νs of the materials,19,32,37 while the new characteristic TD from the T3/2 model depends on the mass m and the degree of freedom f of QDs, as
| |  | (5) |
where
ωD is the maximum cut-off frequency called Debye frequency.
The newly derived expression of the T3/2 model of heat capacity for QDs could be approximated at low and high temperature limits with respect to TD. In the high temperature range in which the temperature is much higher than the Debye temperature (T ≫ TD), the value of x in eqn (3) is much smaller than 1 (x ≪ 1) and the exponential in the integration part of eqn (3) can be expanded as ex ≈ 1 + x to give a simple integration,35 leading to a constant CV,vib,molar as predicted by the classical Dulong–Petit law,34 as follows:
| |  | (6) |
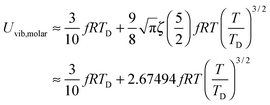
At the low temperature limit, where the temperature is much lower than the Debye temperature (T ≪ TD), the value of x in eqn (3) is much higher than 1 (x ≫ 1) and the upper limit of the integration part of eqn (3) can be taken to be infinite (TD/T ≈ ∞) to give a constant value of definite integration,32,35 and the approximated T3/2 model of heat capacity for QDs in the low temperature range becomes as follows:
| |  | (8) |
| |  | (9) |
where
ζ(
s) is the Riemann zeta function of the complex variable
s = 5/2.
The theoretical model of eqn (4) and (9) is consistent with the suggestion of McNamara et al.7 and Hone,40 which considered if a single acoustic mode in spatial D dimensions that obeys a dispersion relation ω(k) proportional to the bth power of wave vector k (ω ∼ kb), then heat capacity will contain information about both the dimensionality and the phonon dispersion of the system, having a TD/b dependence (CV ∼ TD/b).
The thermochemical results of CV,total,molar for each CdSe QD cluster are fitted with the Debye T3 model, together with the T3/2 model of eqn (4). Fig. 4 shows the fitted Debye T3 and T3/2 models of CV,total,molar, together with a close-up in low and intermediate temperature ranges (0 to 150 K), for CdSe QD clusters. A comparison between these two models is made by comparing the coefficient of determination (R2) values and close observations of each fitted graphs, verified that the T3/2 model best fitted the thermochemically-calculated CV,total,molar data for each CdSe QD cluster (indicated by high R2 values) than the Debye T3 model. From close observation and comparison of both fitted models in certain temperature range, the Debye T3 model does not fit well with thermochemically-calculated CV,total,molar data for CdSe QD clusters, which deviated greatly in the low, intermediate, and high temperature ranges, compared to the fitted T3/2 model.
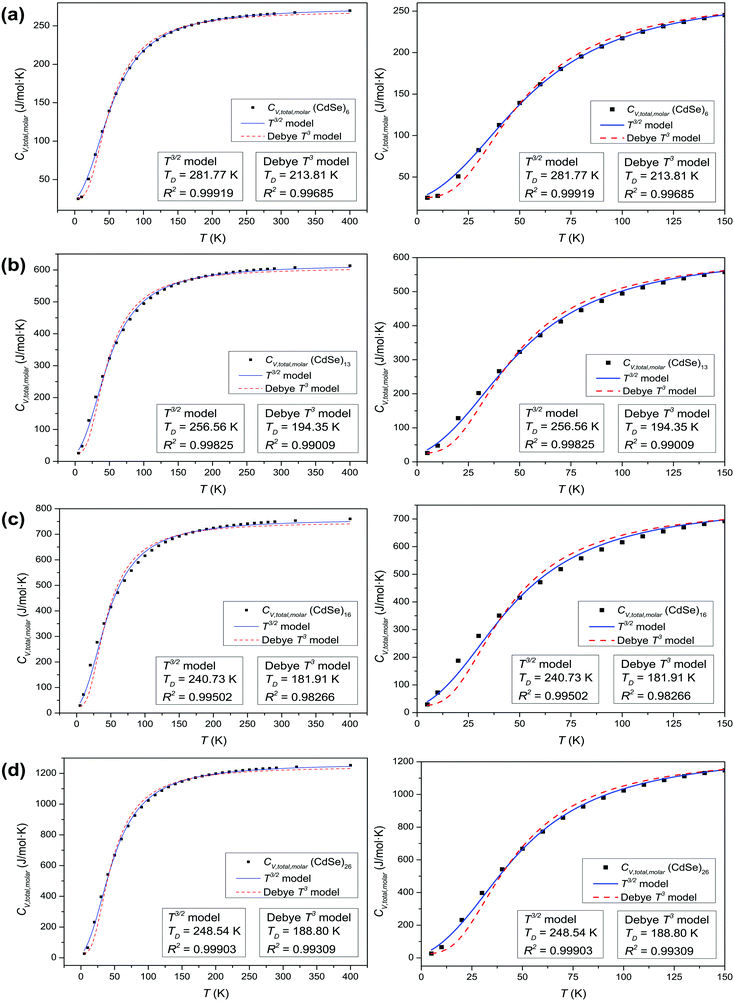 |
| | Fig. 4 Graphs of fitted Debye T3 and T3/2 models of CV,total,molar (left), and a close-up view at low and intermediate temperature ranges (right) for (a) (CdSe)6, (b) (CdSe)13, (c) (CdSe)16, and (d) (CdSe)26 QD clusters. | |
We note that the surface coordination number of atoms in the QCSs has a role in the goodness of fit of the T3/2 model with the calculated CV,total,molar curves. The CV,total,molar curves of (CdSe)6, (CdSe)13, and (CdSe)26 fit better with the T3/2 model than that of the (CdSe)16 cluster. The probable explanation for these observations is that the (CdSe)16 QD cluster behaves slightly different than the other CdSe QD clusters, due to its different molecular structure. Moreover, its geometry is consistent with the fact that the band edge photoluminescence in CdSe is a surface effect.23 As can be seen from Fig. 1(c), the (CdSe)16 QD cluster is made from the (CdSe)13 structure with the addition of an extra 3 units of CdSe located at the edges of the (CdSe)13 QD cluster, which substantially increased its molecular surface area. Due to the general and simplified assumptions made to describe the quantum lattice vibrations or phonons in the quantum confinement effect, and the behavior of QDs in the derivation of a new T3/2 model, the accuracy of the calculated parameter varies in different CdSe QD clusters, especially in the (CdSe)16 QD cluster. However, the observations and analyses presented in Fig. 4 proved that the proposed T3/2 model is a better theoretical model than the Debye T3 model to describe the variation of CV,total,molar for QDs.
Analysis of CdSe QD diameters with the determined TD and R2 values of fitted Debye T3 and T3/2 models for different CdSe QD clusters is shown in Table 1. The diameters of the CdSe QD cluster are reported before.23,24Fig. 5 shows a trend in TD of the QDs compared with that of the bulk CdSe crystal (∼181.7 K).41 The TD decreased with increasing cluster size according to both models. However, the TD determined from the T3/2 model is much higher than that of the bulk CdSe crystal. On the other hand, the TD determined following the T3 model although higher but less pronounced than the T3/2 model. Interestingly, the (CdSe)16 cluster behaved differently according to both models; its determined TD dropped significantly compared to the other CdSe QD clusters, the TD of which even reached a value similar to that of the bulk crystal. This similarity is probably due to its similar emission characteristics as that of the bulk crystal.
Table 1 Analysis and comparison of CdSe QD diameters with the determined TD and R2 values of fitted Debye T3 and T3/2 models for different CdSe QD clusters
| Cluster |
Diameter (nm) |
Debye T3 model |
T3/2 model |
|
T
D (K) |
R
2
|
T
D (K) |
R
2
|
| (CdSe)6 |
1.50 |
213.81 ± 3.03 |
0.99685 |
281.77 ± 2.27 |
0.99919 |
| (CdSe)13 |
1.90 |
194.35 ± 4.82 |
0.99009 |
256.56 ± 2.97 |
0.99825 |
| (CdSe)16 |
2.02 |
181.91 ± 5.91 |
0.98266 |
240.73 ± 4.64 |
0.99502 |
| (CdSe)26 |
2.44 |
188.80 ± 3.94 |
0.99309 |
248.54 ± 2.16 |
0.99903 |
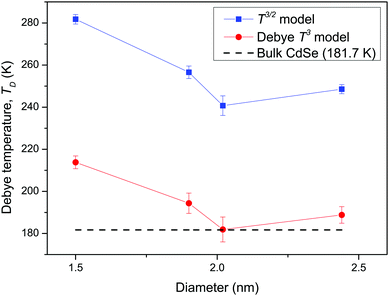 |
| | Fig. 5 Graph of the determined TD of fitted Debye T3 and T3/2 models, versus the diameters of CdSe QD clusters and comparison of the bulk CdSe crystal. | |
The TD determined from T3 and T3/2 can also be used to validate the new model by comparing the EZPE from the thermochemical data and that calculable by integrating the first term in eqn (3) to obtain the first terms in eqn (6) and (8), which are temperature independent (see eqn (A23) and (B18) in the Appendix), as given by eqn (11):
| |  | (10) |
| |  | (11) |
Table 2 shows that the deviation in
EZPE determined from
eqn (11) is less pronounced (<8.05%) than that from
eqn (10) (<14%), thereby confirming that the modified T
3/2 model more accurately approximates the thermochemical data than the Debye T
3 model for the QDs. Here too, a larger deviation is noted in the (CdSe)
16 cluster.
Table 2 Comparison of thermochemically calculated EZPE with determined EZPE from eqn (10) and (11) using determined TD values of fitted Debye T3 and T3/2 models for different CdSe QD clusters
| Cluster |
Thermochemically calculated EZPE (×10−20 J) |
E
ZPE (×10−20 J) from eqn (10) of the Debye T3 model |
E
ZPE (×10−20 J) from eqn (11) of the T3/2 model |
| (CdSe)6 |
3.56256 |
3.32096 |
3.50123 |
| (CdSe)13 |
8.04900 |
7.24489 |
7.65114 |
| (CdSe)16 |
9.75812 |
8.47645 |
8.97383 |
| (CdSe)26 |
16.0448 |
14.6625 |
15.4416 |
4. Conclusions
In conclusion, the evaluation of heat capacity of CdSe QD clusters using DFT revealed that they exhibit a different thermophysical behavior compared to that of the bulk CdSe crystal due to the quantum confinement effect. The focus of this research is to analyze the effect of quantum confinement on the Debye T3 model of heat capacity, which is proven having some degree of deviation from the heat capacity curves. The T3 model therefore requires modifications to best represent the heat capacity data with higher accuracy. We observed that the source of this deviation is due to (i) phonon confinement – i.e., occurrence of discrete phonon frequencies in QDs rather than being continuous in the bulk; (ii) increase of the number and energy of phonon modes as the particles grow; and (iii) a drastically different dispersion relation of the QDs compared to the bulk. The phonon density of states showed a square root variation with respect to frequency whereas that of bulk is the quadratic of frequency. Using the above phonon density of states, we have re-derived the expression for the total energy of the QDs and arrive at a T3/2 model of heat capacity, which fits very well to the observed heat capacity data. Consistency of the new model has been further tested by calculating the zero-point energy dependence on Debye temperatures employing both models. The above test confirmed that the T3/2 model more accurately approximates the thermochemical data for the QDs compared to the T3 model.
Appendix
A. Derivation of the T3/2 model from phonon density of states D(ω)
The energy of a quantum lattice vibration or phonon mode n of angular frequency ω in QD particles could be regarded as kinetic energy E, due to the main contribution of QD particle's kinetic energy from the vibrational motion and quantum lattice vibration modes. Using non-relativistic quantum mechanics and the particle-in-a-box model, the relationships between the kinetic energy E, angular frequency ω, momentum p, wave vector k, and number of vibrational modes n, are determined as follows:| |  | (A1) |
where m is the mass of an individual QD particle and L is the quantum confinement size of that QD particle. Thus, eqn (A1) can be rearranged to give the quadratic dispersion relation ω(k) for QDs, as follows:| |  | (A2) |
Fig. 3 shows evidence of the change of dispersion relation; from proportional function for bulk materials19,32,37 to quadratic function of eqn (A2) for QDs. The difference in the dispersion relation ω(k) between bulk solids and QDs influenced the phonon density of states D(ω) between these two structures. The phonon density of states D(ω) for three-dimensional QDs could be derived by determination of the volume of k-space of a single state Vstate after consideration of periodic boundary conditions, to obtain an expression of
| |  | (A3) |
where
V =
LxLyLz is the quantum confinement volume of QD. The total volume of
k-space of all number of states could be considered enclosed in a sphere of volume
Vtotal:
| |  | (A4) |
Thus, the number of states in the total volume of
k-space,
n(
k), with wave vector less than
k is given by
| |  | (A5) |
By applying the quadratic dispersion relation of
eqn (A2) in
n(
k),
eqn (A5) could be written as
| |  | (A6) |
The phonon density of states
D(
ω) is the number of modes
n(
ω) per unit frequency range
ω, which has a square root relation for QDs, as follows:
| |  | (A7) |
All modifications of the quadratic dispersion relation i.e., eqn (A2), and the square root phonon density of states i.e., eqn (A7) for QDs could be used to modify the derivation of Uvib,molar, as well as the CV,vib,molar expression for the QDs. The next section of derivation of Uvib,molar and CV,vib,molar expressions for QDs is adapted from Kittel.32 The vibrational thermal energy Uvib for QDs is considered as a sum of vibrational energies from the contribution of quantum lattice vibrations or phonon modes from eqn (A1), including the contribution from EZPE, to get
| |  | (A8) |
| |  | (A9) |
where 〈
nvib,n〉 is the thermal equilibrium occupancy of a phonon with vibrational mode
n,
ωvib,n is the characteristic vibrational frequency of a phonon with vibrational mode
n, and
f = 3
N − 6 is the maximum or total vibrational mode for a nonlinear polyatomic QD system of
N number of atoms. For a QD particle that is in thermal equilibrium, 〈
nvib,n〉 could be regarded as the average excitation phonon number 〈
n〉 given by the Bose–Einstein distribution, as follows:
| |  | (A10) |
The Uvib of a collection of phonons of frequencies ωvib,n for QDs is then found from eqn (A9) and (A10) as
| |  | (A11) |
The summation of
eqn (A11) could be replaced by an integration, considering that the QD particle has
D(
ω)d
ω phonon modes in the frequency range
ω to
ω + d
ω. Hence,
eqn (A11) could be written as
| |  | (A12) |
The maximum, upper limit of integration of
eqn (A12) could be found by letting the number of states
n(
k) of
eqn (A5), and
n(
ω) of
eqn (A6), to reach the maximum of total vibrational mode
f = 3
N − 6 for a nonlinear polyatomic QD system of
N number of atoms, which could be related to the maximum, cut-off wave vector
kD and the cut-off frequency
ωD:
| |  | (A13) |
| |  | (A14) |
The inclusion of the maximum, upper limit of integration of
eqn (A14),
Uvib of
eqn (A12) is written as
| |  | (A15) |
where
ωD is the maximum, cut-off frequency called the Debye frequency, defined by
eqn (A14). The substitution of quadratic
D(
ω) from
eqn (A7) into
Uvib of
eqn (A15) gives
| |  | (A16) |
The integration part of
eqn (A16) could be evaluated by substituting the exponential term of
eqn (A16) with
x, as follows:
| |  | (A17) |
and the
Uvib of
eqn (A16) could be simplified as
| |  | (A18) |
where
xD is the maximum, upper limit of integration, which could be related to the Debye frequency
ωD of
eqn (A14) and the Debye temperature
TD as
| |  | (A19) |
This equation gives a new expression of
TD for QDs after substitution of
ωD of
eqn (A14) into
eqn (A19), which could be defined as
| |  | (A20) |
The expression of TD for QDs in eqn (A20) is changed due to consideration of the quantum confinement effect, compared with the expression of TD for bulk materials. The expression of Uvib from eqn (A18) could be represented as a function of the new TD, as follows:
| |  | (A21) |
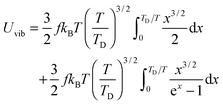
the integration term of which could be extended to get
| |  | (A22) |
and then the first term of integral could be solved to get
| |  | (A23) |
Therefore, the vibrational constant-volume heat capacity
CV,vib of QDs is the temperature derivative of
Uvib from
eqn (A23), resulting in the following equation:
| |  | (A24) |
Expressions of
Uvib,molar and
CV,vib,molar are
| |  | (A25) |
| |  | (A26) |
Note that the first terms of
eqn (A23) and (A25) are temperature independent, and from the previous derivation, those terms are related to
EZPE and molar zero-point energy
EZPE,molar, as follows:
| |  | (A27) |
| |  | (A28) |
B. Derivation of the T3/2 model using spherical coordinates and a triple integral
The new T3/2 model for QDs could be derived using spherical coordinates and a triple integral, which yielded similar equations of Uvib,molar as eqn (A25), and of CV,vib,molar as eqn (A26). The derivation uses the relationship between the kinetic energy E and the number of vibrational modes n, in eqn (A1) to relate to energy En of quantum lattice vibrations or phonons for QDs, confined in a three-dimensional infinite potential well of quantum confinement size L, as follows:| |  | (B1) |
where V = L3 is the quantum confinement volume of QDs. The Uvib for QDs is considered as the sum of vibrational energies from the contribution of n from eqn (B1), including the contribution from EZPE, to obtain| |  | (B2) |
| |  | (B3) |
where 〈n〉 is the average excitation phonon number given by the Bose–Einstein distribution, similar to eqn (A10):| |  | (B4) |
The difference between eqn (A8) and (A9) and eqn (B2) and (B3), as well as between eqn (A10) and eqn (B4), is the energy term (ℏω and En). Substitution of eqn (B4) into eqn (B3) yielded the following equation:| |  | (B5) |
Eqn (B5) demonstrated that the vibrational mode n is propagating only in one dimension. For the three-dimensional case, eqn (B5) could be generalized as follows:| |  | (B6) |
which included the contributions of nx, ny, and nz vibrational modes. The triple summation from eqn (B6) could be replaced by a triple integral as follows:| |  | (B7) |
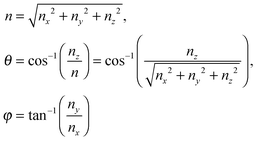
where the upper limit of each integration is the maximum number of vibrational modes nmax of each dimension (nx, ny, and nz). To evaluate the triple integral, spherical coordinates are introduced as follows:| | (nx, ny, nz) = (n![[thin space (1/6-em)]](https://www.rsc.org/images/entities/char_2009.gif) sin sin![[thin space (1/6-em)]](https://www.rsc.org/images/entities/char_2009.gif) θ θ![[thin space (1/6-em)]](https://www.rsc.org/images/entities/char_2009.gif) cos cos![[thin space (1/6-em)]](https://www.rsc.org/images/entities/char_2009.gif) φ, n φ, n![[thin space (1/6-em)]](https://www.rsc.org/images/entities/char_2009.gif) sin sin![[thin space (1/6-em)]](https://www.rsc.org/images/entities/char_2009.gif) θ θ![[thin space (1/6-em)]](https://www.rsc.org/images/entities/char_2009.gif) sin sin![[thin space (1/6-em)]](https://www.rsc.org/images/entities/char_2009.gif) φ, n φ, n![[thin space (1/6-em)]](https://www.rsc.org/images/entities/char_2009.gif) cos cos![[thin space (1/6-em)]](https://www.rsc.org/images/entities/char_2009.gif) θ) θ) | (B8) |
which
where n is the number of vibrational modes which is related to radial distances, θ is the polar angle, and φ is the azimuthal angle of spherical coordinates. Therefore, QDs could be approximated by an eighth (positive values of spherical coordinates) of a sphere in spherical coordinates, to solve eqn (B7) as follows:| |  | (B9) |
where Rsphere is the radius of the sphere in spherical coordinates, which could be found by conserving a maximum of total vibrational modes f = 3N − 6 for a nonlinear polyatomic QD system of N number of atoms, in the eighth (positive values of spherical coordinates) of volume Vsphere of sphere in spherical coordinates, as follows:| |  | (B10) |
Substitution of the En term from eqn (B1) and the Rsphere term from eqn (B10) into eqn (B9), following with solution of first two integrations gives the following equation:| |  | (B11) |
The integration part of eqn (B11) could be evaluated by substituting the exponential term of eqn (B11) with x, as follows:| | 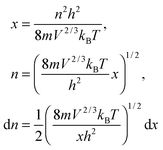 | (B12) |
and the substitution of eqn (B12) into Uvib of eqn (B11) yielded eqn (B13), which is equivalent to eqn (A18) in previous derivation:| |  | (B13) |
where xD is the maximum, upper limit of integration, which could be evaluated with the Rsphere term from eqn (B10) and related to the Debye temperature TD as follows:| |  | (B14) |
This equation gives the same expression of TD for QDs as eqn (A20) as before:| |  | (B15) |
Substitution of TD of eqn (B15) into the expression of Uvib from eqn (B13), the derivation yielded eqn (B16):| |  | (B16) |
the integration term of which could be extended to get eqn (B17):| | 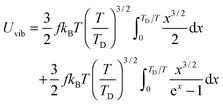 | (B17) |
and then the first term of integral could be solved to get eqn (B18):| |  | (B18) |
Therefore the CV,vib of QDs is the temperature derivative of Uvib from eqn (B18), resulting in eqn (B19):| |  | (B19) |
The expressions of Uvib,molar and CV,vib,molar are| |  | (B20) |
| |  | (B21) |
Note that the first terms of eqn (B18) and (B20) are temperature independent, and from both derivations, these terms could be related to EZPE and EZPE,molar, as eqn (B22) and (B23):| |  | (B22) |
| |  | (B23) |
Acknowledgements
The authors would like to thank the members of Nanostructured Renewable Energy Materials Laboratory (N-REM Lab), Faculty of Industrial Sciences and Technology (FIST), and Universiti Malaysia Pahang (UMP) for their continuous support, discussions, and contributions to this research.
References
- R. S. Prasher and P. E. Phelan, Int. J. Heat Mass Transfer, 1999, 42, 1991 CrossRef CAS.
- A. M. Smith and S. Nie, Acc. Chem. Res., 2010, 43, 190 CrossRef CAS PubMed.
- U. E. H. Laheld and G. T. Einevoll, Phys. Rev. B: Condens. Matter Mater. Phys., 1997, 55, 5184 CrossRef CAS.
- K. E. Andersen, C. Y. Fong and W. E. Pickett, J. Non-Cryst. Solids, 2002, 302, 1105 CrossRef.
- E. Rabani, J. Chem. Phys., 2001, 115, 1493 CrossRef CAS.
- Y. Y. Gafner, S. L. Gafner, I. S. Zamulin, L. V. Redel and V. S. Baidyshev, Phys. Met. Metallogr., 2015, 116, 568 CrossRef.
- A. J. McNamara, B. J. Lee and Z. M. Zhang, Nanoscale Microscale Thermophys. Eng., 2010, 14, 1 CrossRef.
- P. Debye, Ann. Phys., 1912, 39, 789 CrossRef CAS.
- C. Schaefer, Z. Phys., 1921, 7, 287 CrossRef.
- C. C. Yang and Y. W. Mai, Mater. Sci. Eng., R, 2014, 79, 1 CrossRef.
- V. Novotny, P. P. Meincke and J. H. Watson, Phys. Rev. Lett., 1972, 28, 901 CrossRef CAS.
- H. P. Baltes and E. R. Hilf, Solid State Commun., 1973, 12, 369 CrossRef CAS.
- R. Lautenschläger, Solid State Commun., 1975, 16, 1331 CrossRef.
- G. H. Comsa, D. Heitkamp and H. S. Räde, Solid State Commun., 1977, 24, 547 CrossRef CAS.
- N. Nishiguchi and T. Sakuma, Solid State Commun., 1981, 38, 1073 CrossRef.
- S. Neeleshwar, C. L. Chen, C. B. Tsai, Y. Y. Chen, C. C. Chen, S. G. Shyu and M. S. Seehra, Phys. Rev. B: Condens. Matter Mater. Phys., 2005, 71, 201307 CrossRef.
- A. R. McGurn, P. Ryan, A. A. Maradudin and R. F. Wallis, Phys. Rev. B: Condens. Matter Mater. Phys., 1989, 40, 2407 CrossRef CAS.
- B. Wang, L. Zhou and X. Peng, Int. J. Thermophys., 2006, 27, 139 CrossRef CAS.
- M. J. Huang, T. M. Chang, C. K. Liu and C. K. Yu, Int. J. Heat Mass Transfer, 2008, 51, 4470 CrossRef CAS.
- Y. F. Zhu, J. S. Lian and Q. Jiang, J. Phys. Chem. C, 2009, 113, 16896 CrossRef CAS.
- Z. Fan, A. O. Yalcin, F. D. Tichelaar, H. W. Zandbergen, E. Talgorn, A. J. Houtepen, T. J. H. Vlugt and M. A. van Huis, J. Am. Chem. Soc., 2013, 135, 5869 CrossRef CAS PubMed.
- A. Puzder, A. J. Williamson, F. Gygi and G. Galli, Phys. Rev. Lett., 2004, 92, 217401 CrossRef PubMed.
- R. Jose, N. U. Zhanpeisov, H. Fukumura, Y. Baba and M. Ishikawa, J. Am. Chem. Soc., 2006, 128, 629 CrossRef CAS PubMed.
- S. K. Muzakir, N. Alias, M. M. Yusoff and R. Jose, Phys. Chem. Chem. Phys., 2013, 15, 16275 RSC.
- M. Del Ben, R. W. A. Havenith, R. Broer and M. Stener, J. Phys. Chem. C, 2011, 115, 16782 CrossRef CAS.
- C. Mehta, J. M. Abbas, G. S. S. Saini and S. K. Tripathi, Chalcogenide Lett., 2007, 4, 133 CAS.
-
M. J. Frisch, G. W. Trucks, H. B. Schlegel, G. E. Scuseria, M. A. Robb, J. R. Cheeseman, G. Scalmani, V. Barone, B. Mennucci, G. A. Petersson, H. Nakatsuji, M. Caricato, X. Li, H. P. Hratchian, A. F. Izmaylov, J. Bloino, G. Zheng, J. L. Sonnenberg, M. Hada, M. Ehara, K. Toyota, R. Fukuda, J. Hasegawa, M. Ishida, T. Nakajima, Y. Honda, O. Kitao, H. Nakai, T. Vreven, J. A. Montgomery, Jr., J. E. Peralta, F. Ogliaro, M. Bearpark, J. J. Heyd, E. Brothers, K. N. Kudin, V. N. Staroverov, R. Kobayashi, J. Normand, K. Raghavachari, A. Rendell, J. C. Burant, S. S. Iyengar, J. Tomasi, M. Cossi, N. Rega, J. M. Millam, M. Klene, J. E. Knox, J. B. Cross, V. Bakken, C. Adamo, J. Jaramillo, R. Gomperts, R. E. Stratmann, O. Yazyev, A. J. Austin, R. Cammi, C. Pomelli, J. W. Ochterski, R. L. Martin, K. Morokuma, V. G. Zakrzewski, G. A. Voth, P. Salvador, J. J. Dannenberg, S. Dapprich, A. D. Daniels, Ö. Farkas, J. B. Foresman, J. V. Ortiz, J. Cioslowski and D. J. Fox, Gaussian 09 (Revision B.01), Gaussian Inc., Wallingford, CT, 2010 Search PubMed.
- A. D. Becke, J. Chem. Phys., 1993, 98, 5648 CrossRef CAS.
- C. Lee, W. Yang and R. G. Parr, Phys. Rev. B: Condens. Matter Mater. Phys., 1988, 37, 785 CrossRef CAS.
- P. J. Hay and W. R. Wadt, J. Chem. Phys., 1985, 82, 270 CrossRef CAS.
-
J. W. Ochterski, Thermochemistry in Gaussian, Gaussian Inc., Wallingford, CT, 2000 Search PubMed.
-
C. Kittel, Introduction to Solid State Physics, Wiley, New Jersey, 2005 Search PubMed.
- C. G. Deacon, J. R. de Bruyn and J. P. Whitehead, Am. J. Phys., 1992, 60, 422 CrossRef.
- A. T. Petit and P. L. Dulong, Ann. Chim. Phys., 1819, 10, 395 Search PubMed.
-
S. W. Van Sciver, Helium Cryogenics, Springer, New York, 2012 Search PubMed.
-
C. J. Pethick and H. Smith, Bose–Einstein Condensation in Dilute Gases, Cambridge University Press, Cambridge, 2008 Search PubMed.
- S. W. Kieffer, Rev. Geophys. Space Phys., 1979, 17, 1 CrossRef CAS.
- P. C. Fine, Phys. Rev., 1939, 56, 355 CrossRef CAS.
- W. Mahmood, M. S. Anwar and W. Zia, Am. J. Phys., 2011, 79, 1099 CrossRef CAS.
-
J. Hones, in Carbon Nanotubes, ed. M. S. Dresselhaus, G. Dresselhaus and P. Avouris, Springer, Heidelberg, 2001, p. 273 Search PubMed.
- B. Bonello and B. Fernandez, J. Phys. Chem. Solids, 1993, 54, 209 CrossRef CAS.
Footnote |
| † Electronic supplementary information (ESI) available. See DOI: 10.1039/c6cp07173b |
|
| This journal is © the Owner Societies 2017 |
Click here to see how this site uses Cookies. View our privacy policy here.  *
*


![[thin space (1/6-em)]](https://www.rsc.org/images/entities/char_2009.gif) sin
sin![[thin space (1/6-em)]](https://www.rsc.org/images/entities/char_2009.gif) θ
θ![[thin space (1/6-em)]](https://www.rsc.org/images/entities/char_2009.gif) cos
cos![[thin space (1/6-em)]](https://www.rsc.org/images/entities/char_2009.gif) φ, n
φ, n![[thin space (1/6-em)]](https://www.rsc.org/images/entities/char_2009.gif) sin
sin![[thin space (1/6-em)]](https://www.rsc.org/images/entities/char_2009.gif) θ
θ![[thin space (1/6-em)]](https://www.rsc.org/images/entities/char_2009.gif) sin
sin![[thin space (1/6-em)]](https://www.rsc.org/images/entities/char_2009.gif) φ, n
φ, n![[thin space (1/6-em)]](https://www.rsc.org/images/entities/char_2009.gif) cos
cos![[thin space (1/6-em)]](https://www.rsc.org/images/entities/char_2009.gif) θ)
θ)


