Highly efficient polymer solar cells by step-by-step optimizing donor molecular packing and acceptor redistribution†
Received
29th September 2016
, Accepted 18th November 2016
First published on 21st November 2016
Abstract
The dynamic drying process of the active layer should play a vitally important role in determining the performance of polymer solar cells (PSCs). Donor molecular packing and acceptor redistribution can be optimized by two successive post-treatments on the active layer. The blend films were freshly prepared by spin-coating method and then immediately transferred to a covered glass Petri dish to allow self-assembly of the donor molecules. The films were then treated with methanol or PFN–methanol solution to adjust the acceptor redistribution. In this study, power conversion efficiencies (PCEs) of PSCs with PffBT4T-2OD:PC71BM as the active layer were improved from 6.74% to 8.75% by employing 80 min for self-assembly and 20 s of methanol soaking. The PCE was improved even further to 9.72% by inserting a PFN interfacial layer. The performance improvement was mainly attributed to the optimized PffBT4T-2OD molecular packing during the self-assembly process, ideal vertical phase separation driven by methanol soaking and efficient charge collection by insertion of a PFN interfacial layer. The molecular packing and vertical phase separation were characterized by grazing incidence X-ray diffraction (GIXD), transmission electron microscopy (TEM) and X-ray photoelectron spectroscopy (XPS), respectively. The experimental results solidly supported the effectiveness of the step-by-step optimization strategy.
1. Introduction
Exploiting renewable clean energy has become an urgent task to solve the energy crisis and environmental problems for sustainable development. Polymer solar cells (PSCs) have attracted increasing attention because they are low-cost, environmentally friendly, and may be constructed from a diversity of materials.1–3 The power conversion efficiency (PCE) of PSCs has already exceeded 11% through the synergistic optimization of material synthesis and device engineering.4–9 Some effective strategies have been developed to improve the performance of PSCs, such as adjusting phase separation, adopting an interfacial layer and redesigning the device structure.10–16 Phase separation strongly depends on the dynamic drying process of the active layer, which is closely related to the used solvent, solvent additive, storage environments and post treatment conditions.17–20 It is known that the volatilization speed of the solvent and solvent additive can influence molecular packing and crystallinity in blend films.21–24 During a slow drying process, polymer molecules have enough time to undergo a self-assembly process in the wet blend film, leading to different molecular packing (face-on or edge-on) and crystallinity.25–30 It is known that face-on molecular packing is beneficial to charge transport along the normal direction of the substrate.31 Moreover, fullerene derivatives preferentially aggregate during slow drying process of blend films due to their spheroidal structure and high solubility in solvent additive.32,33 Therefore, molecular packing and phase separation may be simultaneously adjusted during the slow self-assembly process. It is prerequisite to further regulate acceptor redistribution and form the ideal vertical phase separation.
In this study, more than three hundred PSCs were fabricated with poly[(5,6-difluoro-2,1,3-benzothiadiazol-4,7-diyl)-alt-(3,3′′′-di-(2-octyldodecyl)-2,2′;5′,2′′;5′′,2′′′-quaterthiophen-5,5′′′-diyl)] (PffBT4T-2OD):[6,6]-phenyl-C71-butyric acid methyl ester (PC71BM) as the active layer. The pristine blend films were rapidly placed in a covered glass Petri dish to undergo a self-assembly process, which could be rapidly terminated by spin-coating with methanol solvent or solution onto the blend films. The self-assembly time of the blend films (placed in the covered glass Petri dish) was regulated from 20 min to 120 min with a step increase of 20 min, to optimize the PffBT4T-2OD molecular packing. After the optimal self-assembly time, the blend films were subjected to methanol soaking to adjust PC71BM redistribution and obtain ideal vertical phase separation. After that, a poly[(9,9-bis(30-(N,N-dimethylamino)propyl)-2,7-fluorene)-alt-2,7-(9,9-dioctylfluorene)] (PFN) methanol solution was spin-coated onto the blend films to prepare the interfacial layer. The PCEs of the resulting solar cells were markedly improved from 6.74% to 8.66% for the active layers with 80 min of self-assembly time and containing the PFN interfacial layer. Further improvement to 8.75% was observed for active layers with 80 min self-assembly time and 20 s methanol soaking. Finally, PCEs of 9.72% were obtained by inserting the PFN interfacial layer.
2. Experimental
The materials PffBT4T-2OD (1-Material Inc.) and PC71BM (Luminescence Technology Corp.) were combined in a weight ratio of 1![[thin space (1/6-em)]](https://www.rsc.org/images/entities/char_2009.gif) :1.8 and dissolved in a solvent mixture of o-dichlorobenzene (DCB) and chlorobenzene (CB) in a volume ratio of 1:1, and with a total concentration of 28 mg ml−1. The blend solution was continuously stirred at 110 °C for 12 hours, and then the solvent additive 1,8-diiodooctane (DIO) was added in a volume ratio of 3%. The conjugated polyelectrolyte PFN was dissolved in methanol at a concentration of 0.2 mg ml−1 with an addition of 0.25 vol% acetic acid. The indium tin oxide (ITO) glass substrates with a sheet resistance of 15 Ω square−1 were sequentially pre-cleaned in ultrasonic baths containing detergent, deionized water and ethanol. The cleaned ITO substrates were baked at 100 °C for 10 min in ambient condition and then treated with oxygen plasma for 1 min to improve their work function and clearance. 80 μl PEDOT:PSS solution (H. C. Starck Co. Ltd) was spin-coated onto the ITO substrates at 5000 round per min (RPM) for 40 s, and the substrates were then annealed at 150 °C for 15 min. The PEDOT:PSS coated ITO substrates were transferred into a high-purity nitrogen-filled glove box. To obtain high-quality active layers, the PffBT4T-2OD:PC71BM blend solution and the PEDOT:PSS coated ITO substrates were continuously heated on a hot plate at 100 °C before spin-coating. The hot PffBT4T-2OD:PC71BM blend solution (60 μl) was spin-coated onto the substrate at 800 rpm. The pristine blend films were immediately placed in covered glass Petri dishes to undergo the self-assembly process. Methanol soaking or spin-coating PFN methanol solution (100 μl) onto the blend films was carried out to terminate the self-assembly process. The methanol soaking process was carried out as follows: methanol was dropped onto the blend films, and after a few minutes, the residual methanol was removed by spin-coating method. The methanol soaking time (2 s, 20 s, 40 s and 60 s) was defined as the interval from dropping of the methanol solution to starting of the spin-coating process. The cathode, which consisted of an aluminium (Al) layer of 100 nm thickness, was deposited by thermal evaporation under 10−4 Pa. The thickness was monitored by a quartz crystal microbalance. The glass substrate size was 20 × 20 × 1 mm. The active area of each device was about 3.8 mm2, which was defined by the vertical overlap of ITO anode and Al cathode.
:1.8 and dissolved in a solvent mixture of o-dichlorobenzene (DCB) and chlorobenzene (CB) in a volume ratio of 1:1, and with a total concentration of 28 mg ml−1. The blend solution was continuously stirred at 110 °C for 12 hours, and then the solvent additive 1,8-diiodooctane (DIO) was added in a volume ratio of 3%. The conjugated polyelectrolyte PFN was dissolved in methanol at a concentration of 0.2 mg ml−1 with an addition of 0.25 vol% acetic acid. The indium tin oxide (ITO) glass substrates with a sheet resistance of 15 Ω square−1 were sequentially pre-cleaned in ultrasonic baths containing detergent, deionized water and ethanol. The cleaned ITO substrates were baked at 100 °C for 10 min in ambient condition and then treated with oxygen plasma for 1 min to improve their work function and clearance. 80 μl PEDOT:PSS solution (H. C. Starck Co. Ltd) was spin-coated onto the ITO substrates at 5000 round per min (RPM) for 40 s, and the substrates were then annealed at 150 °C for 15 min. The PEDOT:PSS coated ITO substrates were transferred into a high-purity nitrogen-filled glove box. To obtain high-quality active layers, the PffBT4T-2OD:PC71BM blend solution and the PEDOT:PSS coated ITO substrates were continuously heated on a hot plate at 100 °C before spin-coating. The hot PffBT4T-2OD:PC71BM blend solution (60 μl) was spin-coated onto the substrate at 800 rpm. The pristine blend films were immediately placed in covered glass Petri dishes to undergo the self-assembly process. Methanol soaking or spin-coating PFN methanol solution (100 μl) onto the blend films was carried out to terminate the self-assembly process. The methanol soaking process was carried out as follows: methanol was dropped onto the blend films, and after a few minutes, the residual methanol was removed by spin-coating method. The methanol soaking time (2 s, 20 s, 40 s and 60 s) was defined as the interval from dropping of the methanol solution to starting of the spin-coating process. The cathode, which consisted of an aluminium (Al) layer of 100 nm thickness, was deposited by thermal evaporation under 10−4 Pa. The thickness was monitored by a quartz crystal microbalance. The glass substrate size was 20 × 20 × 1 mm. The active area of each device was about 3.8 mm2, which was defined by the vertical overlap of ITO anode and Al cathode.
The current density–voltage (J–V) curves of the PSCs were measured under light illumination using a Keithley 4200 source meter under ambient conditions. AM 1.5 G illumination at 100 mW cm−2 was provided by an ABET Sun 2000 solar simulator. The external quantum efficiency (EQE) spectra of the PSCs were measured by a Zolix Solar Cell Scan 100. The thickness of the active layers was measured using an Ambios Technology XP-2 stylus Profiler. Absorption spectra of the films were measured by a Shimadzu UV-3101 PC spectrophotometer. The grazing incidence X-ray diffraction (GIXD) profiles were measured by a 5-circle Huber diffractometer at the Beijing Synchrotron Radiation Facility (BSRF). A bent triangle silicon crystal was used to select the X-ray wavelength of 1.54 Å. A grazing incidence angle of 0.2° was chosen to increase the GIXD peak intensity for investigating the molecular packing and crystallinity.
The surface morphology of the films was investigated by atomic force microscopy (AFM) using a multimode Nanoscope IIIa operated in tapping mode. The transmission electron microscope (TEM) images were obtained using a JEOL JEM-1400 transmission electron microscope operated at 80 kV. Prior to the TEM characterization, the blend films were stripped from the PEDOT:PSS substrates by soaking the sample in deionized water. The films were then transferred onto a holey carbon-coated copper grid. The water contact angle images (WCA) of the films were recorded using a KRÜSS DSA 100 instrument under ambient conditions. X-ray photoelectron spectroscopy (XPS) was carried out at BSRF to analyse the surface components of blend films. The schematic configuration of the PSCs and the chemical structures of the constituent materials are shown in Fig. S1 (ESI†). A schematic of the step-by-step optimization strategy for active layer and interfacial layer fabrication is depicted in Fig. 1.
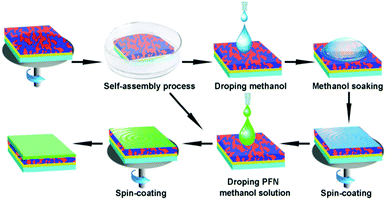 |
| | Fig. 1 Schematic of the step-by-step optimization strategy for active layer and interfacial layer fabrication. | |
3. Results and discussion
3.1 Optimizing PffBT4T-2OD molecular packing during the self-assembly process
The pristine blend films were rapidly placed in a covered glass Petri dish to undergo a self-assembly process. The self-assembly process can be rapidly terminated by spin-coating with a PFN methanol solution, because the residual solvent and solvent additive can be rapidly removed under the driving force of methanol volatilization. To confirm the effect of the self-assembly process on the performance of the PSCs, a reference PSC was fabricated with the active layer undergoing a natural drying process in high-purity nitrogen condition, without the PFN interfacial layer. The J–V curves of the reference PSC and the PSCs containing active layers formed with different self-assembly times were measured under AM 1.5 G illumination at an intensity of 100 mW cm−2. The results are shown in Fig. 2a. The key photovoltaic parameters of the PSCs are listed in Table 1. The champion PCE for the reference sample was 6.74%, along with an open circuit voltage (VOC) of 0.70 V, a short circuit current (JSC) of 16.44 mA cm−2 and a fill factor (FF) of 58.6%. The VOC of the PSCs increased up to approximately 0.74 V by inserting a PFN interfacial layer, owing to the strong PFN interfacial dipole.34 The FFs of PSCs with PFN interfacial layer were enhanced to greater than 65%. The markedly enhanced FF should be mainly attributed to improved charge transport and collection assisted by the PFN interfacial dipole. Cao et al. reported that the direction of the PFN dipole moment was aligned with the built-in field originating from the asymmetric electrodes; this resulted in an improved work function for the cathode and enhancement of the built-in field across the active layer.34 The loss of VOC resulting from the difference between the work function of the cathode and the lowest unoccupied molecular orbital (LUMO) energy level of PC71BM could be recovered; this is attributed to the improved work function of the cathode modified by PFN interfacial layer, which resulted in an overall increased VOC of PSCs.35,36 The increase in built-in field across the active layer was beneficial to charge transport and collection, resulting in an enhanced FF for the PSCs that contained a PFN interfacial layer. Among all the PSCs tested, the champion PCE value was 8.66%, obtained using the cell that contained an active layer formed by 80 min of self-assembly time; the corresponding VOC was 0.75 V, the JSC was 17.06 mA cm−2 and the FF was 67.7%. An intuitive description of variation in the key photovoltaic parameters PCE, JSC and FF with respect to self-assembly time is presented in Fig. S2 (ESI†). It is highlighted that the FF markedly increased from 58.6% to 65.8% and further to 67.7% for the PSCs constructed with active layers that underwent 20 min and 80 min of self-assembly. The increased FFs may well be explained by two factors: (i) optimized donor molecular packing during the self-assembly process, and (ii) improved charge transport and collection by PFN interfacial dipole. The EQE values were larger than 65% in the wavelength range of 350–700 nm, as shown in Fig. 2b. It is clear that the EQE spectra were gradually enhanced for active layers with self-assembly times of less than 100 min, which was in agreement with the variation trend of JSC dependence on self-assembly time.
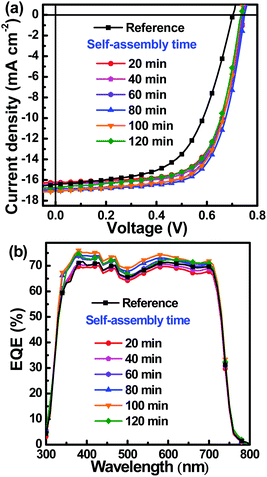 |
| | Fig. 2 (a) J–V curves of PSCs containing active layers formed with different self-assembly times under AM 1.5 G illumination at an intensity of 100 mW cm−2; (b) corresponding EQE spectra of PSCs. | |
Table 1 Key photovoltaic parameters of PSCs with active layer undergoing different self-assembly time
| Self-assembly time (min) |
J
SC (mA cm−2) |
V
OC (V) |
FF (%) |
PCE (%) |
| Best |
Ave. |
| The average values were calculated according to 20 cells. |
| Reference |
16.44 |
0.70 |
58.6 |
6.74 |
6.58 |
| 20 |
16.25 |
0.75 |
65.8 |
8.02 |
7.89 |
| 40 |
16.38 |
0.75 |
66.7 |
8.19 |
8.06 |
| 60 |
16.88 |
0.74 |
67.1 |
8.38 |
8.24 |
| 80 |
17.06 |
0.75 |
67.7 |
8.66 |
8.45 |
| 100 |
17.10 |
0.74 |
67.0 |
8.48 |
8.33 |
| 120 |
16.72 |
0.74 |
65.4 |
8.09 |
7.92 |
To clarify the underlying reason for the performance improvements of PSCs associated with self-assembly time, GIXD was performed on the blend films. To exclude the influence of the PFN interfacial layer, the self-assembly process was terminated by spin-coating with methanol solvent rather than the PFN methanol solution. The out-of-plane and in-plane GIXD profiles of the blend films with 20 min, 80 min and 120 min of self-assembly are shown in Fig. 3. Similar lamellar spacing (100) (q = 0.28 Å−1) and π–π stacking spacing (010) peaks (q = 1.80 Å−1) were observed for all the blend films along the out-of-plane (qz) direction, as shown in Fig. 3a. Similar lamellar spacing (100) peaks (q = 0.28 Å−1) for all the active layers were clearly observed along the in-plane (qxy) direction, as shown in Fig. 3b. It is known that the (100) peak along the out-of-plane direction and the (010) peak along the in-plane direction represent edge-on molecular packing, suggesting that PffBT4T-2OD molecular side-chains were perpendicular to the substrate and that the π–π stacking direction of the backbones was parallel to the substrate.37 In contrast, the (010) peak along the out-of-plane direction and the (100) peak along the in-plane direction corresponded to face-on molecular packing, which indicates that PffBT4T-2OD molecular side-chains would be parallel to the substrate and the π–π stacking direction of the backbones would be perpendicular to the substrate.38,39 The diffraction intensity of the (100) peak decreased in the out-of-plane (qz) direction with increased self-assembly time, and the diffraction intensity of the (010) peak simultaneously increased along the in-plane (qxy) direction. This phenomenon indicated that PffBT4T-2OD molecular packing can switch from edge-on to face-on during the self-assembly process. It is known that the face-on molecular packing is beneficial to hole transport along the normal direction of the substrate.31 To investigate hole mobility dependence on self-assembly time, hole-only devices were fabricated with the general structure of ITO/PEDOT:PSS (40 nm)/active layer (260 nm)/MoO3 (10 nm)/Ag (100 nm). The J–V curves of the hole-only devices were measured in the dark and are shown in Fig. S3 (ESI†). The hole mobility in the active layers with different self-assembly times was measured using the space charge limited current (SCLC) method. The hole mobility was 4.61 × 10⁻⁴, 6.08 × 10⁻⁴ and 7.15 × 10⁻⁴ cm2 V−1 s−1 for active layers undergoing 20 min, 80 min and 120 min self-assembly, respectively. The improved hole mobility may be attributed to the switch of PffBT4T-2OD molecular packing from edge-on to face-on during the self-assembly process. A broad diffraction peak at q = 1.4 Å−1 can also be observed from GIXD profiles, which corresponds to characteristic PC71BM aggregation.40 For the blend film with 120 min self-assembly, the relatively strong diffraction intensity at q = 1.4 Å−1 indicated that PC71BM molecular aggregation occurred preferentially during the longer self-assembly process. Therefore, PC71BM redistribution could be further optimized to form the ideal vertical phase separation for better charge transport and collection.
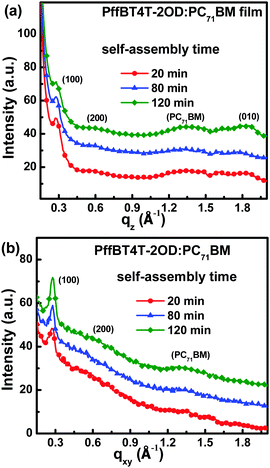 |
| | Fig. 3 The out-of-plane (a) and in-plane GIXD profiles (b) of blend films with 20 min, 80 min and 120 min self-assembly. | |
To investigate the effect of self-assembly time on phase separation, the surface morphology of the blend films with different self-assembly times was studied using AFM, as shown in Fig. S4 (ESI†) and Fig. 4a–d. According to the phase images, the reference blend films showed a relatively large degree of phase separation due to excessive aggregation of PC71BM during the natural drying process. The homogeneous image of the blend film produced after 80 min self-assembly indicated that the desired phase separation was achieved in this case. To further investigate phase separation dependence on self-assembly time, bulk morphology of the blend films was investigated by TEM, as shown in Fig. 4e–h. It is generally believed that bright and dark regions represent the donor-rich domains and acceptor-rich domains, respectively, due to their different electron densities.41 The reference blend films exhibited a cottony morphology, with no iconic features clearly observed from TEM images. Interestingly, some fibrous structures were observed for the blend films with different self-assembly times. For 80 min self-assembly time, the TEM image of the resulting blend film featured long, bright and tightly packed fibrous structures, indicating that efficient hole transport channels were formed. Moreover, some small and homogeneous dark dots were observed, indicating that more bi-continuous interpenetrating networks were formed for better exciton dissociation and charge transport in the active layers. The phase separation of the blend films that underwent 120 min self-assembly appears like that of the reference films because spin-coating methanol may have no effect on phase separation for these almost-dried films. Significant phase separation may reduce exciton dissociation efficiency. For the blend films that underwent 20 min self-assembly, PffBT4T-2OD molecular packing may have failed to achieve the optimal state. Moreover, PC71BM may have aggregated during the rapid volatilization, assisted by early spin coating with methanol, of larger amounts of the solvent and solvent additive from the wet blend films. To understand the effect of self-assembly time on molecular packing and phase separation better, the schematic of the active layer evolutionary process is shown in Fig. S5 (ESI†).
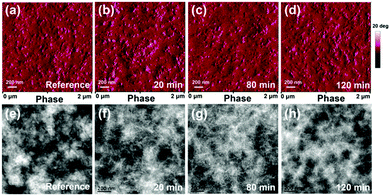 |
| | Fig. 4 AFM phase images (above) and TEM images (below) of reference blend films (a and e), blend films undergoing 20 min self-assembly (b and f), 80 min self-assembly (c and g) and 120 min self-assembly (d and h). | |
To further investigate the effect of self-assembly time on charge transport and collection in the active layer, J–V curves of all PSCs were measured under different light intensities, as shown in Fig. 5a and Fig. S6 (ESI†). The simulated solar illumination light intensity was adjusted from 3 mW cm−2 to 100 mW cm−2 by neutral density filters. The FF dependence on light intensity is shown in Fig. 5b. It is apparent that the FF of the reference PSC was lower than that of PSCs with active layers that underwent the self-assembly process and contained a PFN interfacial layer. This was mainly attributed to inefficient charge transport and collection.42 For the optimized PSCs with active layers undergoing 80 min self-assembly, the FFs of the resulting PSCs were slightly decreased with increasing light intensity, indicating the presence of efficient charge transport channels in the active layers.43 Experimental results indicated that PffBT4T-2OD molecules were oriented preferentially in the more ordered face-on molecular packing during the self-assembly process, which is beneficial for hole transport. The PffBT4T-2OD molecular packing was rapidly fixed by spin-coating with methanol to terminate the self-assembly process. After that, it was very important to adjust the PC71BM redistribution to form a bi-continuous interpenetrating network in the active layers.
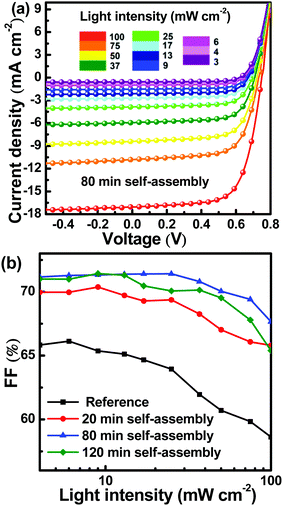 |
| | Fig. 5 (a) J–V curves of PSCs with active layers that underwent 80 min of self-assembly under different light intensities; (b) FF dependence on light intensity for all PSCs. | |
3.2 Adjusting PC71BM redistribution by methanol soaking of the active layer
In 2015, a two-step strategy was proposed involving methanol soaking of the active layer and then spin-coating with PFN methanol solution to clarify the underlying reason for performance improvements realized by the introduction of a PFN interfacial layer into PSCs.44 The volatilization of methanol provided the additional force needed for migration of PC71BM dissolved in additive DIO toward the top surface of the active layers, leading to more ideal vertical phase separation. To further optimize vertical phase separation of the active layer with 80 min of self-assembly, 100 μl methanol was dropped onto the active layer and then removed by spin-coating method after different retention times. The retention time of methanol on active layer is defined as the soaking time. To investigate the effect of methanol soaking on the cells' performance, a series of PSCs were fabricated with active layers that underwent 80 min self-assembly, but for which the methanol soaking time was varied (2 s, 20 s, 40 s and 60 s). The J–V curves of these PSCs were measured under AM 1.5 G illumination at intensity of 100 mW cm−2 and are shown in Fig. 6a. The key photovoltaic parameters are summarized in Table 2. All the key photovoltaic parameters of PSCs with methanol soaking were markedly improved compared with the reference PSCs. The VOC was increased from 0.70 V to about 0.74 V by methanol treatment of the active layer, perhaps due to interfacial dipole induced by methanol.45 It can be adequately confirmed that methanol treatment on the active layers can take positive effect on PSCs performance improvement. It is apparent that the PCEs of PSCs slightly increased and then decreased with increased methanol soaking time. The champion PCE was 8.75% for active layers with 20 s methanol soaking. The corresponding FF value was 68.2%, due to optimized vertical phase separation by methanol soaking. At 60 s of methanol soaking, the FF value decreased to 65.8%, perhaps due to a greater proportion of PC71BM elevated toward the top surface of active layers, resulting in disrupted electron transport. Another interesting phenomenon that should be highlighted is that the JSC values of PSCs were also increased by methanol soaking, which may be attributed to enhanced photon harvesting of the active layers. The absorption spectra were measured for pristine PffBT4T-2OD:PC71BM blend films and the blend films after 80 min self-assembly with different methanol soaking times (Fig. 6b). It was evident that the absorption intensity of the blend films in the short wavelength range was enhanced by longer methanol soaking times, suggesting that aggregation of PC71BM molecules may occur during the methanol soaking process. A similar phenomenon has already reported by other groups.46,47 To further confirm the effect of methanol treatment on photon harvesting in the active layers, absorption spectra of the blend films with different self-assembly times (with or without methanol spin-coating) were measured and are shown in Fig. S7 (ESI†). It was apparent that the absorption intensity of the blend films was markedly increased by spin-coating methanol in the short wavelength range, which corresponded to the absorption range of PC71BM. Therefore, the enhanced absorption intensity was attributed to PC71BM aggregation during the methanol soaking process.
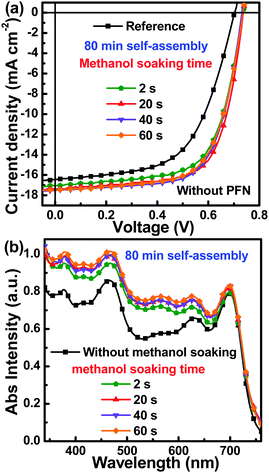 |
| | Fig. 6 (a) J–V curves of PSCs under AM 1.5 G illumination at intensity of 100 mW cm−2; (b) absorption spectra of blend films with different methanol soaking time. | |
Table 2 Key photovoltaic parameters of the reference PSCs and PSCs with active layers formed with 80 min self-assembly and different methanol soaking times
| Methanol soaking time (s) |
J
SC (mA cm−2) |
V
OC (V) |
FF (%) |
PCE (%) |
| Best |
Ave. |
| The average values were calculated according to 20 cells. |
| Reference |
16.44 |
0.70 |
58.6 |
6.74 |
6.58 |
| 2 |
17.01 |
0.74 |
65.5 |
8.24 |
8.17 |
| 20 |
17.35 |
0.74 |
68.2 |
8.75 |
8.62 |
| 40 |
17.49 |
0.73 |
67.5 |
8.62 |
8.59 |
| 60 |
17.45 |
0.73 |
65.8 |
8.38 |
8.26 |
To confirm the impact of methanol soaking on PC71BM redistribution, WCA images of neat PffBT4T-2OD film, neat PC71BM film and blend films with 2 s and 20 s methanol soaking are shown in Fig. S8 (ESI†). The WCA values were 109.0°, 89.9°, 106.7° and 105.7°, respectively. Compared with the blend film with 2 s methanol soaking, the WCA value of the blend film with 20 s methanol soaking was closer to that of the neat PC71BM film, which indicated that more PC71BM was elevated onto the top surface of the blend films during the methanol soaking process. To further confirm the effect of methanol soaking on PC71BM redistribution, the top surface compositions of the blend films were characterized by XPS, as shown in Fig. 7. The distribution of PC71BM (C82H14O2) and PffBT4T-2OD (C62H88F2N2S5) on the top surface was estimated according to the atomic ratio of carbon to sulfur (C/S) because S was the characteristic element of PffBT4T-2OD. Based on the XPS survey scans, the C/S atomic ratios were calculated according to the peak areas of the corresponding element (C 1s and S 2p) peaks at about 285 eV and 164 eV and their sensitivity factors. The C/S atomic ratios were 42.10, 43.85 and 46.72 for blend films with 2 s, 20 s and 60 s of methanol soaking, respectively. Therefore, the weight ratios of PC71BM to PffBT4T-2OD on the top surface of blend films can also be calculated according to the C/S atomic ratios. The detailed calculation is described in ESI.† The calculated weight ratios of PC71BM to PffBT4T-2OD on the top surface of blend films were 1.72, 1.82 and 1.99 for the blend films with 2 s, 20 s and 60 s methanol soaking, which were very close to the real doping weight ratio of 1.8. The weight ratios were improved with increased methanol soaking time, suggesting that some PC71BM molecules were elevated onto the top surface of the blend films. Methanol has a low boiling point of 65 °C and a good mutual solubility with DIO. It should be pointed out that DIO can selectively dissolve PC71BM. During the methanol soaking process, the volatilization of methanol provided the additional force required for migration of PC71BM dissolved in DIO toward the top surface of blend films. For the blend films with 60 s methanol soaking, more PC71BM molecules were elevated onto the top surface of the blend films, resulting in disrupted electron transport channels. Therefore, methanol soaking was an effective strategy for optimization of PC71BM distribution to obtain the appropriate vertical phase separation.
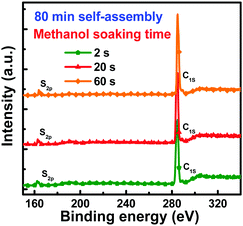 |
| | Fig. 7 The XPS survey scans of blend films after 80 min self-assembly and 2 s, 20 s and 60 s methanol soaking. | |
3.3 Synergistic optimization of the active layer and interfacial layer
To further confirm the effect of self-assembly and methanol soaking process on the performance improvement of PSCs, methanol soaking time was fixed as 20 s, whereas the self-assembly time was adjusted from 20 min to 120 min. For all the PSCs, an ultrathin PFN interfacial layer was prepared to improve charge collection. The J–V curves of all the PSCs were measured under AM 1.5 G illumination at intensity of 100 mW cm−2 and are shown in Fig. 8a. The key photovoltaic parameters are listed in Table 3. The JSC, FF and PCE values exhibited slight increases with self-assembly time, with subsequent decreases, as shown in Fig. S9 (ESI†). An optimized PCE of 9.72% was obtained for PSCs with active layers that underwent 80 min of self-assembly followed by 20 s of methanol soaking, which was in good agreement with the abovementioned experimental results. For more solid experimental evidence, the J–V curves of twenty PSCs prepared in different batches were measured and are shown in Fig. S10 (ESI†). The key photovoltaic parameters of these PSCs are summarized in Table S1 (ESI†); the statistical histograms of the key photovoltaic parameters of the twenty PSCs are shown in Fig. S11 (ESI†). The statistical average values of PCE, JSC, VOC and FF based on the twenty cells were 9.63%, 18.37 mA cm−2, 0.75 V and 70.1%, respectively. Good reproducibility indicated the solid experimental results in this study. To intuitively describe the effect of self-assembly, methanol soaking as well as PFN interfacial layer on PCE of PSCs, the PCEs dependence on active layer formation conditions and interfacial layer is shown in Fig. 8b. The reference PSCs exhibited a relatively low PCE of 6.74%. The champion PCE was 8.66% for active layers that underwent 80 min self-assembly prior to direct spin-coating with PFN methanol solution. For the PSCs with active layers that underwent 80 min self-assembly, followed by 20 s methanol soaking, the champion PCE was 8.75%. The champion PCE was further improved to 9.72% for the active layers that combined 80 min self-assembly and 20 s methanol soaking with PFN interfacial layer. Three groups of independent experimental results indicated that the step-by-step optimization strategy should be an efficient method to adjust donor molecular packing during self-assembly process and optimize acceptor redistribution by methanol soaking, leading to the formation of desirable bi-continuous and interpenetrated networks. Moreover, the PFN interfacial layer should play a positive effect on charge collection. The key processes of the step-by-step optimization strategy can be summarized as follows: (i) optimization of PffBT4T-2OD molecular packing to improve hole transport via the self-assembly process; (ii) adjustment of PC71BM redistribution to improve electron transport via the methanol soaking process; and (iii) formation of interfacial dipole by inserting PFN interfacial layer to enhance charge collection. The step-by-step optimization strategy can be considered a universal method for solution-processed solar cells.
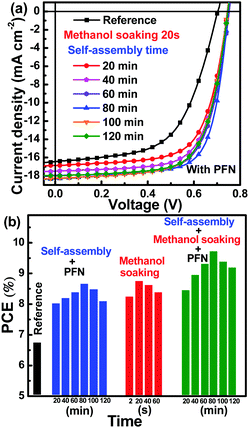 |
| | Fig. 8 (a) J–V curves of PSCs; (b) PCEs of PSC dependence on active layers with different self-assembly time, methanol soaking time and with/without PFN interfacial layer. | |
Table 3 Key photovoltaic parameters of PSCs for the active layers with different self-assembly time, 20 s methanol soaking and PFN interfacial layer
| Self-assembly time (min) |
J
SC (mA cm−2) |
V
OC (V) |
FF (%) |
PCE (%) |
| Best |
Ave. |
| The average values were calculated according to 20 cells. |
| 20 |
16.85 |
0.75 |
66.9 |
8.45 |
8.28 |
| 40 |
17.42 |
0.75 |
68.5 |
8.95 |
8.76 |
| 60 |
17.89 |
0.75 |
69.4 |
9.31 |
9.22 |
| 80 |
18.34 |
0.75 |
70.7 |
9.72 |
9.63 |
| 100 |
18.23 |
0.75 |
68.6 |
9.38 |
9.28 |
| 120 |
17.91 |
0.75 |
68.4 |
9.19 |
9.09 |
4. Conclusion
More than three hundred PSCs were fabricated with PffBT4T-2OD:PC71BM as the active layer; the PCEs were markedly improved from 6.74% to 9.72% by adjusting the active layer self-assembly time and methanol soaking time and by inserting a PFN interfacial layer. According to the donor and acceptor molecular properties, the step-by-step optimization strategy was firstly proposed to adjust donor molecular packing during the self-assembly process and acceptor redistribution during the methanol soaking process. A more appropriate vertical phase separation was obtained by synergistically optimizing self-assembly time and methanol soaking time, leading to efficient exciton dissociation and charge transport in the active layers. Moreover, charge collection of PSCs was improved by inserting PFN interfacial layers. PCE improvement of 44.2% was obtained by fine tuning the molecular packing, adjusting vertical phase separation and inserting interfacial layer. The step-by-step optimization strategy was an efficient and universal method to improve the performance of solution processed PSCs.
Acknowledgements
The authors thank the financial supporting from the Fundamental Research Funds for the Central Universities (2016YJS157); National Natural Science Foundation of China (61377029, 61675017); Fujun also thanks the one hundred talent project of Beijing Jiaotong University. The authors gratefully acknowledge the assistance of the beamline scientists at Diffuse X-ray Scattering Station (1W1A) and Photoelectron Spectroscopy Station (4B9B), BSRF during the experiments.
References
- P. Cheng and X. Zhan, Mater. Horiz., 2015, 2, 462–485 RSC.
- L. Huo, T. Liu, X. Sun, Y. Cai, A. J. Heeger and Y. Sun, Adv. Mater., 2015, 27, 2938–2944 CrossRef CAS PubMed.
- Q. Sun, F. Zhang, Q. An, L. Li, J. Wang, M. Zhang, W. Wang, F. Teng and J. Zhang, Org. Electron., 2015, 24, 30–36 CrossRef CAS.
- V. Vohra, K. Kawashima, T. Kakara, T. Koganezawa, I. Osaka, K. Takimiya and H. Murata, Nat. Photonics, 2015, 9, 403–408 CrossRef CAS.
- J. D. Chen, C. Cui, Y. Q. Li, L. Zhou, Q. D. Ou, C. Li, Y. Li and J. X. Tang, Adv. Mater., 2015, 27, 1035–1041 CrossRef CAS PubMed.
- J. Zhao, Y. Li, G. Yang, K. Jiang, H. Lin, H. Ade, W. Ma and H. Yan, Nat. Energy, 2016, 1, 15027 CrossRef.
- W. Zhao, D. Qian, S. Zhang, S. Li, O. Inganäs, F. Gao and J. Hou, Adv. Mater., 2016, 28, 4734–4739 CrossRef CAS PubMed.
- L. Nian, K. Gao, F. Liu, Y. Kan, X. Jiang, L. Liu, Z. Xie, X. Peng, T. P. Russell and Y. Ma, Adv. Mater., 2016, 28, 8184–8190 CrossRef CAS PubMed.
- S. Li, L. Ye, W. Zhao, S. Zhang, S. Mukherjee, H. Ade and J. Hou, Adv. Mater., 2016, 28, 9423–9429 CrossRef CAS PubMed.
- M. He, M. Wang, C. Lin and Z. Lin, Nanoscale, 2014, 6, 3984–3994 RSC.
- B. Xiao, H. Wu and Y. Cao, Mater. Today, 2015, 18, 385–394 CrossRef CAS.
- Q. An, F. Zhang, J. Zhang, W. Tang, Z. Deng and B. Hu, Energy Environ. Sci., 2016, 9, 281–322 Search PubMed.
- Z. He, F. Liu, C. Wang, J. Chen, L. He, D. Nordlund, H. Wu, T. P. Russell and Y. Cao, Mater. Horiz., 2015, 2, 592–597 RSC.
- E. Buchacadomingo, A. J. Ferguson, F. C. Jamieson, T. Mccarthyward, S. Shoaee, J. R. Tumbleston, O. G. Reid, L. Yu, M. B. Madec and M. Pfannmöller, Mater. Horiz., 2014, 1, 270–279 RSC.
- M. Zhang, F. Zhang, Q. An, Q. Sun, W. Wang, J. Zhang and W. Tang, Nano Energy, 2016, 22, 241–254 CrossRef CAS.
- Q. An, F. Zhang, Q. Sun, M. Zhang, J. Zhang, W. Tang, X. Yin and Z. Deng, Nano Energy, 2016, 26, 180–191 CrossRef CAS.
- C. Sprau, F. Buss, M. Wagner, D. Landerer, M. Koppitz, A. Schulz, D. Bahro, W. Schabel, P. Scharfer and A. Colsmann, Energy Environ. Sci., 2015, 8, 2744–2752 CAS.
- Q. Wan, X. Guo, Z. Wang, W. Li, B. Guo, W. Ma, M. Zhang and Y. Li, Adv. Funct. Mater., 2016, 26, 6635–6640 CrossRef CAS.
- L. F. Chen, Z. H. Huang, H. W. Liang, W. T. Yao, Z. Y. Yu and S. H. Yu, Energy Environ. Sci., 2013, 6, 3331–3338 CAS.
- W. Zhou, Y. Xie, X. Hu, L. Zhang, X. Meng, Y. Zhang, W. Ma and Y. Chen, Phys. Chem. Chem. Phys., 2016, 18, 735–742 RSC.
- B. Schmidt-Hansberg, M. Sanyal, M. F. Klein, M. Pfaff, N. Schnabel, S. Jaiser, A. Vorobiev, E. Müller, A. Colsmann and P. Scharfer, ACS Nano, 2011, 5, 8579-–8590 CrossRef PubMed.
- H. Yang, T. J. Shin, L. Yang, K. Cho, C. Y. Ryu and Z. Bao, Adv. Funct. Mater., 2005, 15, 671–676 CrossRef CAS.
- Z. Bao, A. Dodabalapur and A. J. Lovinger, Appl. Phys. Lett., 1996, 69, 4108–4110 CrossRef CAS.
- W. Wang, F. Zhang, L. Li, M. Gao and B. Hu, ACS Appl. Mater. Interfaces, 2015, 7, 22660–22668 CAS.
- M. Campoy-Quiles, T. Ferenczi, T. Agostinelli, P. G. Etchegoin, Y. Kim, T. D. Anthopoulos, P. N. Stavrinou, D. D. Bradley and J. Nelson, Nat. Mater., 2008, 7, 158–164 CrossRef CAS PubMed.
- G. Li, Y. Yao, H. Yang, V. Shrotriya, G. Yang and Y. Yang, Adv. Funct. Mater., 2007, 17, 1636–1644 CrossRef CAS.
- W. Yin and M. Dadmun, ACS Nano, 2011, 5, 4756–4768 CrossRef CAS PubMed.
- E. Verploegen, C. E. Miller, K. Schmidt, Z. Bao and M. F. Toney, Chem. Mater., 2012, 24, 3923–3931 CrossRef CAS.
- W. Ma, G. Yang, K. Jiang, J. H. Carpenter, Y. Wu, X. Meng, T. McAfee, J. Zhao, C. Zhu and C. Wang, Adv. Energy Mater., 2015, 5, 1501400 CrossRef.
- Y. Liu, J. Zhao, Z. Li, C. Mu, W. Ma, H. Hu, K. Jiang, H. Lin, H. Ade and H. Yan, Nat. Commun., 2014, 5, 5293 CrossRef CAS PubMed.
- J. R. Tumbleston, B. A. Collins and L. Yang, Nat. Photonics, 2014, 8, 385–391 CrossRef CAS.
- J. A. Love, C. M. Proctor, J. Liu, C. J. Takacs, A. Sharenko, T. S. van der Poll, A. J. Heeger, G. C. Bazan and T. Q. Nguyen, Adv. Funct. Mater., 2013, 23, 5019–5026 CrossRef CAS.
- W. Kim, J. K. Kim, E. Kim, T. K. Ahn, D. H. Wang and J. H. Park, J. Phys. Chem. C, 2015, 119, 5954–5961 CAS.
- Z. He, C. Zhong, X. Huang, W. Y. Wong, H. Wu, L. Chen, S. Su and Y. Cao, Adv. Mater., 2011, 23, 4636–4643 CrossRef CAS PubMed.
- L. Zhang, C. He, J. Chen, P. Yuan, L. Huang, C. Zhang, W. Cai, Z. Liu and Y. Cao, Macromolecules, 2010, 43, 9771–9778 CrossRef CAS.
- Z. He, H. Wu and Y. Cao, Adv. Mater., 2014, 26, 1006–1024 CrossRef CAS PubMed.
- K. Zhou, R. Zhang, J. Liu, M. Li, X. Yu, R. Xing and Y. Han, ACS Appl. Mater. Interfaces, 2015, 7, 25352–25361 CAS.
- T. Liu, L. Huo, X. Sun, B. Fan, Y. Cai, T. Kim, J. Y. Kim, H. Choi and Y. Sun, Adv. Energy Mater., 2015, 6, 1502109 CrossRef.
- J. Zhang, Y. Zhang, J. Fang, K. Lu, Z. Wang, W. Ma and Z. Wei, J. Am. Chem. Soc., 2015, 137, 8176–8183 CrossRef CAS PubMed.
- S. Liu, P. You, J. Li, J. Li, C. S. Lee, B. S. Ong, C. Surya and F. Yan, Energy Environ. Sci., 2015, 8, 1463–1470 CAS.
- Y. Zhang, D. Deng, K. Lu, J. Zhang, B. Xia, Y. Zhao, J. Fang and Z. Wei, Adv. Mater., 2015, 27, 1071–1076 CrossRef CAS PubMed.
- H. Wang, J. Huang, S. Xing and J. Yu, Org. Electron., 2016, 28, 11–19 CrossRef CAS.
- D. Zhao, M. Sexton, H. Y. Park, G. Baure, J. C. Nino and F. So, Adv. Energy Mater., 2015, 5, 1401855 CrossRef.
- Q. Sun, F. Zhang, J. Wang, Q. An, C. Zhao, L. Li, F. Teng and B. Hu, J. Mater. Chem. A, 2015, 3, 18432–18441 CAS.
- H. Zhou, Y. Zhang, J. Seifter, S. D. Collins, C. Luo, G. C. Bazan, T. Q. Nguyen and A. J. Heeger, Adv. Mater., 2013, 25, 1646–1652 CrossRef CAS PubMed.
- S. Nam, J. Jang, H. Cha, J. Hwang, T. K. An, S. Park and E. P. Chan, J. Mater. Chem., 2012, 22, 5543–5549 RSC.
- Y. Zheng, S. Li, D. Zheng and J. Yu, Org. Electron., 2014, 15, 2647–2653 CrossRef CAS.
Footnote |
| † Electronic supplementary information (ESI) available: The chemical structures of used materials; the schematic configuration of the PSCs; the FF, JSC and PCE of PSCs dependence on self-assembly time of active layer; the J–V curves dependence on light intensity; AFM height images. See DOI: 10.1039/c6cp06692e |
|
| This journal is © the Owner Societies 2017 |
Click here to see how this site uses Cookies. View our privacy policy here. 
 *a,
Qiaoshi
An
a,
Miao
Zhang
a,
Jian
Wang
a and
Jian
Zhang
*b
*a,
Qiaoshi
An
a,
Miao
Zhang
a,
Jian
Wang
a and
Jian
Zhang
*b


