
Effect of ferrous ion concentration on the kinetics of radiation-induced iron-oxide nanoparticle formation and growth
T. I.
Sutherland
,
C. J.
Sparks
,
J. M.
Joseph
,
Z.
Wang
,
G.
Whitaker
,
T. K.
Sham
and
J. C.
Wren
 *
*
Department of Chemistry, the University of Western Ontario, London, Ontario N6A 5B7, Canada. E-mail: jcwren@uwo.ca; Fax: +1-519-661-3022; Tel: 1-519-661-2111 ext. 86339
First published on 21st November 2016
Abstract
Magnetite nanoparticles were formed by γ-radiolysis of solutions containing different initial concentrations of FeSO4 without any other chemical additives. The particles formed in a given [Fe2+]0 had a narrow size distribution and the average size increased with [Fe2+]0. Five hour irradiation at 0.8 Gy s−1 produced an average size ranging from 23 ± 2 nm to 300 ± 40 nm in 0.1 mM or 10 mM [Fe2+]0 solutions, respectively. To ascertain the size-determining mechanism, the kinetics of γ-radiation-induced particle formation and growth were investigated by simultaneously analyzing the [H2(g)] in the headspace, the [FeII] and [FeIII] dispersed in solution, UV-Vis absorbances at 304 nm and 380 nm, and the pH of the solution. The particles formed were characterized by TEM imaging and various spectroscopic analyses. For a given [Fe2+]0 the time-dependent behaviours of different analyses collectively show three distinct kinetic stages of iron oxidation. The [Fe2+]0 affects the oxidation kinetics of different stages and hence, the oxidation yields and the size of particles formed after irradiation. The main processes which cause the observed kinetics and yields in the three stages are proposed.
1. Introduction
Transition metal oxide nanoparticles find application in many areas including cancer treatment,1 environmental cleanup,2 catalysis,3 and gas sensors.4 Traditional methods used for the synthesis of these nanoparticles include hydrothermal synthesis,5 sol–gel technique,6 laser-induced pyrolysis,7 sonochemical method,8 and spray pyrolysis.9 For many of these methods the mechanisms of particle formation are poorly understood, and the final particle size and distribution are not well controlled.Radiolysis is a promising alternative technique for generating nanoparticles with a narrow size distribution due to differential control of the particle nucleation and growth processes.10–13 This can help mitigate the drawbacks of traditional solution phase methods which include large particle size distribution,14 agglomeration of the particles15 or the need for chemical additives to control the final size of the particles.16
Gamma-radiation decomposes water molecules to a number of species including some very powerful reducing (˙eaq−, ˙H) and oxidizing species (˙OH, H2O2):17,18
 | (1) |
The radiation-induced technique has frequently been used to synthesize metallic nanoparticles from dissolved metal cations. In these earlier studies the technique has been applied mainly to noble metals in which the metal ions are reduced to a zero-valence state by strong reductants, ˙eaq− and ˙H, produced by water radiolysis. Oxidizing radiolysis products, particularly ˙OH, are removed by adding scavengers to prevent the back oxidation of the zero-balance metal to cation, and further aggregation is prevented by adding chemical stabilisers or capping agents. Radiation-induced iron oxide nanoparticle formation has been also reported.19,20 In these studies, the nanoparticle synthesis has relied primarily on utilizing the reducing power of ˙eaq− and ˙H to reduce dissolved ferric ions to form mixed FeII/FeIII oxide (magnetite), and it was necessary to use ˙OH scavengers and organic stabilizers to control the size of the particles formed.
In contrast to this, Wren et al. have previously reported the γ-radiation-induced formation of nanometer-sized iron oxyhydroxide particles from dissolved Fe2+ (starting from FeSO4), Co3O4 nanoparticles from dissolved Co2+ (starting from CoSO4), and Cr2O3 nanoparticles from dissolved Cr6+ (starting from K2Cr2O7) without the need for scavengers or stabilizers.10–12 Depending on the equilibrium potential of the metal cation redox reaction, the initially dissolved metal cation is either more easily reduced by ˙eaq− and ˙H or more easily oxidized by ˙OH and H2O2 to a less soluble cation with a different oxidation state. Because the solubility of a transition metal cation can vary by a few orders of magnitude depending on its oxidation state, the radiolysis-induced conversion of a soluble to a less soluble metal cation can lead to fast generation of nucleate particles, promoting uniform particle growth.
Previously published work on radiolytic iron oxide nanoparticle formation suggested that the initial solution conditions could affect the net rate of radiolytic conversion of dissolved ferrous ion to iron-oxide nanoparticles, possibly leading to growth of oxide particles of a different type and size.10 The pH and ferrous ion concentration are expected to affect the rates of different elementary reaction steps differently. In the present work, we develop a clearer understanding of how these parameters affect the individual steps. The previously reported mechanism10 has been modified based on the new experimental observations on the role of the ferrous ion concentration. In addition, our new observations have improved our understanding of the radiolytically-induced coarsening and aggregation processes and allowed us to describe them in greater detail.
2. Experimental
All solutions were freshly prepared before each experiment with water purified using a NANOpure Diamond UV ultrapure water system, with a resistivity of 18.2 MΩ cm. High-purity ferrous sulfate was obtained from Sigma-Aldrich (purity ≥ 99%) and used without further purification. The water was deaerated by purging with ultra-high purity argon (impurity 0.001%) for more than one hour before solutions were prepared in an argon-filled glove box (O2 level < 0.1 vol%). The oxygen level in the glove box during solution preparation was measured by sampling the gas phase using an air-tight syringe with a Luer lock (Agilent Technologies) and injected into a gas chromatograph with an electron capture detector (GC-ECD). The detector was calibrated with an O2/argon mixture with a known O2 concentration (certified mixture from Praxair). The concentration of O2 in the glove box was then quantitatively determined based on the calibration curve. Solutions containing Fe2+ in the concentration range 0.1 mM to 10 mM were prepared with the pH adjusted to 6.0 using 1 M NaOH (added dropwise). The pH of these solutions was measured using a pH meter (Mettler Toledo) inside the glove box. The prepared solutions, 10 mL in volume, were then transferred into 20 mL Pyrex vials (Agilent Technologies) leaving 10 mL headspace, and the vials were sealed using PTFE silicon septa. The vials were irradiated in a 60Co gamma cell (MDS Nordion), as discussed in detail elsewhere.21–23 The gamma source provided a uniform dose rate of 0.8 Gy s−1 in the water samples at the time of this study.Following irradiation, the headspace gases were extracted using an air-tight syringe with a Luer lock and analyzed for oxygen and hydrogen by gas chromatography using either an ECD or a Thermal Conductivity Detector (TCD) (Agilent Technologies 6580). The solutions were analyzed using two different methods, UV-Vis absorbance spectroscopic analysis and ferrozine colorimetry analysis. The UV-Vis absorption spectrum of an irradiated solution showed two broad overlapping bands with peak intensities at 304 nm and 380 nm. The deconvolution of the spectrum to the two absorption bands is described in Section 3.1. All of the spectrophotometric measurements were carried out using a diode array detector (BioLogic Science Instruments).
The ferrous and ferric concentrations in the solution were determined using the ferrozine method.24,25 In this method ferrozine was added to an aliquot of the test solution. The ferrozine reacts with FeII (ferrous ions either as dissolved, adsorbed or solid species) to form a purple complex that absorbs light at 563 nm with a molar extinction coefficient of 27![[thin space (1/6-em)]](https://www.rsc.org/images/entities/char_2009.gif) 900 M−1 cm−1.25 To a second aliquot of test solution, 0.5 mL of 1.4 M hydroxylamine hydrochloride was added. This additive reduced all FeIII (ferric ions either as dissolved, adsorbed or solid species) present to FeII. Ferrozine (0.2 mL of 0.01 M) was then added to this solution to determine the FeII concentration which now corresponds to the total iron concentration of the solution. The [FeIII] was determined from the difference in [FeII] measured before and after the reduction of FeIII to FeII. A calibration curve for [FeII] was obtained by adding ferrozine to solutions prepared with FeSO4 concentrations ranging from 0.05 mM to 0.005 M.
900 M−1 cm−1.25 To a second aliquot of test solution, 0.5 mL of 1.4 M hydroxylamine hydrochloride was added. This additive reduced all FeIII (ferric ions either as dissolved, adsorbed or solid species) present to FeII. Ferrozine (0.2 mL of 0.01 M) was then added to this solution to determine the FeII concentration which now corresponds to the total iron concentration of the solution. The [FeIII] was determined from the difference in [FeII] measured before and after the reduction of FeIII to FeII. A calibration curve for [FeII] was obtained by adding ferrozine to solutions prepared with FeSO4 concentrations ranging from 0.05 mM to 0.005 M.
The ability of the ferrozine method to detect FeII in solid hydroxide or oxide particles was tested by applying the method to standard magnetite particles (Fe3O4) purchased from Alfa Aesar. Fig. 1 compares the photographs of the four different solutions, containing (1) only magnetite particles without ferrozine reagent, (2) only ferrozine reagent without magnetite particles, (3) both magnetite particles and ferrozine reagent, and (4) the reducing agent, hydroxylamine, in addition to magnetite particles and ferrozine reagent. This test confirms that the ferrozine method can detect FeII adsorbed or incorporated in the solid particles. The possibility that the water radiolysis product H2O2 could affect the ferrozine analysis was also investigated. Hydrogen peroxide can oxidize ferrous species to ferric species, but this should not affect the determination of the total iron content (i.e., the sum of [FeII] and [FeIII] determined using the ferrozine method). We tested this by adding H2O2 to a ferrous solution. The total iron content was found to be the same as the initial FeII content.
 | ||
| Fig. 1 Photograph of (a) magnetite particles dispersed in pure water, (b) ferrozine reagent, (c) ferrozine reagent with magnetite particles without reducing agent and (d) ferrozine reagent with magnetite particles with reducing agent. | ||
The evolution of particle morphology was investigated by transmission electron microscopy (TEM). For the TEM imaging, the particles were collected by dipping a carbon-coated copper grid into the irradiated test solution and drying the sample grid in air. The TEM images were obtained with an electron microscope operated at 80 keV (Philips Electronics).
The chemical compositions of the oxide particles were analyzed by Fourier Transform Infrared (FTIR), Raman and X-ray Absorption Near Edge Structure (XANES) spectroscopy. For the spectroscopic analyses the solution was centrifuged, and the collected particles were placed onto a glass slide, and allowed to air dry. For FTIR spectroscopy the dried particles were incorporated into a KBr pellet and the spectra of the particles were measured using a Bruker model Vertex 70v with Fourier transformation (Bruker) in the 4000 to 400 cm−1 frequency range. Raman spectroscopy was performed using a Renishaw model 2000 Raman spectrometer with a laser excitation wavelength of 633 nm. The XANES spectroscopy was performed using the Soft X-Ray Microcharacterization Beam (SXRMB) at the Canadian Light Source (CLS). The resulting fluorescent X-ray emission spectra were collected for bulk sample analysis, while the ejected electron spectra were collected for surface composition analysis. The light source was set in the range of 7100–7180 eV which corresponds to the range over which the characteristic Fe K-edge absorption occurs.
3. Results
3.1. Analysis of the UV-Vis absorption spectrum
Fig. 2 shows the UV-Vis spectra obtained as a function of irradiation time for 0.5 mM [Fe2+]0. These spectra appear to contain at least two overlapping bands in the 300 to 700 nm range. An unirradiated ferric nitrate solution has one broad absorption band with a peak at 304 nm. The measured UV-Vis spectra were deconvoluted by subtracting a band for Fe(NO3)3 from the measured spectra. In this process the peak in the ferric nitrate solution spectrum was scaled to match the peak intensity in the measured spectrum at 304 nm. The result is the series of ‘ferric nitrate’ and ‘ferric-nitrate subtracted’ bands shown in Fig. 2b. The time dependences of the peak absorbances at 304 nm and 380 nm of the deconvoluted bands are shown in Fig. 2c. Both absorbances increase with time while their ratio remains nearly constant. The rates of increase in both absorbances slow down with time, eventually approaching zero when the absorbances reach near steady state values after ∼100 min. These observations indicate that the two absorption bands correspond to two electronic transitions of the same species. | ||
| Fig. 2 (a) UV-Vis absorption spectra of solutions containing 0.5 mM [Fe2+]0 irradiated for different durations, and the spectrum of ferric nitrate solution, (b) the corresponding deconvoluted spectra of ‘ferric nitrate’ and ‘ferric-nitrate subtracted’, and (c) the absorbances at 304 and 380 nm as a function of irradiation time. | ||
Ferric nitrate dissolves and dissociates in aqueous solution and the ferric ion is quickly hydrolyzed.26,27
| Fe3+ + 3H2O ⇆ Fe(OH)n3−n + nH+ + (3 − n)H2O where n = 1, 2, 3, 4 | (2) |
3.2. Kinetics of iron-oxide particle formation and growth
The kinetics of iron-oxide nanoparticle formation and growth under γ-radiation were followed by TEM imaging of the particles and by performing four different sets of solution and gas analyses as a function of time. The solution and gas analyses include [FeII] and [FeIII] in solution by the ferrozine method, UV-Vis absorbances of solutions at 304 nm and 380 nm (A304 and A380), H2 concentration in the headspace ([H2(g)]), and solution pH. The effect of initial ferrous ion concentration ([Fe2+]0) on the kinetics was studied in the concentration range of 0.1 mM to 10 mM in deaerated water with its pH initially adjusted to 6.0. Some examples of the solution and gas analysis results are shown in Fig. 3. | ||
| Fig. 3 Kinetic behaviours observed during radiolytic conversion of dissolved ferrous ions to iron oxide/hydroxide nanoparticles for three different [Fe2+]0, 0.5 mM, 1 mM and 5 mM, at pH 6.0. Four different sets of kinetic data are shown from the top to bottom: [FeII] and [FeIII] determined by the ferrozine method, the UV-vis absorbances at 304 nm and 380 nm, [H2(g)] in the headspace and pH. The three kinetics stages are indicated by the bars at the top of each data set. The lines are drawn to guide the eyes. | ||
For a given [Fe2+]0 the results of solution and gas analyses over time collectively show three distinct kinetic stages. The durations of these stages are indicated on the tops of the kinetic plots. The characteristics of the kinetic stages are:
Stage 1 has a very short duration. Over this short stage the total concentration of the FeII species that is converted to the FeIII species (−Δ[FeII] or Δ[FeIII]) is ∼0.15 ± 0.05 mM, nearly independent of [Fe2+]0. The changes, −Δ[FeII] and Δ[FeIII], accompany increases in both A304 and A380, while [H2(g)] is negligible. The pH shows the most rapid change in this stage compared to later stages, decreasing to a value below 3.5 with a slightly lower value in lower [Fe2+]0 solutions. The transition between Stage 1 and Stage 2 coincides with a small increase in pH before it decreases again.
In Stage 2, the rate of conversion from FeII to FeIII (−Δ[FeII]/dt or Δ[FeIII]/dt) is nearly proportional to [Fe2+]0. The absorbances at 304 nm and 380 nm both increase logarithmically, but their ratio remains nearly constant with time for a given [Fe2+]0. The absorbance at 380 nm increases to a final steady-state value of ∼0.5 at the end of Stage 2 and this value is nearly independent of [Fe2+]0. In Stage 2, the rate of production of H2(g) (Δ[H2(g)]/dt) is now measurable. The pH fluctuates near 3.0 and 3.5 initially but decreases at later times in Stage 2. The duration of Stage 2 decreases with [Fe2+]0.
In Stage 3, the net conversion of FeII to FeIII is very slow and consequently [FeII] and [FeIII] are near steady state. The rate of conversion has a small dependence on [Fe2+]0; it is slightly higher at a higher [Fe2+]0. In Stage 3, A380 is constant with time while A304 increases. The A304 increases at faster rates in higher [Fe2+]0 solutions. The H2(g) production in Stage 3 is negligible when [Fe2+]0 is less than 5 mM. The pH does not change with time in Stage 3.
The TEM images of the particles formed in 0.5 mM [Fe2+]0 solutions as a function of irradiation time are presented in Fig. 4. Particle morphology changes depending on the kinetic stage. The TEM images of the particles formed in Stage 1 show two areas with different shades. The darker areas contain well-defined, denser particles of 20–30 nm in size. The lighter areas are made up of less dense particles which appear to have aggregated during collection on the TEM grids. Initially the well-defined, denser particles are nearly absent and only the light particles are present. The number of the denser particles increases with increasing irradiation time in Stage 1. In Stage 2, the lighter particles are nearly absent, indicating that the lighter particles are growing into denser particles. In Stage 3, the small denser particles appear to have undergone coarsening or radiation-induced aggregation (see Discussion) to form even larger dendritic particles 80–100 nm in size. Interestingly, the dendritic particles as well as the small denser particles formed at a given time have very narrow size distributions.
 | ||
| Fig. 4 TEM images of the particles formed by γ-irradiation of 0.5 mM [Fe2+]0 solutions at pH 6.0 as a function of irradiation time (indicated on the images). The bars above the images indicate the kinetic stages. | ||
The XANES, Raman and FTIR spectroscopic analyses of the particles formed after 5 h irradiation are described in more detail in Section 3.4. The spectroscopic analyses suggest that the particles are magnetite or mixed FeII/FeIII particles with the outer layers in varying degrees of hydrated or hydroxide forms.
The reaction mechanism that can explain the observed kinetic behaviour is described here briefly. The main process occurring in Stage 1 is attributed to solution-phase oxidation of soluble ferrous ions to less soluble ferric ions by radiolytically-produced ˙OH, followed by hydrolysis of ferric ions, which triggers co-precipitation of FeII and FeIII species as mixed hydroxide nucleate particles. In Stage 2 particle nucleation continues but the dominant process is the continued adsorption of FeII onto existing particles, followed by oxidation of the adsorbed FeII to FeIII on the particle surfaces. As it forms, FeIII(ad) is incorporated with FeII(ad) into the solid oxide phase, growing as mixed FeII/FeIII (spinel) oxide particles. In Stage 3, negligible net oxidation of ferrous to ferric species occurs, but radiation-induced aggregation or coarsening of the particles by continuous dissolution and precipitation is observed (see further discussion in Section 3.5).
3.3. Effect of [Fe2+]0 on reaction yields at 5 h irradiation at 0.8 Gy s−1
The TEM images of the particles formed after 5 h irradiation of solutions containing different [Fe2+]0 are presented in Fig. 5. They show that the average size of the dendritic particles increases with [Fe2+]0, but for a given [Fe2+]0 the particles have a narrow size distribution. The average and the standard deviation of the size of the particles determined from the TEM images are listed in Table 1. | ||
| Fig. 5 TEM images of the particles collected after 5 h irradiation at 3.0 kGy h−1 of deaerated solutions containing different [Fe2+]0. | ||
The yields after 5 h irradiation of FeIII and H2(g), and the average diameter of the particles (d5h) are presented as a function of [Fe2+]0 in log–log plots in Fig. 6. The slope of 1.0 in the log[FeIII]5hvs. log[Fe2+]0 plot means that the product yield is linearly proportional to the initial reactant concentration. The line representing the slope of 1.0 is also shown in Fig. 6a. In the [Fe2+]0 range below 1 mM, the data for [FeIII]5h closely follows the line of slope of 1.0, but shows progressively more deviation from the slope as [Fe2+]0 increases. This agrees with the kinetic data for [FeIII]5h presented in Fig. 3, which show that each kinetic stage, and particularly Stage 2, has a different oxidation rate and duration depending on [Fe2+]0. On the other hand, the data for [H2(g)]5h closely follow a linear slope of 1/2 in the [Fe2+]0 range <1 mM, indicating that one H2 molecule is produced for every oxidation of two FeII atoms to two FeIII atoms, maintaining the overall redox balance. The line representing a slope of 1/2 is also shown in Fig. 6b. The data for d5h closely follow a linear (log–log) relationship with a slope of 1/3 except for the lowest [Fe2+]0 case. A slope of 1/3 in the logd5hvs. log[Fe2+]0 plot is expected if the average volume of the particles (∝d5h3) increases linearly with [Fe2+]0. The observed dependences of the yields, [FeIII]5h, [H2(g)]5h and d5h, on [Fe2+]0 are consistent with the kinetic data.
 | ||
| Fig. 6 Product yields after 5 h irradiation of deaerated solutions containing different [Fe2+]0 at an initial pH of 6.0, (a) [FeIII], (b) [H2(g)] in the headspace and (c) the average size of particles. The lines representing slopes of 1.0, 1/2 and 1/3 are also shown in respective plots. | ||
3.4. Spectroscopic characterization of the particles
The iron-oxide particles formed after 5 h irradiation were examined by XANES, Raman and FTIR spectroscopy to obtain the chemical and phase composition of the particles. For XANES, both the Fe K-edge total electron yield (TEY) and the X-ray fluorescence yield (FLY) spectra were taken. The FLY XANES is more sensitive to the bulk composition while the TEY is more sensitive to the surface composition. The TEY and FLY spectra of the particles formed in solutions containing different [Fe2+]0 are shown in Fig. 7. Also shown in the figure are the reference spectra of standard magnetite (Fe3O4) particles. The reference XANES spectra of other iron-oxide particles have been reported31,32 and have been used to characterize the particles. | ||
| Fig. 7 XANES Fe K-edge spectra of the particles formed after 5 h irradiation of solutions containing different [Fe2+]0 at an initial pH of 6.0, (a) the full TEY, (b) the pre-edge TEY, (c) the FLY. The XANES spectra of a standard magnetite sample are also shown for comparison. | ||
The XANES spectra of the particles formed in different [Fe2+]0 solutions all show similar spectroscopic features, most closely resembling those of magnetite. Compared to the reference magnetite spectrum, the TEY spectra of the particles show broader features that could be attributed to poor crystallinity or aggregation of small crystal particles. The pre-edge peak in the TEY spectra of the particles also coincides with that of Fe3O4. The FLY spectra of the particles are similar to that of Fe3O4, consistent with the TEY results. The FLY spectra are also nearly identical to the TEY spectra, indicating that there is no significant difference between the surface and bulk phases of the particles or, if present, a different surface layer is very thin.
The FTIR and Raman spectra of the particles are presented in Fig. 8 along with the reference spectra taken with standard powder samples of different iron oxides. The FTIR and Raman spectra of the particles formed in different [Fe2+]0 solutions are nearly the same; the combination of the FTIR and Raman spectra indicates that the rotational–vibrational frequencies of the oxide particles are ∼300, 350, 420, 500, 600 and 700 cm−1. The large peaks at wavenumbers >1000 cm−1 in the FTIR are attributed to adsorbed sulfate.33 The spectral intensities of the vibrational modes at 500 and 700 cm−1 that are both IR and Raman active most closely resemble those of magnetite. The Raman peaks at wavenumbers smaller than 420 cm−1 are present as the main peaks in the reference spectra of α-FeOOH and γ-FeOOH. Green rust II, which is an FeII/FeIII mixed hydroxide with SO42− occupying some of the anionic positions within the hydroxide structure, also has a main Raman peak at 420 cm−1.34 Hence, we have tentatively assigned the Raman peaks at wavenumbers below 420 cm−1 to a vibrational mode associated with the FeIII–OH (or –OOH) bond, and the FTIR and Raman peaks at 700 cm−1 to a vibrational mode of Fe3O4. The Raman intensity at 420 cm−1 relative to that of 700 cm−1 increases slightly with [Fe2+]0.
 | ||
| Fig. 8 (a) Fourier transform infrared spectra and (b) Raman spectra of the particles formed after 5 h irradiation of deaerated solutions containing different [Fe2+]0 at an initial pH of 6. The reference spectra taken from standard powder samples are shown. | ||
Based on the XANES, FTIR, and Raman analyses the particles can be best characterized as mostly Fe3O4 (magnetite) in the core while their outer surfaces are in varying hydrated and hydrolyzed forms, i.e., mixed FeII/FeIII oxyhydroxide and hydroxide:
| Fe3O4 + 4H2O ⇆ Fe3(O)n(OH)8−2n + nH2O ⇆ FeIIFeIII2(OH)8 | (3) |
3.5. Radiolysis kinetics calculations
Gamma-radiation decomposes water molecules and forms primary radiolysis products homogeneously in a bulk solution phase (reaction (1)). The time from the collision of a γ-photon and a water molecule to the homogenous distribution of the primary radiolysis products is nearly instantaneous (on a chemical reaction time scale). Once homogeneously distributed in the solution, the primary radiolysis products can undergo aqueous chemical reactions. To determine the time dependence of the concentrations of the key oxidants and reductants that are important for oxide particle formation we have performed kinetic calculations of the radiolysis products under continuous irradiation conditions.For the calculations a γ-radiolysis kinetic model that solves the rate equations of strongly coupled processes was used. The processes that are considered in this model include (a) the primary radiolysis process that produces radiolysis product i and (b) the chemical reactions of i with itself and other chemical species, j, including other radiolysis products, and dissolved chemical or reactive surface species present in the corresponding water phase. For modeling the radiolysis product concentrations on the time scale of solute oxidation and oxide particle formation, modeling of the detailed kinetics of the primary radiolysis processes occurring within ∼100 ns is not necessary. Thus, the production rates of water decomposition products by primary radiolysis processes are simplified by assuming that a radiolysis product, i, is created at a rate proportional to its g-value (gi), DR, and the density of the medium, ρH2O.21–23
The primary radiolysis products rapidly undergo chemical reactions with each other, water and its acid and base ions, and solute species present. About 45 elementary reactions involving more than 10 chemical species are considered in the model for water species alone. The rate equation for the concentration of species, i, is set up in the model as follows:
 | (4) |
Results obtained using the γ-radiolysis model are presented in Fig. 9. In deaerated solutions free of iron species the concentrations of the water primary radiolysis products at very short times after the start of irradiation (<1 ms) increase linearly with time (i.e., the slope of the log–log plot is 1). These times are too short for solution reactions to occur at a substantial rate and the production of a primary radiolysis product at shorter times can be approximated by the radiation dose rate and the species g-value, e.g.
 | (5a) |
| [˙OH]t ≈ g˙OH·DR·ρH2O·t | (5b) |
 | ||
| Fig. 9 Calculated concentrations of radiolysis products as a function of irradiation time for deaerated solutions containing different [Fe2+]0 at an initial pH of 6.0. Only the key radiolysis products critical to the formation of the iron nanoparticles are illustrated here, though many others are present. | ||
The more chemically reactive a radiolysis product is, the faster its concentration reaches steady state. For example, the concentration of the hydroxyl radical, ˙OH, reaches steady state within about 10 ms in pure water, while the less reactive molecular species such as [H2O2] reach steady state at longer times. At times <1 s, the concentrations of the radiolysis products (except for ˙eaq−) are not affected by pH (results not shown) because their main removal reactions do not involve H+ or OH−. At longer times, secondary radiolysis products such as H2O2 start influencing the radiolysis kinetics. The steady-state concentrations reached at longer times (>100 s) depend on the production rates of the secondary products. More detailed discussion on the kinetics of continuous γ-radiolysis of water can be found elsewhere.18,21–23
In modelling the radiolysis of solutions initially containing Fe2+ two additional iron reactions were included in the model:
| Fe2+ + ˙OH → Fe3+ + OH− k6 = 2.3 × 10⁸ M−1 s−1 | (6) |
| Fe3+ + ˙eaq− → Fe2+ k7 = 6 × 10¹⁰ M−1 s−1 | (7) |
Because reaction (6) occurs faster with increasing [Fe2+]0, [˙OH] reaches a steady-state value faster, within 0.1 ms to 1 μs when [Fe2+]0 increases from 0.1 mM to 10 mM. On the other hand, reaction (7) cannot compete with the reaction of H+ for ˙eaq− especially at low pHs, and hence [Fe2+]0 has a negligible effect on [˙eaq−] at short times (<0.1 s). Under these conditions [˙OH]SS and [Fe3+]t can be approximated as:
 | (8) |
 | (9) |
| [Fe3+]t ≈ g˙OH·DR·ρ·t | (10) |
The model calculation analysis indicates that the radiolytic production of ˙OH controls the rate of production of Fe3+ in the solution phase over a short irradiation period and that this rate will be independent of [Fe2+]0.
4. Discussion
We have previously reported a mechanism for the radiolytically-driven formation of metal oxide nanoparticles,10 and this study has allowed us to further refine that mechanism. The formation and growth of metal-oxide particles from dissolved metal ions is a complex process that involves many elementary steps including (1) the production or supply of oxide-particle constituent atoms, metal cations and oxygen or hydroxide anions, (2) hydrolysis of metal cations, (3) particle nucleation, (4) diffusion to and adsorption of the particle constituent atoms on the surface of a growing particle and (5) oxide lattice formation.For iron-oxide/hydroxide particles, one of the main particle constituent atoms is FeIII (ferrous oxides/hydroxides cannot form stable nanoparticles under normal solution environments.) The production of FeIII can be accomplished by oxidizing soluble ferrous ions, with the oxidation being accomplished by an added chemical oxidant or by a radiolytically produced oxidant. Homogeneous solution oxidation of ferrous to ferric ions by a chemical oxidant at room temperature is rather slow and consequently the particle nucleation is difficult to control. Thus, many common routes for making iron-oxide nanoparticles start with ferric ions in solution, in which case particle formation is accomplished by changing the solvation properties of the solution (e.g., by changing pH or temperature) to promote the precipitation of ferric ions.26,39,40 For example, the most common method, referred to as “forced hydrolysis”, starts with dissolving ferric ions (typically as ferric nitrate) in an acidic solution, followed by changing pH and temperature of the solution to promote the hydrolysis of the ferric ions.26,41 The hydrolysis forms neutral ferric hydroxide which condenses as nucleate particles, Fe(OH)3, and the resulting metal hydroxide gel is then slowly aged or converted to form iron oxyhydroxide nanoparticles (Fig. 10).
| Dissolution of ferric ions: Fe(NO3)3 → Fe3+ + 3NO3− | (11) |
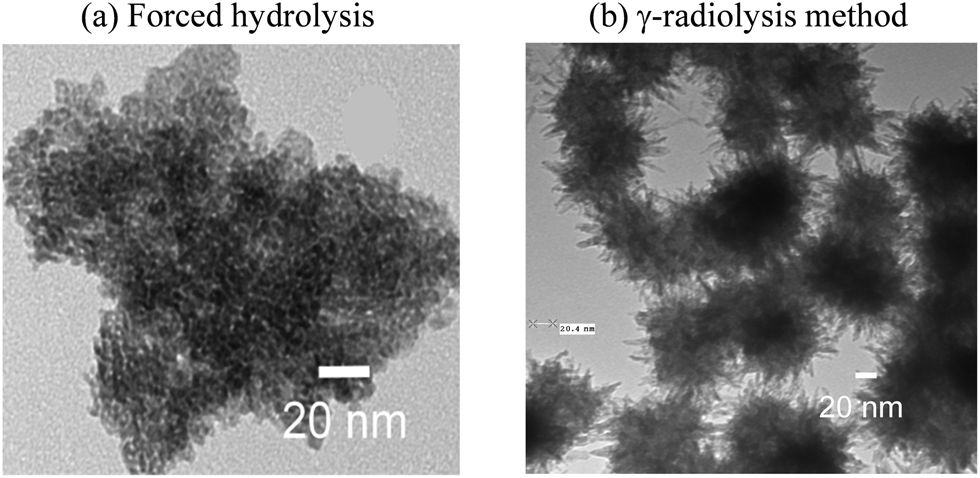 | ||
| Fig. 10 TEM images of the iron oxyhydroxide particles formed by (a) forced hydrolysis compared to that formed by (b) γ-radiolysis method. | ||
Hydrolysis:
| Fe3+ + H2O ⇆ Fe(OH)2+ + H+ pKa(1) = 3.0 | (12a) |
| Fe(OH)2+ + H2O ⇆ Fe(OH)2+ + H+ pKa(2) = 3.4 | (12b) |
| Fe(OH)2+ + H2O ⇆ Fe(OH)3 + H+ pKa(3) = 7.1 | (12c) |
| Fe(OH)3 + H2O ⇆ Fe(OH)4− + H+ pKa(4) = 10 | (12d) |
| Nucleation and growth: Fe(OH)3(aq) → Fe(OH)3(solid) | (13) |
| Solid-state conversion: Fe(OH)3(solid) → γ-(FeOOH)(solid) + H2O | (14) |
In the forced hydrolysis method the product composition or structure is affected by small variations in conditions such as pH, concentration of the reagents, method of mixing and temperature. This sensitivity of the method complicates both the reproducibility of the process and the challenges in scaling the process for industrial applications. The forced hydrolysis method of preparing metal oxyhydroxide or oxide nanoparticles demonstrates some of the significant challenges that nanoparticle fabrication faces, many of which are mitigated by using the gamma-radiation method.
In the γ-radiation method presented here we start with ferrous ions that are highly soluble even in neutral or mildly acidic solutions, which are easily and homogeneously oxidized by radiolytically-produced oxidants to produce the ferric hydroxide nucleate particles without altering pH or temperature. This process continually produces ferric ions, the particle constituent atoms, and thereby grows the nanoparticles.
We have shown that iron-oxide nanoparticle formation and growth from ferrous ions driven by γ-radiation occurs in three distinct stages. The main processes in these three stages are schematically shown in Fig. 11.
 | ||
| Fig. 11 Schematic of the main processes occurring in different kinetic stages to form mixed FeII/FeIII nanoparticles. | ||
Stage 1 involves the aqueous-phase oxidation of Fe2+ to Fe3+ by radiolytically-produced ˙OH (reaction (5)), followed by hydrolysis of Fe3+ (reactions (12a) to (12d)):42
| Dissolution of ferrous ions: Fe(SO4) → Fe2+ + SO42− | (15) |
| Radiolytic oxidation (reaction (6)): Fe2+ + ˙OH → Fe3+ + OH− |
Hydrolysis of ferric ions (reaction (12)):
| Fe3+ + 3OH− ⇆ Fe(OH)2+ + 2OH− ⇆ Fe(OH)2− + OH− ⇆ Fe(OH)3 |
Nucleation:
| Fe3+(aq) + Fe2+(aq) + nH2O → (FeII)x(FeIII)y(OH)2x+3y | (16) |
The water radiolysis calculations (Fig. 9) predict that the rate of radiolytic production of Fe3+ will be linearly proportional to the radiation dose rate but independent of [Fe2+]0. This rate is calculated to be ∼0.24 μM s−1 at the studied dose rate of 0.8 Gy s−1. At this rate the concentration of ferric ions quickly (in less than 10 ms) reaches its saturation limit (∼4.0 × 10⁻¹² M at pH 6.043) under all of the conditions studied.
The ferric ions are quickly hydrolyzed (reaction (12)). This hydrolysis releases a proton and this process is responsible for the pH drop seen in Stage 1. The overall production of FeIII during Stage 1 is ∼0.15 mM (Fig. 3). The proton production associated with this amount of FeIII is sufficient to lower the solution pH from 6.0 to ∼3.8 or 3.5 before the system reaches hydrolysis equilibrium (reaction (12)). This is consistent with the observed pH change shown in Fig. 3.
As the FeIII hydroxide species are formed, they can condense by polymerization of Fex(OH)y3x−y,27 which triggers co-precipitation of Fe2+(aq) and Fe3+(aq) species as mixed hydroxide nucleate particles (process (16)). Compared to oxidation by a chemical additive, the radiolytic oxidation promotes faster and more uniform particle nucleation because of the rapid, homogenous and constant production of the aggressive oxidant, ˙OH. As nucleates are formed the main oxidation mechanism changes and the reaction kinetics moves to Stage 2.
Stage 2 mainly involves the adsorption of ferrous ions on the particles formed in Stage 1 (process (17)), followed by surface oxidation of FeII(ad) to FeIII(ad) by H2O2 (reaction (18)):
| Fe2+(aq) → FeII(ad) | (17) |
| 2FeII(ad) + H2O2 → 2FeIII(ad) + 2OH− | (18) |
| FeII(ad) + 2FeIII(ad) + 8H2O → Fe3(O)n(OH)8−2n + nH2O + 8H+ → Fe3O4 + 4H2O + 8H+ | (19) |
The overall iron oxidation kinetics in Stage 2 are controlled by the rate of the surface oxidation of FeII(ad). This rate depends on two processes that occur in series, processes (17) and (18). The rate of adsorption (process (17)) depends on the adsorption surface area (A) and [Fe2+(aq)]t while the rate of oxidation (reaction (18)) depends on [FeII(ad)]t and [H2O2]t. The rate of the two processes in series is controlled by the slower of the two processes. Oxidation of FeII to FeIII is known to be very fast, so the slower process is expected to be the transport and adsorption of FeII to the surface (process (17)). This is confirmed by the observed linear dependence of the net rate of oxidation of FeII to FeIII on [Fe2+]0 in Stage 2 (see Fig. 3). Transport of FeII species to the surface is driven by a concentration gradient caused by its depletion at the surface, and is accompanied by diffusion of OH− (from reduction of H2O2) away from the surface. In the more concentrated FeSO4 solutions, the higher ionic strength is expected to slightly lower the rates of reactions involving Fe2+. However, this change is small compared to the expected orders of magnitude differences in rates between different reaction steps, and would not affect our overall conclusions.
The particle growth phase occurring in Stage 2 is kinetically limited by the rate of diffusion of reactants to the surface of the particles, rather than the rates of their reaction and incorporation into the solid lattice. A generalized multi-stage mechanism for metal oxide nanoparticle formation in solutions has been reported by Oskam, and many of the conclusions are applicable to the present work.45 The mechanism involves the sequential steps of saturation, formation of nucleation precursors and then nucleation, followed by coarsening and aggregation of the initial particles. A detailed analysis of how the relative rates of the processes affect the final particle size distribution was carried out. In particular, this analysis predicts that when particle growth is diffusion-limited (diffusion of reactants to the surface is slower than their incorporation into the lattice), smaller particles will grow faster than larger ones. This means that smaller particles can “catch up” with larger ones, resulting in a narrower size distribution. As particle growth in the present work is also diffusion-limited, we would expect to see the same narrowing of size distribution in the growth phase.
The combination of mass transport processes and reactions (17) to (19) that occur in Stage 2 do not induce significant changes in the proton concentration in solution. This is consistent with the negligible changes in pH observed for Stage 2 (Fig. 3). The net effect of consumption of radiolytically produced oxidants during the oxidation of FeII to FeIII is a decrease in the rates of the reactions of those oxidants with H2 produced by water radiolysis. Hence, there is an increase in the production of H2(g) in Stage 2 (again see Fig. 3).
With time the [Fe2+(aq)] in solution decreases, slowing the rates of surface oxidation of FeII(ad) to FeIII(ad) (reaction (18)) and mixed oxide formation (reaction (19)). In addition, as FeIII(ad) accumulates, the back reduction of FeIII(ad) to FeII(ad) by a radiolytic reductant becomes a significant process. The combined effect of these changes is a gradual decrease in rate of oxidation with time. Although the number of particles formed in Stage 1 is nearly independent of [Fe2+]0, the particles grow faster and the overall particle surface area increases faster with more Fe2+ in the solution. As a result, Stage 3 is reached faster and the duration of Stage 2 is shorter in a solution with a higher [Fe2+]0.
Stage 3 mainly involves cyclic FeII and FeIII redox reactions with a small or negligible net oxidation rate while the particles undergo coarsening or aggregation. Hence, the [FeIII] does not change significantly with time (Fig. 3) while some particles continue to grow larger (Fig. 4).
Although the net rate of FeII to FeIII oxidation is zero, the redox system is dynamic, powered by a continuous radiation flux. In particular, radiolytically-produced H2O2 can act as an oxidant for FeII and as a reductant for FeIII. The standard redox potentials for H2O2 reduction to OH− and its oxidation to O2 are known:43
| H2O2 + 2H+ + 2e− ⇆ 2H2O E0 = 1.763 VSHE | (20) |
| O2 + 2H+ + 2e− ⇆ H2O2 E0 = 0.695 VSHE | (21) |
| Fe(OH)3 + H+ + e− ⇆ Fe(OH)2 + H2O E0 = 0.069 VSHE | (22) |
| 2H+ + 3γ-FeOOH + 2e− ⇆ Fe3O4 + 2H2O E0 = 0.789 VSHE | (23) |
| 2FeII(ad) + H2O2 → 2FeIII(ad) + 2OH− | (24) |
| 2FeIII(ad) + H2O2 → 2FeII(ad) + 2H+ + O2 | (25) |
| FeII(ad) ⇆ Fe2+(aq) | (26) |
| FeIII(ad) ⇆ Fe3+(aq) | (27) |
In Stage 3, the rates of the forward and reverse reactions of these equilibria are high in the presence of a continuous flux of radiation and this will accelerate the radiation-induced aggregation or coarsening of the particles. The rates of the redox reactions (24) and (25) are constant with time under continuous irradiation and this leads to a narrow size distribution of the particles formed in Stage 3. In chemical methods coarsening of particles occurs through the continuous dissolution–reprecipitation of particle constituent atoms, because larger particles are in general energetically more stable than smaller particles, known as Ostwald ripening.46 In the present work we observe a radiolytically-induced oxidation/reduction cycle which tends to redistribute iron compounds between the particles, resulting in a process which is similar to, but not the same as Ostwald ripening. While Ostwald ripening results in larger particles growing while smaller particles shrink and disappear, the radiolytic process we observed involves cycles of reductive dissolution and oxidative precipitation. This tends to average out the particle size, and also induce aggregation by the formation of bridges of FeII/FeIII hydroxide materials between the particles. As far as we know, this radiolytic coarsening/aggregation process in metal oxide nanoparticle formation has not previously been reported.
5. Conclusion
Magnetite nanoparticles were formed by γ-radiolysis of solutions containing different initial concentrations of FeSO4 without any other chemical additives. The particles formed had a narrow size distribution, and the average size increased with [Fe2+]0. Particle size ranged from 23 ± 2 nm to 300 ± 40 depending on the starting Fe2+ concentration. We have established a mechanism for radiolysis-induced iron-oxide nanoparticle formation and growth that is very well supported by our experimental and modelling results. The mechanism involves three kinetic stages of nanoparticle formation and growth, and we have identified the main rate-controlling process for each stage.Stage 1 involves nucleation of mixed FeII/FeIII hydroxide particles via homogeneous radiolytic oxidation of Fe2+ to Fe3+. In Stage 2, the dominant process is the adsorption of ferrous ions on the existing particles, followed by surface oxidation of FeII to FeIII. The adsorbed FeII and FeIII are then incorporated into the growing particle oxide lattice. Stage 3 involves a redox cycle between FeII and FeIII driven by reduction and oxidation by H2O2. This results in negligible net oxidation but coarsening of particles. In Stage 3 net growth of the primary particles is negligible but the radiation-induced aggregation and coarsening of particles occurs.
The initial ferrous ion concentration has a negligible effect on the radiolytic oxidation of Fe2+ to Fe3+ in solution in Stage 1, but it does increase the rate of surface oxidation on growing particles in Stage 2. Thus, the final oxidation yield of FeIII increases approximately linearly with the [Fe2+]0 and this results in the average size of the final particles increasing with ([Fe2+]0)1/3. The improved mechanistic understanding of metal oxide nanoparticle synthesis using gamma-radiation gained from this study will be useful in developing effective and economical ways of synthesizing iron oxide nanoparticles for specific applications.
Acknowledgements
This work was funded under a NSERC (Natural Science and Engineering Research Council of Canada) Discovery grant. Support from a Canada Foundation for Innovation New Opportunity grant and the Ontario Research Fund Excellence in Research: Nuclear Ontario grant are greatly acknowledged for the purchase of the UV-Vis absorption and FTIR spectrometers, respectively. T. Sutherland would like to thank the Canadian Nuclear Society for the CNS Scholarship for PhD Graduate Research. The authors would like to recognize Dr Richard Gardiner at the Western University Biotron Facility for his assistance with TEM imaging. The authors wish to thank Ms Mary Jane Walzak at Surface Science Western for her assistance in performing Raman measurements.References
- E. S. Jang, J. H. Shin, G. Ren, M. J. Park, K. Cheng, X. Y. Chen, J. C. Wu, J. B. Sunwoo and Z. Cheng, Biomaterials, 2012, 33, 5584–5592 CrossRef CAS PubMed.
- S. Basu, S. Chatterjee, A. Bandyopadhyay and K. Sarkar, J. Sci. Food Agric., 2013, 93, 788–793 CrossRef CAS PubMed.
- G. L. Zhang, L. Qin, Y. J. Wu, Z. H. Xu and X. W. Guo, Nanoscale, 2015, 7, 1102–1109 RSC.
- C. J. Belle, A. Bonamin, U. Simon, J. Santoyo-Salazar, M. Pauly, S. Begin-Colin and G. Pourroy, Sens. Actuators, B, 2011, 160, 942–950 CrossRef CAS.
- F. Wang, X. F. Qin, Y. F. Meng, Z. L. Guo, L. X. Yang and Y. F. Ming, Mater. Sci. Semicond. Process., 2013, 16, 802–806 CrossRef CAS.
- M. T. C. Fernandes, R. B. R. Garcia, C. A. P. Leite and E. Y. Kawachi, Colloids Surf., A, 2013, 422, 136–142 CrossRef CAS.
- E. Popovici, F. Dumitrache, I. Morjan, R. Alexandrescu, V. Ciupina, G. Prodan, L. Vekas, D. Bica, O. Marinica and E. Vasile, Appl. Surf. Sci., 2007, 254, 1048–1052 CrossRef CAS.
- A. Hassanjani-Roshan, M. R. Vaezi, A. Shokuhfar and Z. Rajabali, Chem. Mater., 2011, 9, 95–99 CAS.
- S. Basak, K. S. Rane and P. Biswas, Chem. Mater., 2008, 20, 4906–4914 CrossRef CAS.
- P. A. Yakabuskie, J. M. Joseph, P. Keech, G. A. Botton, D. Guzonas and J. C. Wren, Phys. Chem. Chem. Phys., 2011, 13, 7167–7175 RSC.
- L. M. Alrehaily, J. M. Joseph, M. C. Biesinger, D. A. Guzonas and J. C. Wren, Phys. Chem. Chem. Phys., 2013, 15, 1014–1024 RSC.
- L. M. Alrehaily, J. M. Joseph, A. Y. Musa, D. A. Guzonas and J. C. Wren, Phys. Chem. Chem. Phys., 2013, 15, 98–107 RSC.
- J. Belloni, M. Mostafavi, H. Remita, J. L. Marignier and M. O. Delcourt, New J. Chem., 1998, 22, 1239–1255 RSC.
- B. D. Plouffe, D. K. Nagesha, R. S. DiPietro, S. Sridhar, D. Heiman, S. K. Murthy and L. H. Lewis, J. Magn. Magn. Mater., 2011, 323, 2310–2317 CrossRef CAS.
- J. E. Skebo, C. M. Grabinski, A. M. Schrand, J. J. Schlager and S. M. Hussain, Int. J. Toxicol., 2007, 26, 135–141 CrossRef CAS PubMed.
- M. J. Li, K. Xiang, G. Q. Luo, D. R. Gong, Q. Shen and L. M. Zhang, Chin. J. Chem., 2013, 31, 1285–1289 CrossRef CAS.
- J. W. T. Spinks and R. J. Woods, An Introduction to Radiation Chemistry, Wiley, New York, 1990 Search PubMed.
- J. C. Wren, Nuclear Energy and the Environment, American Chemical Society, 2010, ch. 22, vol. 1046, pp. 271–295 Search PubMed.
- A. Abedini, A. R. Daud, M. A. Abdul Hamid and N. Kamil Othman, PLoS One, 2014, 9, e90055 Search PubMed.
- G. B. Ekoko, J. K.-K. Lobo, O. M. Mvele, J. L. Muswema, J.-F. S. Yamambe and P. K. Mangwala, Int. J. Mater. Sci. Appl., 2014, 6, 339–343 Search PubMed.
- J. M. Joseph, B. S. Choi, P. Yakabuskie and J. C. Wren, Radiat. Phys. Chem., 2008, 77, 1009–1020 CrossRef CAS.
- P. A. Yakabuskie, J. M. Joseph, C. R. Stuart and J. C. Wren, J. Phys. Chem. A, 2011, 115, 4270–4278 CrossRef CAS PubMed.
- P. A. Yakabuskie, J. M. Joseph and J. C. Wren, Radiat. Phys. Chem., 2010, 79, 777–785 CrossRef CAS.
- L. L. Stookey, Anal. Chem., 1970, 42, 779–781 CrossRef CAS.
- E. Viollier, P. W. Inglett, K. Hunter, A. N. Roychoudhury and P. Van Cappellen, Appl. Geochem., 2000, 15, 785–790 CrossRef CAS.
- D. Fu, P. G. Keech, X. L. Sun and J. C. Wren, Phys. Chem. Chem. Phys., 2011, 13, 18523–18529 RSC.
- C. F. Baes and R. E. Mesmer, The Hydrolysis of cations, Wiley, New York, 1976 Search PubMed.
- R. J. Knight and R. N. Sylva, J. Inorg. Nucl. Chem., 1975, 37, 779–783 CrossRef CAS.
- B. C. Faust and J. Hoigné, Atmos. Environ., Part A, 1990, 24, 79–89 CrossRef.
- D. M. Sherman and D. Waite, Am. Mineral., 1985, 70, 1262–1269 CAS.
- A. J. Davenport, J. A. Bardwell and C. M. Vitus, J. Electrochem. Soc., 1995, 142, 721–724 CrossRef CAS.
- J. Prietzel, J. Thieme, K. Eusterhues and D. Eichert, Eur. J. Soil Sci., 2007, 58, 1027–1041 CrossRef CAS.
- J. F. Boily, P. L. Gassman, T. Peretyazhko, J. Szanyi and J. M. Zachara, Environ. Sci. Technol., 2010, 44, 1185–1190 CrossRef CAS PubMed.
- J. Bessiere, M. Perdicakis and B. Humbert, C. R. Acad. Sci., Ser. IIc: Chim., 1999, 2, 101–105 CrossRef CAS.
- G. V. Buxton, C. L. Greenstock, W. P. Helman and A. B. Ross, J. Phys. Chem. Ref. Data, 1988, 17, 513–886 CrossRef CAS.
- J. C. Wren and J. M. Ball, Radiat. Phys. Chem., 2001, 60, 577–596 CrossRef CAS.
- J. C. Wren and G. A. Glowa, Radiat. Phys. Chem., 2000, 58, 341–356 CrossRef CAS.
- P. Driver, G. Glowa and J. C. Wren, Radiat. Phys. Chem., 2000, 57, 37–51 CrossRef CAS.
- E. V. Shevchenko, D. V. Talapin, H. Schnablegger, A. Kornowski, Ö. Festin, P. Svedlindh, M. Haase and H. Weller, J. Am. Chem. Soc., 2003, 125, 9090–9101 CrossRef CAS PubMed.
- S. Sun, C. B. Murray, D. Weller, L. Folks and A. Moser, Science, 2000, 287, 1989–1992 CrossRef CAS PubMed.
- J. K. Bailey, C. J. Brinker and M. L. Mecartney, J. Colloid Interface Sci., 1993, 157, 1–13 CrossRef CAS.
- L. D. Benefield, J. F. Judkins and B. L. Weand, Process chemistry for water and wastewater treatment, Prentice-Hall, Englewood Cliffs, NJ, 1982 Search PubMed.
- R. C. Weast, CRC Handbook of Chemistry and Physics, CRC Press, Cleveland, Ohio, 1978 Search PubMed.
- E. Ekeroth, O. Roth and M. Jonsson, J. Nucl. Mater., 2006, 355, 38–46 CrossRef CAS.
- G. Oskam, J. Sol–Gel Sci. Technol., 2006, 37, 161–164 CrossRef CAS.
- R. Boistelle and J. P. Astier, J. Cryst. Growth, 1988, 90, 14–30 CrossRef CAS.
| This journal is © the Owner Societies 2017 |