
Infrared dynamics study of thermally treated perfluoroimide acid proton exchange membranes
L.
Puskar
*a,
E.
Ritter
b,
U.
Schade
a,
M.
Yandrasits
c,
S. J.
Hamrock
c,
M.
Schaberg
c and
E. F.
Aziz
ade
aMethods for Material Development, Helmholtz-Zentrum für Materialien und Energie GmbH, 12489 Berlin, Germany. E-mail: ljiljana.puskar@helmholtz-berlin.de
bHumboldt-Universität zu Berlin, Experimentelle Biophysik, 10115 Berlin, Germany
c3M Energy Components Program, 3M Center, St Paul, MN 55144, USA
dFreie Universität Berlin, Fachbereich Physik, 14195 Berlin, Germany
eSchool of Chemistry, Monash University, Victoria, 3800, Australia
First published on 23rd November 2016
Abstract
The temperature induced dehydration process of the 3M Brand perfluoroimide acid (PFIA), an advanced proton exchange membrane for fuel cells, was studied by in situ infrared spectroscopy to understand proton transport processes under conditions of low hydration levels. A comprehensive assignment of the vibrational bands of PFIA in the mid infrared region is provided. Investigation of the kinetics in conjunction with 2D correlation spectroscopy methods revealed the sequential process of the hydration and dehydration in a conclusive model. The results indicate that at a lower water content the sulfonate group of the PFIA side chain is preferentially ionised and involved in a hydrogen bonding structure with the sulfonyl imide acid group, until a sufficient amount of water is present to ionise the second ionic site. Comparison to the well-understood NAFION™ membrane revealed that under low humidity conditions a higher amount of water is retained in PFIA in a state most similar to liquid water. The results contribute to a better understanding of water retention capability and thus proton conductivity under high-temperature and low-humidity conditions.
Introduction
Proton exchange membranes (PEMs) play a central role in the operation of fuel cells (FCs), they separate the anode from the cathode sections and selectively allow protons to diffuse towards the cathode while blocking the oxygen and hydrogen gases.1 Perfluorinated sulfonic acids (PFSAs) have most widely been used as PEMs due to their mechanical, chemical and thermal stability, however further improvements are still in demand.2,3 Efficient electrochemical reduction of oxygen at the cathode of the FC requires stable and inexpensive catalysts2,4,5 and improved durability with high proton conductivity electrolyte membranes that perform well under hot and dry conditions.6–10NAFION™ membranes with a hydrophobic tetra-fluoroethylene (PTFE) backbone and hydrophilic pendant chains terminating in sulfonate groups are still the most commercially used PEMs in the FC industry.11,12 The molecular structure of water confined inside the channels of NAFION™ membranes has been extensively studied at different hydration stages and is influenced by the size of water channels formed due to clustering of the hydrophilic sulfonic acid groups or by the closeness to the hydrophobic polymer backbone.12–15 Although very stable and efficient at proton transport at a high relative humidity (0.1 S cm−1, 100% RH and 30 °C),16 its performance degrades at a lower humidity and under higher temperature conditions.17
The efficiency of the proton conductivity under dryer conditions of PEMs is largely influenced by the water retention capability.11 When abundant water molecules are present a bulk diffusion in the central region of water channels is reported as dominant,18 either by the Grotthus mechanism19 in which the proton is delivered from one water molecule to the next by a local molecular motion, or by the vehicle mechanism where hydrated hydronium ions move through the solvent.20 A surface diffusion mechanism where a proton hops between adjacent sulfonic acid sites via intermediate water molecules becomes more important with increased water confinement at low hydration levels.18,21 The contribution from all the proton conductivity mechanisms should be considered in PEMs.18,21–23 The hydrated hydronium ions are found in Zundel24 H5O2+ or Eigen25 H9O4+ cation forms, however since in PEMs excess protons are abundant due to the high acidity, higher order structures H2n+1On+ have also been reported.26
Recent developments towards improved PEM performance reported use of multi acid side chains to retain high proton conductivity, stabilizing additives for improved chemical or polymer nanofibers for mechanical stability.8,10,27 Having multiple acidic sites per side chain lowers the ionomer equivalent weight (EW = grams of ionomer per mole of acid) without compromising the mechanical stability and allows for the formation of larger ionic channels which increases proton conductivity.28 Perfluoroimide acid or PFIA is one of these multi-acid PEMs recently developed by the 3M Company's (3M) Fuel Cell Components Group that incorporates a bis-sulfonyl imide group into pendant chains providing an additional source of the protonic group (Scheme 1A, compare Scheme 1B for NAFION™).8 Bis-sulfonyl imide is known to have an acid strength even higher than the terminal sulfonic acid in the gas phase.29 PFIA was reported by 3M as high performing with the low EW 625 but significant backbone crystallinity equivalent to ionomers of EW 1000.9Fig. 1 shows the higher conductivity of PFIA in comparison to NAFION™ under different relative humidity conditions at 80 °C.
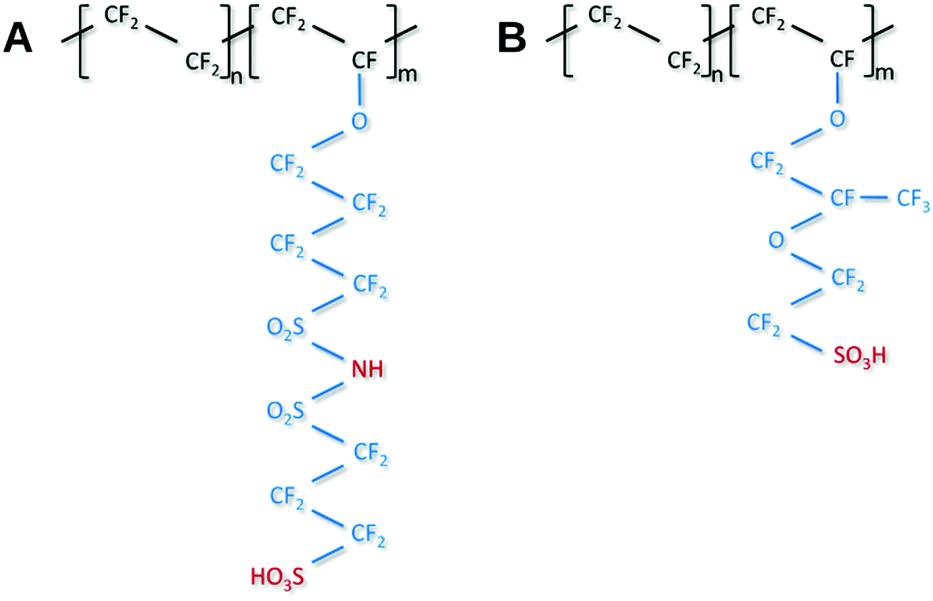 | ||
| Scheme 1 Structure of 3M's PFIA (A) and Dupont NAFION™ membrane (B) ionomers. | ||
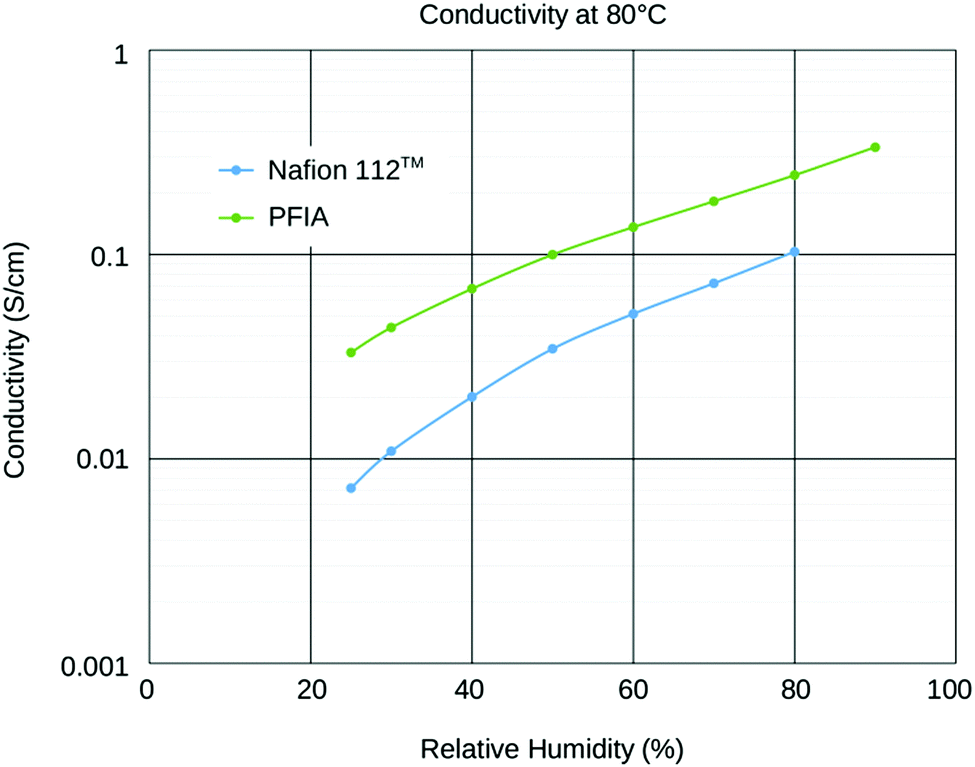 | ||
| Fig. 1 Conductivity of 25 μm thick 625 g per equivalent PFIA and 2100 g per equivalent NAFION™ at 80 °C as a function of relative humidity. Conductivity was measured using a 4-point conductivity probe. | ||
Infrared spectroscopy as a technique sensitive to the molecular level changes in water, the functional ionic or acidic side groups as well as the backbone of materials has extensively been used to study PEM membranes.12,30–35 We applied Fourier transform infrared (FTIR) spectroscopy to follow the changes in H2O saturated PFIA membranes during heating to high temperatures under a range of humidity conditions. These in situ measurements in conjunction with 2D correlation analysis allowed the full assignment of bands in the mid infrared region and further provided information on the microstructural changes occurring during heating and cooling processes. Comparison to the well-studied NAFION™ membrane provides a further understanding of the processes contributing to the proton conductivity at a low relative humidity.
Experimental procedures
Materials
PFIA membranes of 25 μm thickness and 625 g per equivalent were obtained from the 3M's Fuel Cell Components Group. NAFION™ NR211 membranes of 25 μm thickness and 2100 g per equivalent were purchased from Ion Power GmbH in the acid (H+) form. Both membranes were cut into ∼2 × 2 cm squares and then pre-treated to remove any impurities and fully convert to the H+ form. The standard pre-treatment procedure36,37 involved lightly boiling the membranes (∼80 °C) first in 3% H2O2 for one hour, two hours in deionized (DI) water followed by further one hour in 0.5 M H2SO4 and the final rinse with lightly boiling DI water. The membranes were rinsed after each of the boiling steps and stored in deionized water for at least 24 hours before the measurements. High purity alkali salts were obtained from Carl Roth GmbH (NaCl 99.5% and KCl 99%). The PFIA and NAFION™ NR211 membranes in the alkali salt-forms were prepared by soaking the pre-treated membranes in the corresponding 1.0 M alkali halide solutions for at least 24 hours at room temperature.Proton conductivity measurements
PFIA membrane proton conductivity measurements were performed at 3M Company using an AC impedance method with a standard, in-plane, 4-point probe conductivity apparatus and platinum wire electrodes.38Membrane samples of approximately 1 cm wide and 4 cm long were measured at 80 °C and at fixed humidity. The cell was connected to a potentiostat (Model 273, Princeton Applied Research) and an Impedance/Gain Phase Analyzer (SI 1260, Schlumberger). AC impedance measurements were performed using Zplot and Zview software (Scribner Associates). Temperature and relative humidity were controlled using a constant humidity oven (TestEquity Model 1000H). Between two and thirteen measurements were performed on each sample. The initial humidity was 70% RH and data were collected at successive 10 RH percentage point intervals upon lowering the RH to 20%. Measurements were then taken as the humidity was increased from 20% RH by increments of 10 percentage points up to 90% RH.
FTIR measurements
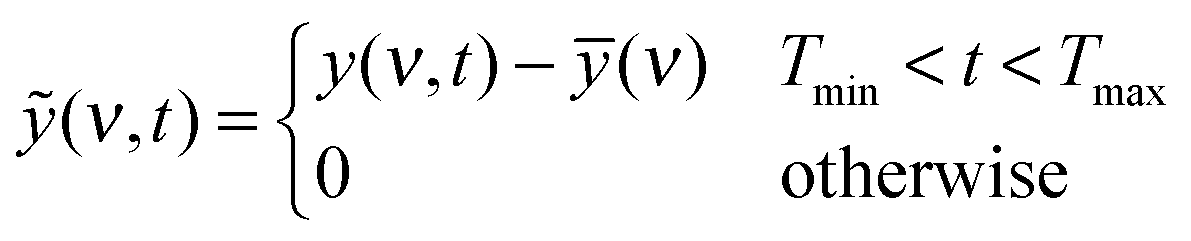
Temperature dependent mid-infrared spectra were measured in transmission mode using a Bruker Vertex 70/v instrument equipped with a KBr beam splitter, a DTGS detector and a globar as a radiation source. Pre-treated membranes with the excess surface water removed by Motic lens papers were placed between two 22 mm diameter and 2 mm thick ZnSe windows of a modified Harrick demountable FTIR transmission cell suitable for in-vacuum heating. A 630 μm thick PTFE spacer was chosen to separate the windows and minimize the formation of fringes. Regions on opposing sides of the spacer were cut out to allow for gas purge through the gas/liquid inlet and outlet of the Harrick cell. Temperature was measured using two thermocouples positioned in the cuvette close to the sample. The temperature was recorded using a USB data logger (EL-USB-TC-LCD) with a time-resolution of 30 seconds. To control the temperature, a temperature controller (Harrick Model ATC-024-2) was modified to allow for fast heating to the desired temperature (>200 °C). The sample was purged with air of defined humidity to control the dehydration/rehydration process. A relative humidity (RH) of 80% was generated by purging dried air (0.1% RH) through deionized water, whereas direct purging of dried air through the cell provided 0.1% RH. A 30% RH in a non-flowing vapor environment was also employed to slow down the diffusion of water vapor to the sample and prolong the timescale of the rehydration process. Humidity of the cell was recorded throughout the experiment at an ∼30 s interval using two humidity sensors (Sensirion™ EK-H4), placed at the inlet and the outlet of the cell. Time-dependent spectral datasets were recorded with a time-resolution of 1 min (co-adding 74 single scans) at 4 cm−1 spectral resolution. Spectra of the empty cell were used as a reference during the heating or cooling experiments. In addition, each of these measurement series was further referenced against the ‘empty channel’ spectra recorded when the translation stage containing the liquid cell was moved out of the line of the spectrometer thus accounting for variations in the spectrometer during the two sets of temperature measurements.Data treatment & analysis
Primary spectra recording, instrument and sample stage control, calculation of absorbance spectra and assembling datasets with the spectra as a function of time were done with the Bruker™ OPUS 7 spectroscopy software. All further data evaluation steps were performed with a home-made program for ‘GNU Octave’, a high-level programming language for numerical mathematics.39 The time-dependent spectral data were arranged column-wise in a matrix Mi,j with i = 1…z, z being the number of the spectral interval and j = 1…T where T is the total number of spectra obtained during the respective heating/cooling period. Consequently, the jth column of M describes the spectrum measured at the time t = t0 + j × Δt, t0 being the start time of the experiment and Δt being the time-interval necessary for recording of one single spectrum.For statistical analysis of the time/temperature-dependent datasets, a method based on singular value decomposition (SVD) and rotational analysis was used.40,41 Briefly, SVD was implemented to decompose the original spectral matrix M into three matrices U, S and V where M = USVT. U is a z × z matrix of independent spectral components, V is a T × T matrix of kinetics and S is the z × T matrix, whose diagonal elements are the singular values and is zero otherwise.
The diagonal elements Si correspond to the significance of the associated spectral components Ui. Following SVD, a rotation procedure,40 based on the autocorrelation of the columns of V, was applied and the data matrix M′ was reconstructed with a subset of the significant components, thereby discarding noise. This allowed for the estimation of the transition times and temperatures within the different steps involved, since it determines the main spectral components and their corresponding kinetics.
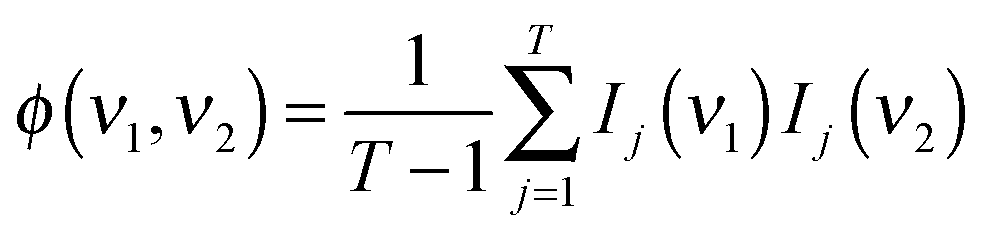
Further information on kinetics and the correlation of several bands was obtained from 2D correlation analysis. Another advantage of this method is that it allows for the estimation of the band order even when the precise normalization is not possible. A method based on the generalized 2D algorithm was used42,43 which provided the order of changes occurring in different bands as well as powerful deconvolution. Two contour maps are generated, synchronous and asynchronous, characterizing the kinetics of the sample.
Briefly, the dynamic spectrum of a system influenced by an external parameter change such as heating is given by:44
| X(ν1,ν2) = 〈ỹ(ν1,t) × ỹ(ν2,t′)〉 |
| X(ν1,ν2) = ϕ(ν1,ν2) + iΨ(ν1,ν2) |
where Ij(νi) = I(νi,tj) is the absorbance at the given time/wavenumber, and the asynchronous part of the correlation spectrum was determined using the Hilbert–Noda transformation matrix N:44,45
In the synchronous and asynchronous maps, yellow/red colors indicate positive intensities while cyan/blue regions indicate negative intensities. The synchronous map retains information on the direct, simultaneous correlation of bands. A positive cross-peak indicates the two related bands changing in the same direction whereas a negative one shows the opposite direction of change. This map is symmetric towards the line ν1 = ν2 (I(ν1,ν2) = I(ν2,ν1)). The asynchronous correlation map, being antisymmetric with respect to ν1 = ν2 (I(ν1,ν2) = −I(ν2,ν1)), provides information on the order in which the changes occur. The Noda rules43 are a convenient algorithm to estimate the temporal relationship between two bands: when the sign of the cross-peaks situated in the lower right is the same in the synchronous and asynchronous plots, the band with the lower wavelength undergoes changes prior to the band with the higher wavelength. Opposite signs indicate an inverted band order, whereas an intensity of zero in the asynchronous plot indicates that both bands change on exactly the same timescale. Sun et al. provided a simplified algorithm to determine the band order of two or more bands where only the signs of the synchronous and asynchronous cross-peaks are taken into account.46 For the present work, this method was used to calculate the band order when more than two bands were studied.
Results and discussion
Fig. 2 shows temperature dependent FTIR transmission spectra of a 25 micron water saturated PFIA film heated to 200 °C at the rate of approximately 9 degrees per minute under 80% RH. The portion of the spectra in the fingerprint region from 1500 to 500 cm−1 is shown in Fig. 2A with the main absorbance peaks that undergo significant changes during the dehydration process indicated. The spectra of fully hydrated samples are shown in blue changing towards the dehydrated state represented by red colour. The strong and in this case saturating feature between 1275 and 1100 cm−1 is due to the asymmetric and symmetric CF stretching vibrations from CF2 units of the backbone, reported as not being substantially affected by the amount of water.31,32,47 The immediate decrease over the whole spectral range, particularly noticeable below 1000 cm−1, is caused by loss of “bulk water” or water clusters inside the channels of the fully hydrated PFIA. These features occur due to a combination of liberation modes found at ∼700 cm−1 in liquid water and the broad continuum water absorption stretching over the 3400 to 500 cm−1 region.24,26,48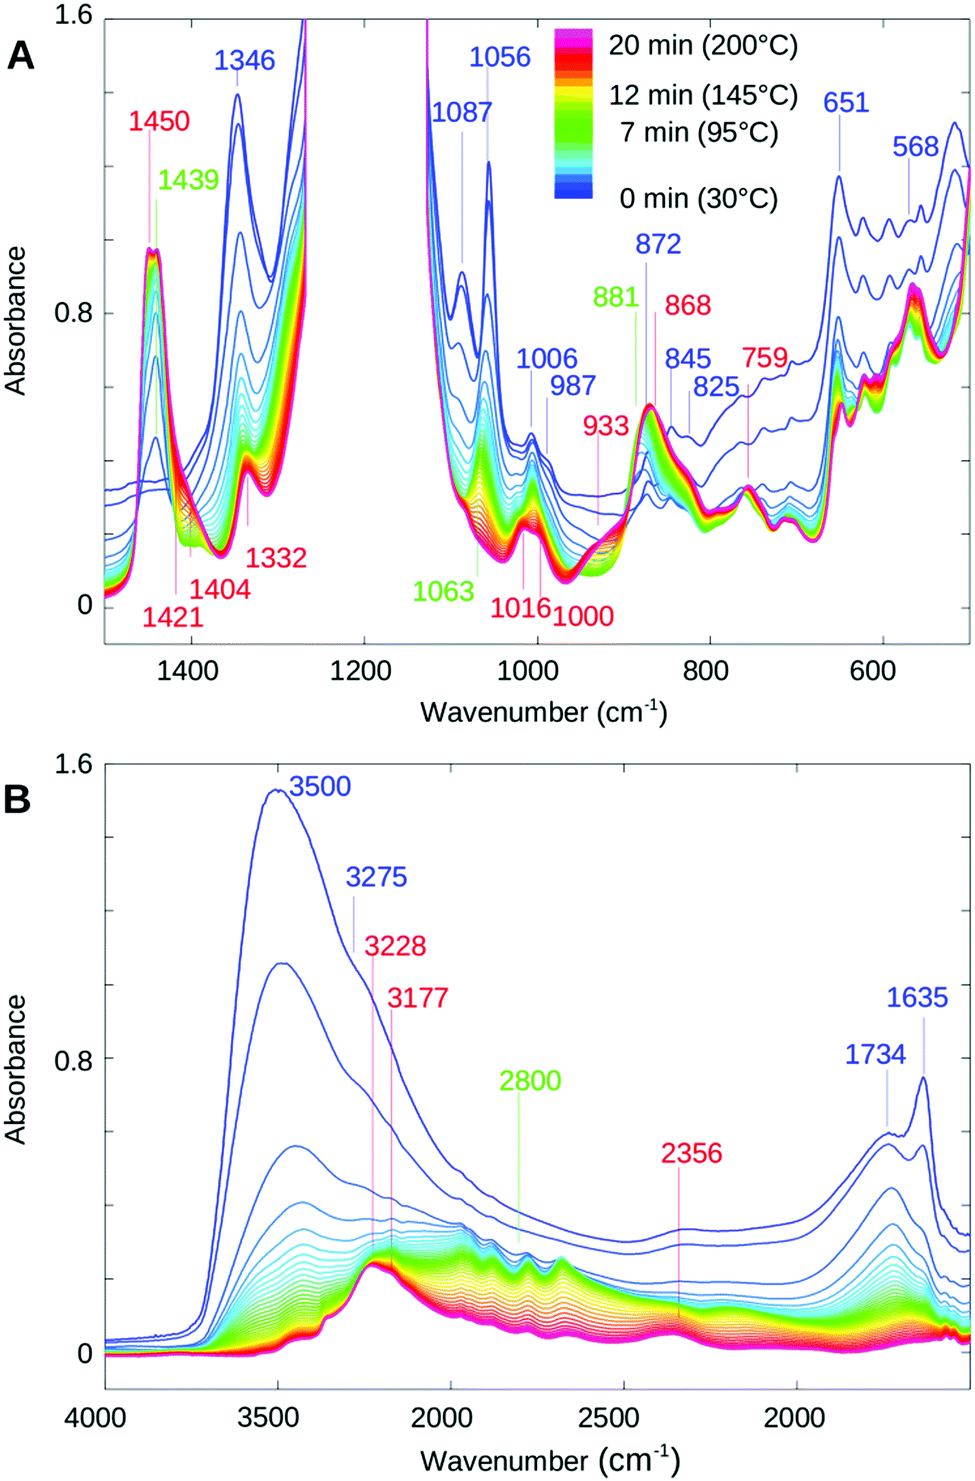 | ||
| Fig. 2 Infrared spectra measured during the temperature-induced dehydration of PFIA, starting from the fully hydrated state at 30 °C, 80% relative humidity (blue) to the dehydrated state at 200 °C, 0.1% relative humidity (red). Spectra were measured with a time-resolution of 1 min. (A) Spectral range between 1500 and 500 cm−1 dominated by fingerprint bands of PFIA. (B) Range between 4000 and 1500 cm−1 predominantly showing water bands. | ||
Ionic forms
The peak at 1056 cm−1 seen in the fully hydrated PFIA at room temperature decreases with temperature and dehydration, undergoes a blue shift to 1063 cm−1 and finally disappears, the effect also found in NAFION™ membranes heated to 200 °C (data not shown). For perfluorinated ionomers containing sulfonate groups, a band at ∼1060 cm−1 was assigned to the symmetric stretching vibration of dissociated –SO3− groups.23,31,49–52 In bis[(perfluoroalkyl)sulfonyl]imide, ionomers similar to NAFION™ membranes but with sulfonyl imide replacing the –SO3H acidic group, Byun et al. reported asymmetric SNS stretching vibration of ionic sulfonyl imide at 1069 cm−1.53 Similarly, a band at around 1056 cm−1 in (CF3SO2)2N− was assigned to the antisymmetric SNS stretch.54 Since both of these ionic groups are present in PFIA it is likely that symmetric stretch of SO3− groups and the antisymmetric SNS stretch both contribute to the 1056 cm−1 band.Based on similarity to the NAFION™ films, a shoulder at 1285 cm−1 largely overlapped by the strong CF vibrations of the backbone can be attributed to the asymmetric stretching vibration of the SO3− ionic form.53,55,56 According to Rey et al. for the (CF3SO2)2N− system the symmetric SNS stretching absorption at 766 cm−1 is very weak, whereas the bending SNS and SO2 appear stronger in the 655 and 605 cm−1 regions respectively.54 Based on the similarity to this work it is possible that the peak we observe at 651 cm−1 is due to the SNS bend of ionic sulfonyl imide. The strong absorbance peak at 1346 cm−1 in the hydrated PFIA film follows a similar behaviour to the 1056 cm−1 peak, however it is broader, red shifting and disappearing faster. In accordance with the literature on similar systems containing sulfonyl imide groups, this band can be assigned to the antisymmetric SO2 stretching mode of ionic sulfonyl imide, whereas the corresponding symmetric SO2 stretching mode is downshifted to 1087 cm−1 and also decreases on a fast time scale.53,54 A small band at 1332 cm−1 remaining in the dry film after 40 minutes at 200 °C does not appear sensitive to further dehydration. A peak at 1006 and a smaller shoulder at 987 cm−1 are both sensitive to dehydration. In a dry form the two peaks are of comparable intensities, appearing at 1016 and 1000 cm−1. In this region, the stretching modes of mixed CF and COC characters were reported in IR investigation of perfluoro ethers.57 In water saturated NAFION™ membranes a doublet at 981 and 969 cm−1 is assigned to the stretching vibrations of the COC linkages of the side chains, the former situated closer to the backbone and the latter to the SO3− terminal site and therefore more sensitive to the degree of hydration.31,58 In the case of PFIA only one COC linkage close to the backbone is present and not expected to be very sensitive to the water evaporation. Based on the literature and the similarity to our NAFION™ measurements we tentatively assign 987 cm−1 to the COC stretching.
Acidic forms
The bands appearing and increasing with the loss of water are correlated with the ionic SO3− and SNS− sites becoming neutralised. With the loss of water from NAFION™ membranes the formation of acidic SO3H was reported at 1415 cm−1 in agreement with our NAFION™ heating measurements.34,58 A similar feature at 1431 cm−1 in (CF3SO2)2NH was attributed to the antisymmetric S![[double bond, length as m-dash]](https://www.rsc.org/images/entities/char_e001.gif) O combined with H-NS stretching vibration of the sulfonyl imide group.53,54
O combined with H-NS stretching vibration of the sulfonyl imide group.53,54
Based on the above literature findings and a close match in the position and band shape of the acidic SO3H band of our NAFION™ measurements to the shoulder peak at ∼1421 cm−1 in PFIA we tentatively assign the doublet peaks at 1450 and 1439 cm−1 to the antisymmetric SO of the acidic sulfonyl imide group and the band at ∼1421 cm−1 to the antisymmetric SO to the acidic SO3H form. Further analysis of these bands based on the dynamics study is presented later in the text. The symmetric SO2 vibration of the acidic sulfonyl imide is obstructed by the backbone absorption.54
In the region where three bands centred at 872, 845 and 825 cm−1 exist in the fully hydrated and also in K+ or Na+ exchanged PFIA (data not shown), a broad feature appears and increases with the loss of water peaking at 868 cm−1 and at 825 cm−1 when in the fully dehydrated form. The shoulder at 825 cm−1 can be assigned to the symmetric stretching mode of the COC group of the neutralized form.34 Analogous to the (CF3SO2)2NH molecule a 868 cm−1 band in PFIA can be assigned to the asymmetric stretch of the SNS bond.54 A small broad peak at 933 cm−1 in PFIA which appears at the later stage and together with the appearance of the shoulder at 1421 cm−1 is similar to the broad peak at 896 cm−1 in dehydrated NAFION™ membranes. Based on the similarity it can be ascribed to the S–O vibration of acidic –SO3H.23,59 A SNS bend in (CF3SO2)2NH was reported at 647 cm−1 with a reasonable intensity,54 however we only observe a peak at 759 cm−1 increasing and blue shifting with a decrease of water. A similar peak in NAFION™ membranes is found at 810 cm−1 which suggests that it is related to the sulfonate part of the side chain or the backbone.
In the lowest part of the fingerprint region shown in Fig. 2A, from around 620 down to 500 cm−1 several peaks increase with the temperature, however only the 568 cm−1 band can be associated with the acidic forms of the functional groups (bands disappear upon K+ or Na+ ion exchange for hydrogen). A similar set of bands in NAFION™, however, shifted to slightly higher energies was assigned to the stretching and bending frequencies coming from CF2 molecules of the backbone.51
Water region
Fig. 2B shows the region from 5000 to 1500 cm−1 during the dehydration process. In the fully hydrated form (blue) it is dominated by the presence of water related absorbance bands with the prominent features at 3500 and 1635 cm−1 assigned to water stretching and water bending motions, both decreasing, particularly at the initial stages of dehydration.26,60,61 The upshift of the OH stretching mode with respect to bulk water reported at 3400 cm−1 indicates a less hydrogen-bonded environment within the confined water channels.56,60 The broadness of the band is due to the complicated mixture of overlapping contributions from the HOH bending overtone mixed with Fermi resonance of the stretching fundamental.60,61 In NAFION™, the tailing off at the lower wavenumber side was ascribed to the OH stretches arising from the solvated hydronium ions in configurations where they interact with acidic sulfonate groups.51,60The 1635 cm−1 HOH bending mode in hydrated ionomers is associated with the presence of larger water channels formed when enough water is present to connect the smaller hydrophilic domains of the side chains. In bulk water this band is centered at 1644 cm−1 which also points to a less intense hydrogen bonded environment within the hydrophilic water channels.62 A broad and slightly asymmetric band centered at 1734 cm−1, caused by hydrated hydronium ions in Zundel cation like conformations,26,63 decreases with dehydration. A similar band is observed in strong acids as part of a broad absorption continuum extending over the whole spectral region from the OH stretches down to below 1000 cm−1.24 It is caused by a range of hydrogen bond lengths present in water where either a H+ ion exists in a delocalized form shared between two H2O molecules (Zundel cation-H5O2+),24 or a hydronium ion H-bonded with three water molecules (Eigen cation-H9O4+).25 The continuum band is seen in the spectra of the hydrated samples (blue & green) as absorption generally increased between 4000 and 1000 cm−1 with respect to the spectrum of the dried material (red). The initial decrease of the continuum band, as well as of the 3500 and 1635 cm−1 bands is attributed to the loss of bulk water as reported for NAFION™.26 During an intermediate state of the dehydration process (green lines) where the OH stretching and bending modes have largely lost their intensity a very broad band at around ∼2800 cm−1 is observed. A similar band seen in NAFION™, however much more pronounced, was assigned to the OH stretching mode of H3O+ hydrogen bonded with SO3− and CF2–O–CF2.26 A band at 3228 cm−1 in dehydrated PFIA was assigned to the NH stretching frequency of the acidic form in similar systems containing a sulfonyl imide group.53,54
Dynamics of the dehydration process
Singular value decomposition revealed that the temperature-induced dehydration occurs in three phases for all RH conditions studied (data not shown). The main spectral components showed that the phases are characterized by the same molecular events where only the kinetic constants differed, showing the fastest dehydration for the lowest RH as expected. Similar situation was observed for the rehydration process, however in the opposite direction. The initial phase (completed within approximately 8 minutes from the onset of heating for 80% RH, corresponding to 30 to 100 °C and within 1 minute for 0.1% RH, corresponding to 30 to 85 °C) showed predominant disappearance of bulk water from the central part of the ionic channels (a band decrease at 3500, 1635, ∼700 cm−1 and the continuum) while other bands are largely unchanged. The second phase (80% RH, ∼9–12 min = ∼100–125 °C) is additionally characterized by a clear red shift of the OH stretching mode towards 3430 cm−1 corresponding to an increase of hydrogen bonding, and the appearance of a broader feature at around 2800 cm−1 resulting from the interaction of hydronium ions with the ionized functional groups, as reported to occur with the SO3− groups of NAFION™.26 The broad band at 1734 cm−1 characteristic of H-bonded hydronium ions loses intensity towards the later part of the dehydration phase and also shifts towards 1724 cm−1. Bands caused by the ionic forms of the functional groups (1056, 1087 and 1346 cm−1) show a particularly strong decrease in this second phase, whereas the corresponding acidic peaks (1439 cm−1, to a lesser extent 1450 cm−1 and 881 cm−1) increase, reflecting ongoing neutralization of the ionic groups. Further information on the order of infrared band changes can be obtained from 2D correlation spectra as described in the data treatment and analysis section. The 2D plots not only provide powerful deconvolution but also allow for a precise comparison of the kinetics, particularly when the normalization is difficult.
Fig. 3 shows the 2D correlation spectra of the second phase. A strong positive cross correlation in the synchronous map at 1054 cm−1 (band seen at ∼1056 cm−1 in the absorbance spectra of Fig. 2 and assigned to both SO3− and SNS− vibrations) with 1346 cm−1 and 1087 cm−1 shows that the band at 1054 cm−1 changes in the same direction as the bands corresponding to the SO2 vibrations of the ionic sulfonyl imide groups. In addition, a strong negative cross-peak of 1054 cm−1 with 1439 cm−1 and a shoulder at 1450 cm−1 agree with the increase of corresponding acidic bands. The absence of a positive or a negative cross-peak at 1054 × 1439 cm−1 in the asynchronous map (Fig. 3B and for an enlarged view Fig. 3D) demonstrates that the intensity loss at 1054 cm−1 and the intensity gain at 1439 cm−1 follow the same time course whereas the appearance of the 1450 cm−1 shoulder is slightly delayed (negative asynchronous cross-peak). The bands at 1346 cm−1 (Fig. 3D) and 1086 cm−1 (Fig. 3C) also lose intensity at the same rate (zero cross-correlation in the asynchronous plot) as the 1054 cm−1 mode. The above findings and also the absence of any synchronous cross-correlation between 1054 cm−1 and the band near 1421 cm−1 (assigned to vibration of the acidic sulfonate groups) confirm that the decrease of the ∼1054 cm−1 band during this phase correlates with the formation of the acidic sulfonyl imide group and not with neutralization of the terminal SO3−. The strong correlation of the band at 1439 cm−1 with 1054 cm−1 is also in agreement with the earlier assignment of 1439 cm−1 to the antisymmetric SO stretch of the acidic sulfonyl imide group.54
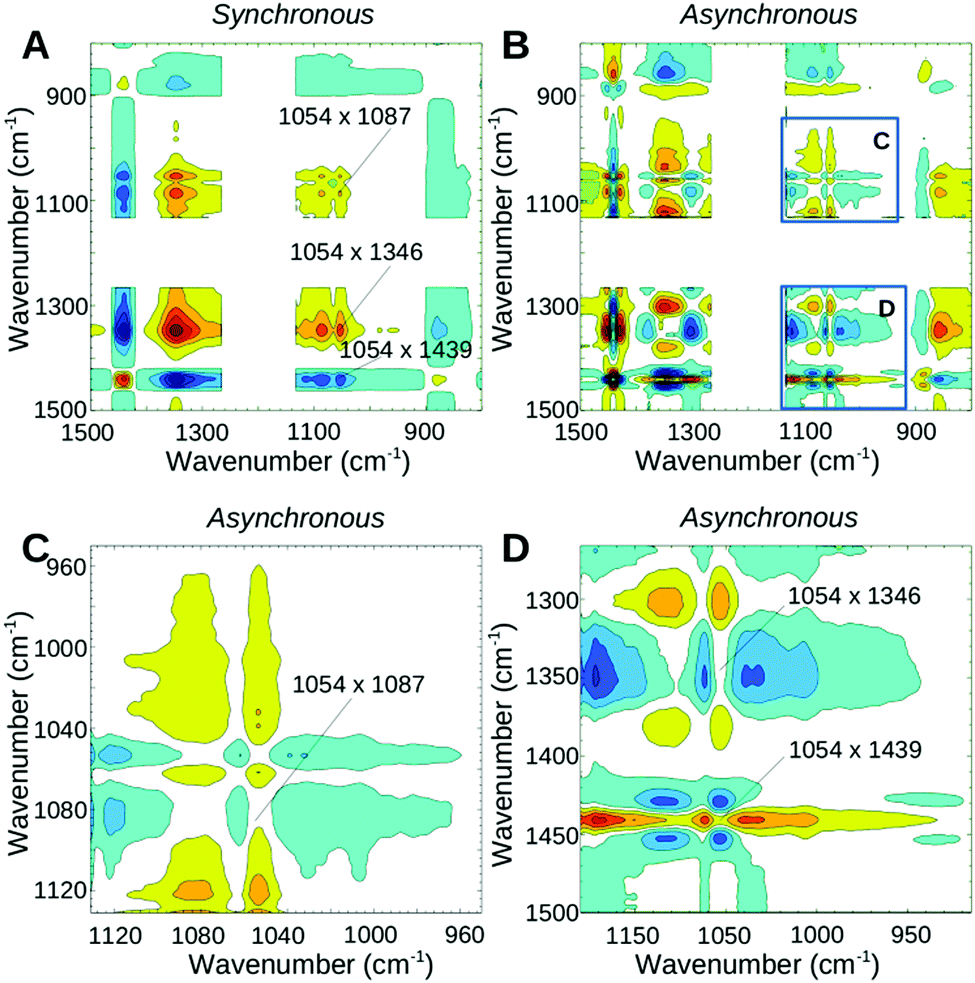 | ||
| Fig. 3 2D correlation maps of the dehydration process of phase II, measured from ∼9 to ∼12 min after start of the heating, primarily showing neutralization of the sulfonyl imide group. Yellow/red colours indicate positive peaks while cyan/blue colours represent negative peaks. (A) Synchronous map; (B) asynchronous map; (C and D) for clarity, two regions of the asynchronous map (as indicated in B) were enlarged. | ||
The water molecules and hydrated hydronium ions that are still present in this phase (see blue/green spectra of the absorbance plot in Fig. 2) are expected to be involved in hydrogen bonded networks with the still ionized SO3− groups and/or the SO groups of the acidic bis(sulfonyl imide). Based on theoretical calculations, several configurations of hydrogen bonded structures were reported in ionomers having multiple acidic sites per side chains.27 For 3M PFIA the first proton dissociation was reported with only three water molecules in the lowest energy structure where the ionic sulfonate group is hydrogen bonded (via hydronium ion and two water molecules) to the SO group of the un-dissociated bis(sulfonyl imide group). Since hydrogen bonding causes a downshift of the corresponding SO stretching mode,64 the strong 1439 cm−1 peak in this phase is most likely due to the SO mode hydrogen-bonded in a structure as reported by Clark et al.,27 whereas the 1450 cm−1 shoulder is caused by a similar, but weakly or non-hydrogen bonded SO mode. By the end of this phase (∼12–15 min after start of heating), no further increase of the 1439 cm−1 band was observed while the bands at 1086 and 1346 cm−1 had (almost) completely disappeared, demonstrating that the majority of the SNS− groups have already been neutralized.
The third measurement phase starting ∼13 min (corresponding to 150 °C) after the onset of heating shows the final decrease of all water modes. The band in the region of SO3− and SNS− vibrations previously seen at 1054 cm−1 now appears at 1060 cm−1 still with a reasonable intensity. It undergoes a further decrease until it completely vanishes when the sample is fully dehydrated. The synchronous map in Fig. 4A reveals the strong correlation of 1060 cm−1 with an increase of the higher wavenumber portion of the doublet acidic peak at 1450 cm−1 and an increase of the broad shoulder peak at ∼1420 cm−1. Cross-peaks of 1060 cm−1 with 1343 cm−1 and 1086 cm−1 are not observed during this phase, suggesting that all the changes of 1060 cm−1 are now due to neutralization of the ionic SO3− groups. The asynchronous plot (Fig. 4B and D) suggests that the higher wavenumber part of the acidic band at 1450 cm−1 occurring slightly faster than the SO3− band decreases (1060 cm−1) whereas the lower portion at 1439 cm−1 decreases at a similar (or slightly slower) timescale. Positive cross-peaks at 1439 and 1450 cm−1 in both synchronous and asynchronous plots confirm that the 1450 cm−1 band change is faster than the 1439 cm−1 change. It is likely that under high temperature conditions other intermediate structures are also present where water molecules or hydronium ions are hydrogen bonded either to the SO3− group prior to its neutralization, or to the SO groups of the bis-sulfonyl imide.27 However, since the minimum energy structure is reported for the connection of SO3− to the sulfonyl imide, the other intermediate structures are expected to disappear first. This effect may be responsible for the faster kinetics of the appearance of the 1450 cm−1 peak.
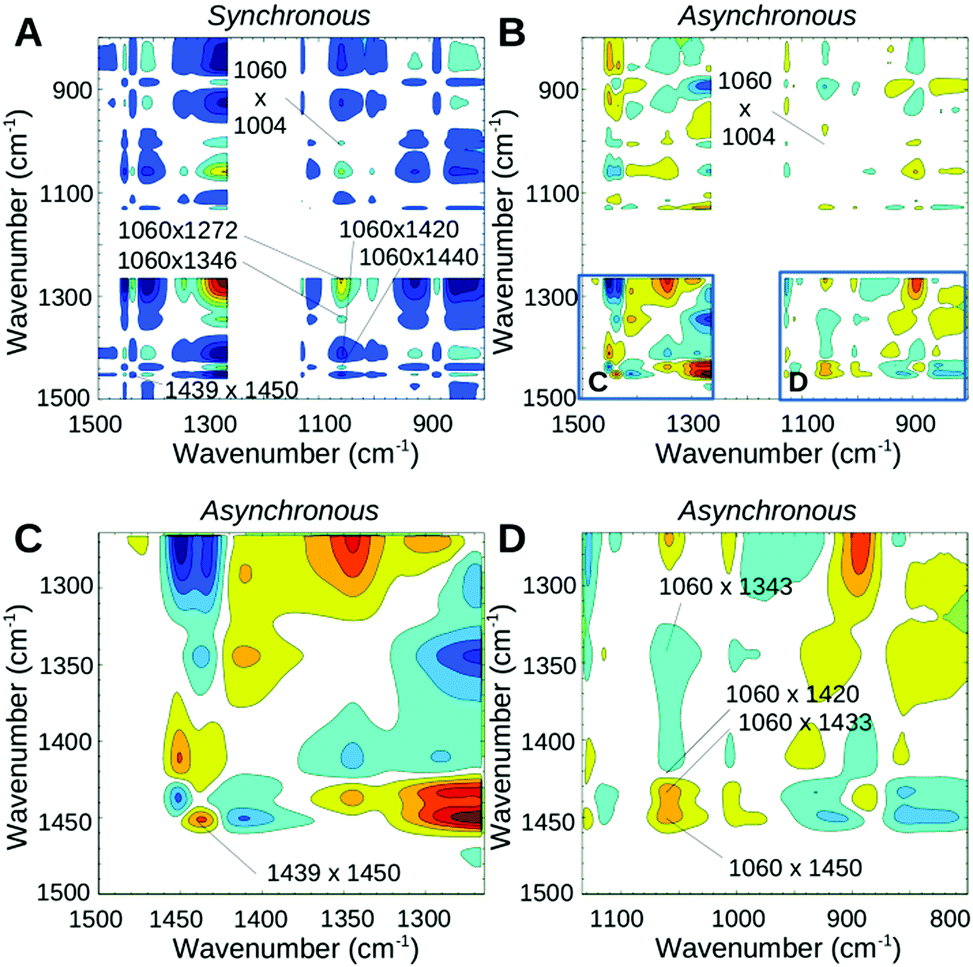 | ||
| Fig. 4 2D correlation maps of phase III of the dehydration process, measured from ∼15 to ∼25 min after start of the heating. (A) Synchronous map; (B) asynchronous map; (C and D) for clarity, two regions of the asynchronous map (as indicated in B) were enlarged. | ||
The data presented here support the following reaction model for the 3M PFIA during heat-induced dehydration:
O groups of the acidic sulfonyl imide, as reflected by the strong 1440 cm−1 band. Other, less abundant configurations where the oxygen is less hydrogen bonded are indicated by the up shifted shoulder at 1450 cm−1.
O vibrations of the acidic sulfonyl imide group from ∼1439 to 1450 cm−1.
A summary of the band assignments for PFIA is given in Table 1.
| Band position (cm−1) | Assignment | Literaturea |
|---|---|---|
| a As used in the text, based on the experimental and theoretical works on similar systems. | ||
| ∼3200–3400 | Water OH str. | 26, 56, 60 and 61 |
| 3228 | NH str. of the HSNS group | 53 and 54 |
| ∼2800 | OH str. of H3O+, H-bonded to SO3− + CF2–O–CF2 | 26 |
| ∼1734 | Hydrated H3O+ | 24, 26 and 63 |
| ∼1635 | Water HOH bend | 26, 60 and 61 |
| 1450 | Asym. SO of the HSNS group |
53 and 54 |
| 1439 | Asym. SO of the HSNS group, H-bonded |
53 and 54 |
| 1421 | Asym. SO of the SO3H |
34 and 58 |
| 1346 | Asym. SO2 str. of the SNS− | 53 and 54 |
| 1285 | Asym. SO3− str. | 53, 55 and 56 |
| 1275–1100 | Asym. and sym. CF str. from CF2 | 31, 32 and 47 |
| 1087 | Sym. SO2 str. of the SNS− | 53 and 54 |
| 1063 | Asym. SNS str. of the SNS− | 53 and 54 |
| 1054 | Sym. SO3− str. | 23, 31 and 49–52 |
| 987 | Sym. COC str. | 23 and 58 |
| 933 | S–O of the of the SO3H | 23 and 59 |
| 868 | Asym. SNS str. of the HSNS | 54 |
| 651 | SNS bend of the SNS− | 54 |
Comparison to NAFION™ membranes
For comparison studies, the dynamics of the rehydration process from hot and dehydrated PFIA and NAFION™ membrane samples were investigated. A non-flowing vapor environment of 30% RH was used to ensure slow water uptake (low RH of the films in the initial stages of rehydration) and allow a more detailed kinetics study. Analogous to the dehydration, singular value decomposition (SVD) and rotational analysis identified several phases. For each of the phases, difference spectra were calculated by subtracting the first spectrum of a corresponding spectral dataset by all the subsequent spectra of the same dataset. This provided a better visibility of the humidity induced changes.Fig. 5 shows the difference spectra of PFIA (left column) and NAFION™ membranes (right column) for three time-windows. While during the first phase (A, B) the temperature was still decreasing, it stabilized at 35 °C prior to the second (C, D) and third phase (E, F). For both materials, the first phase shows water uptake under very low humidity conditions and the beginning of ionization of the sulfonate groups (1060 cm−1). Water molecules are incorporated into a very strong hydrogen bonded environment (or directly hydrogen bonded to the functional groups) as seen from the strong broad bands at 2600–2800 cm−1.
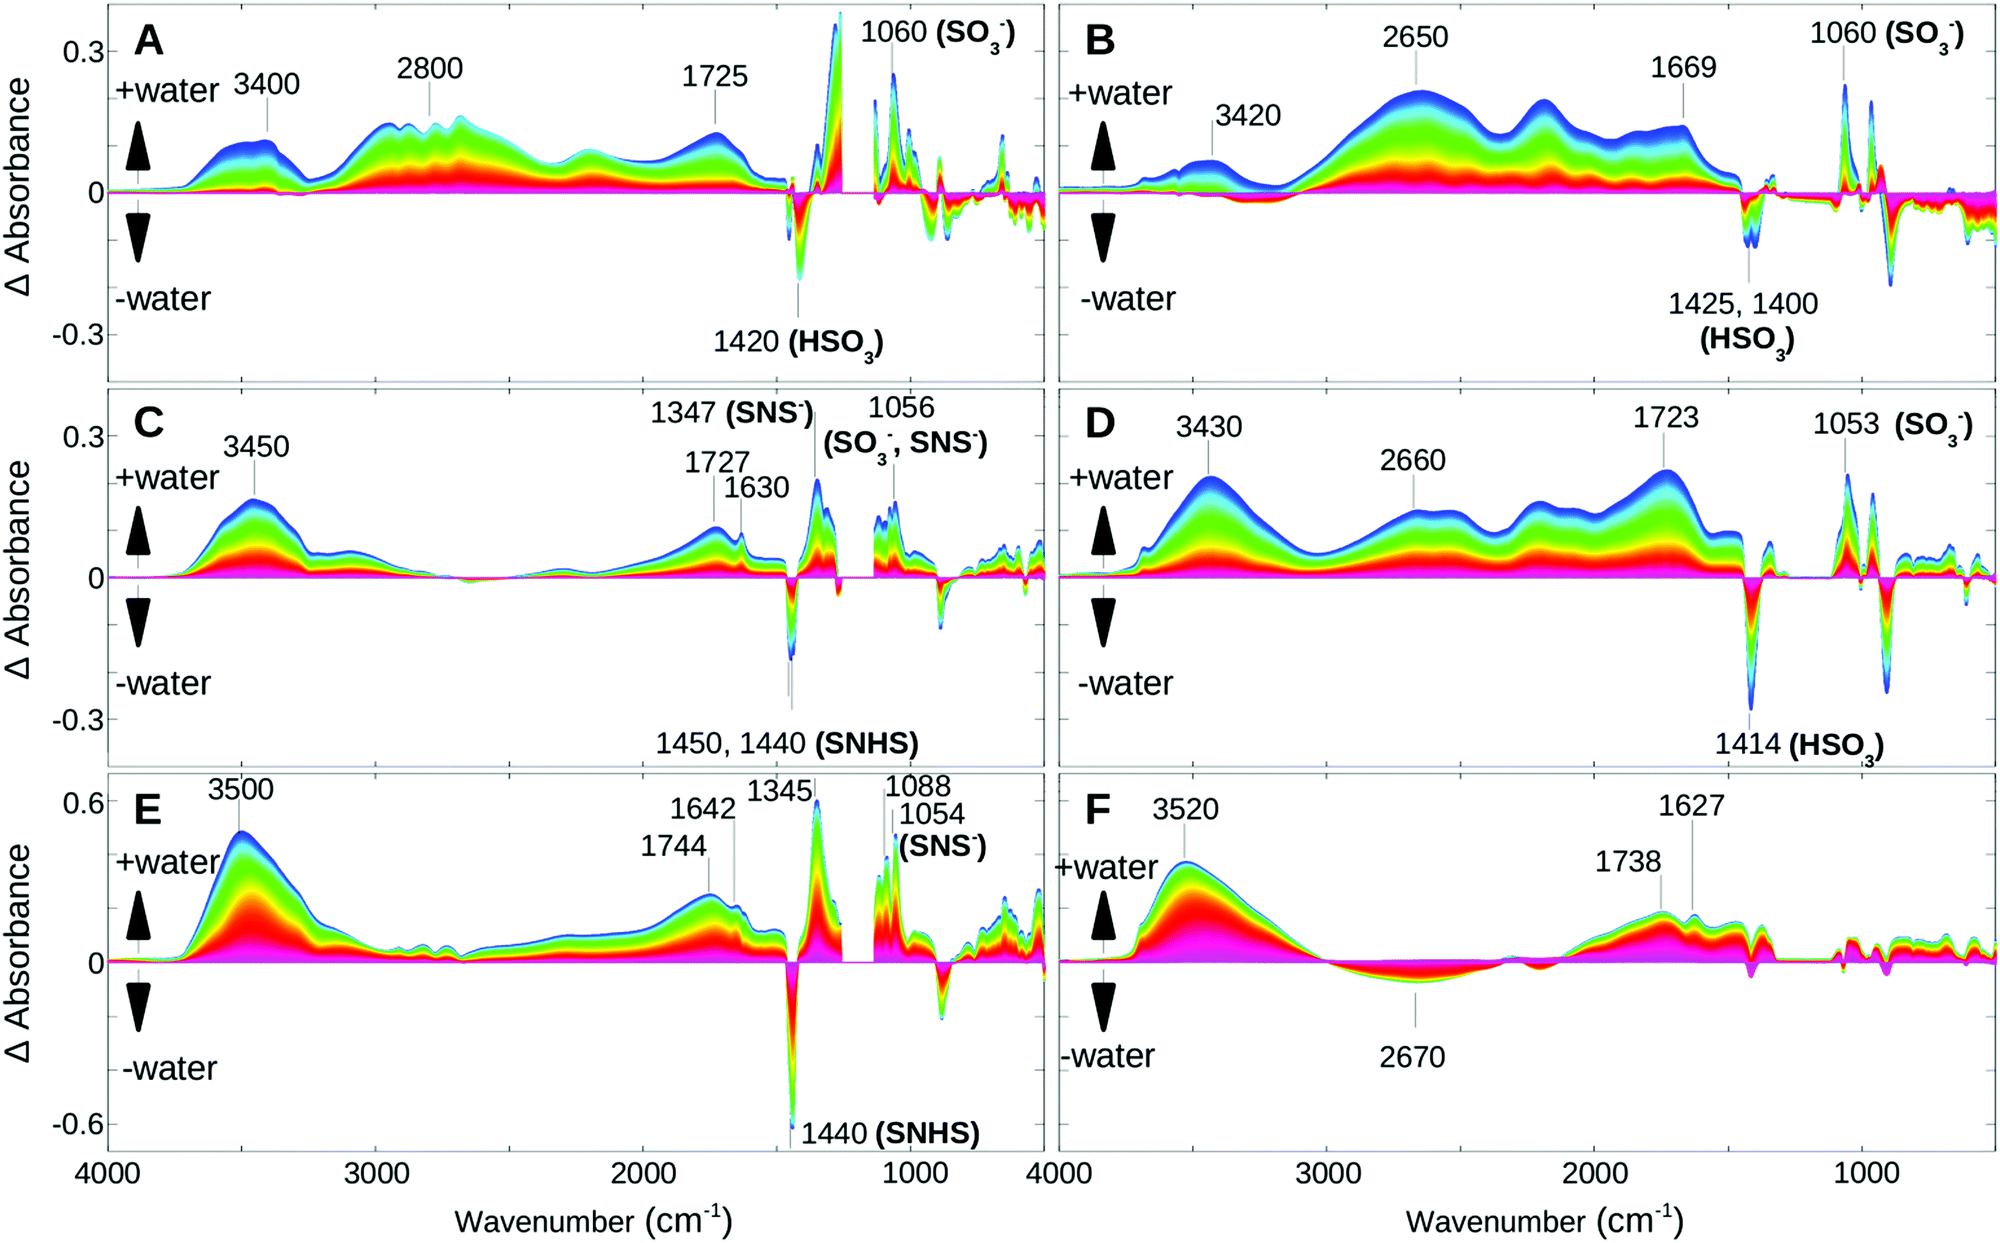 | ||
| Fig. 5 Time-dependent difference spectra of rehydration of PFIA (left) and NAFION™ (right) at 30% RH, measured during three different time windows. Difference spectra were calculated set-wise; the first spectrum of a given set is subtracted from each spectrum of that set. Negative bands correspond to bands of the less hydrated state, while positive bands correspond to bands that appear upon hydration. Red colors represent spectra measured early during the given time window, while blue colors correspond to spectra measured at a later stage. Marker bands of the sulfonate in its ionic or acidic forms (SO3−, HSO3) and the sulfonyl imide (SNS−, SNHS), the latter also including the SO modes of the SNS group, are indicated. (A) PFIA, 50–180 min; (B) NAFION™, 50–180 min; (C) PFIA, 180–270 min; (D) NAFION™, 180–270 min; (E) PFIA, 270–600 min; (F) NAFION™, 270–600 min. (A) and (B) Correspond to a temperature decrease from ∼80 °C to 35 °C, while (C), (D), (E) and (F) were measured at a constant temperature of 35 °C. | ||
In the second phase both films continue with further water uptake under low humidity conditions. Within the early stage of this time window PFIA completes ionization of the sulfonate groups and begins some ionization of the sulfonyl imide groups, shown by the corresponding intensity changes of the 1450 and 1440 cm−1 bands (Fig. 5C) as described earlier in the text for the dehydration process. In NAFION™, however, all the acidic sites are completely ionized by the end of this phase, which is confirmed by the missing SO3− and SO3H bands in the difference spectra of the following phase. In PFIA during the second phase the 1630 cm−1 band appears as a clearly visible sharp band near the broad Zundel band at 1727 cm−1 indicating an increased contribution from the bending vibrations of bulk water molecules.26,32 Further support comes from the strong positive cross correlations of these two bands (Fig. 6A) in the synchronous 2D correlation spectra of PFIA. In addition, the asynchronous map (Fig. 6B) shows the formation of larger water clusters (1630 cm−1 band) developing faster than the changes in the 1730 cm−1 band. In contrast, NAFION™ only shows the broad 1723 cm−1 band under the same conditions (Fig. 5D). 1630 cm−1 was not resolved even with the 2D correlation maps (Fig. 6C and D) suggesting that no (or very few) larger water clusters being present in this phase. Instead, a broad band at around 2660 cm−1 in NAFION™ shows the strong hydrogen bonding to the sulfonate groups.
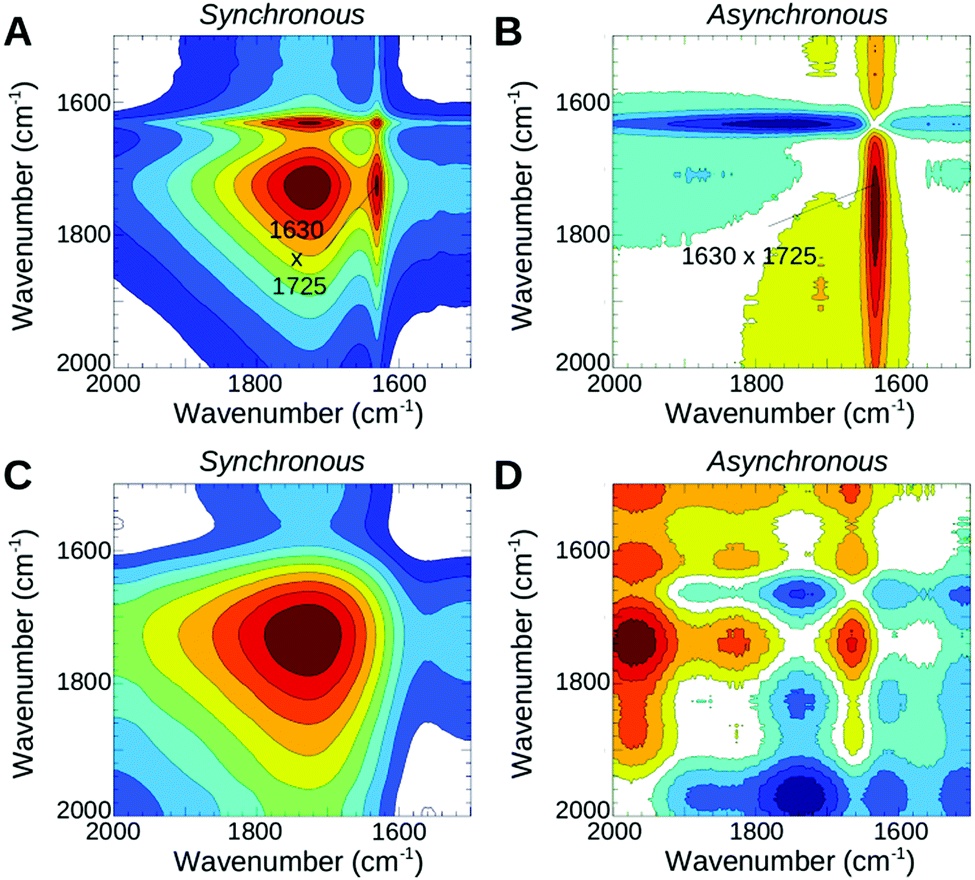 | ||
| Fig. 6 2D correlation maps of the rehydration process of PFIA and NAFION™, measured from ∼180 to ∼270 min after the heater was switched off. (A and B) Synchronous and asynchronous maps of 3M PFIA; (C and D) synchronous and asynchronous maps of NAFION™. The maps show the correlation of the HOH bending mode at 1630 cm−1 with the H2O+ mode at 1725 cm−1. | ||
In the third phase of rehydration (Fig. 5E and F) where the films are now at a high humidity state, both films show a strong increase in the ∼3500 and ∼1640 cm−1 bands. In PFIA further ionization of the sulfonyl imide groups, indicated by strong features at 1440 (−), 1346 (+), 1087 (+), 1056 cm−1 (+) bands in the fingerprint region, offers additional protons for transport. In contrast, all the acidic sites have already been ionized in NAFION™, the broad band at around 2670 cm−1 vanishes to the benefit of a band at 3520 cm−1 with a clear isosbestic point at 3009 cm−1.
In NAFION™ more efficient proton conductivity at higher RH was associated with the existence of larger water clusters in the central region of the ion channels through which proton mobility is fast.18,31 However at lower humidity states, the slower surface mechanism becomes a predominant transport mechanism which is found to be considerably less efficient.18,21
Our rehydration data show that under low humidity conditions as seen during the 2nd phase, the water molecules incorporated into PFIA exist in a state more similar to bulk water than in NAFION™ under similar conditions. The more efficient Grotthuss diffusion would be favored in PFIA, whereas in NAFION™ membranes under the low humidity conditions the proton transfer would be mostly via the surface diffusion mechanism.
Conclusions
FTIR spectroscopy was applied to study the temperature-induced dehydration and rehydration process of the perfluoroimide acid (PFIA) ionomer having multiple acidic side groups. A comprehensive assignment of the bands in the mid-infrared spectra is presented. By means of statistical analysis and the 2D correlation method, the sequence of molecular events connected to the loss of water is deduced. A dehydration sequence model is proposed as follows: (i) loss of bulk water from the water channels, (ii) neutralization of the sulfonyl imide groups followed by (iii) neutralization of the terminal SO3− groups and formation of a hydrogen bonded network between sulfonic acid and the sulfonyl imide. A comparison with the well-studied NAFION™ membranes shows that under low humidity conditions PFIA is better at both water retention and water uptake. The existence of a “bulk-like” form of water in PFIA at low RH could account for better proton conductivity and a higher portion of a bulk diffusion. NAFION™ shows stronger H bonding with sulfonate groups at low RH thus having the higher portion of proton transport through the surface mechanism.Acknowledgements
E. R. acknowledges support from the German Ministry of Education and Research (BMBF).Notes and references
- Z. Zuo, Y. Fu and A. Manthiram, Polymers, 2012, 4, 1627–1644 CrossRef CAS.
- M. K. Debe, Nature, 2012, 486, 43–51 CrossRef CAS PubMed.
- S. M. J. Zaidi, Polymer Membranes for Fuel Cells, Springer US, Boston, MA, 2009 Search PubMed.
- H. J. M. Hou, Materials, 2011, 4, 1693–1704 CrossRef CAS.
- R. K. Hocking, R. Brimblecombe, L.-Y. Chang, A. Singh, M. H. Cheah, C. Glover, W. H. Casey and L. Spiccia, Nat. Chem., 2011, 3, 461–466 CAS.
- K. Sopian and W. R. Wan Daud, Renewable Energy, 2006, 31, 719–727 CrossRef CAS.
- O. Savadogo, J. Power Sources, 2004, 127, 135–161 CrossRef CAS.
- M. Schaberg, J. Abulu, G. Haugen, M. Emery, S. O'Conner, P. Xiong and S. Hamrock, ECS Trans., 2010, 33, 627–633 CAS.
- C. Houchins, G. Kleen, J. Spendelow, J. Kopasz, D. Peterson, N. Garland, D. Ho, J. Marcinkoski, K. Martin, R. Tyler and D. Papageorgopoulos, Membranes, 2012, 2, 855–878 CrossRef CAS PubMed.
- S. Hamrock and K. E. Martin, DOE Hydrog. Progr., 2010, 748–753 Search PubMed.
- W. Grot, Chem. Ing. Tech., 1978, 50, 299–301 CrossRef CAS.
- K. A. Mauritz and R. B. Moore, Chem. Rev., 2004, 104, 4535–4585 CrossRef CAS PubMed.
- R. Hiesgen, S. Helmly, I. Galm, T. Morawietz, M. Handl and K. A. Friedrich, Membranes, 2012, 2, 783–803 CrossRef CAS PubMed.
- D. B. Spry, A. Goun, K. Glusac, D. E. Moilanen and M. D. Fayer, J. Am. Chem. Soc., 2007, 129, 8122–8130 CrossRef CAS PubMed.
- D. L. Wood, J. Chlistunoff, J. Majewski and R. L. Borup, J. Am. Chem. Soc., 2009, 131, 18096–18104 CrossRef CAS PubMed.
- S. Slade, S. A. Campbell, T. R. Ralph and F. C. Walsh, J. Electrochem. Soc., 2002, 149, A1556 CrossRef CAS.
- L. Ghassemzadeh, M. Marrony, R. Barrera, K. D. Kreuer, J. Maier and K. Müller, J. Power Sources, 2009, 186, 334–338 CrossRef CAS.
- P. Choi, N. H. Jalani and R. Datta, J. Electrochem. Soc., 2005, 152, A1548 CrossRef CAS.
- C. J. T. de Grotthus, Ann. Chim., 1806, 58, 54–73 Search PubMed.
- N. W. DeLuca and Y. A. Elabd, J. Polym. Sci., Part B: Polym. Phys., 2006, 44, 2201–2225 CrossRef CAS.
- M. Phonyiem, S. Chaiwongwattana, C. Lao-ngam and K. Sagarik, Phys. Chem. Chem. Phys., 2011, 13, 10923–10939 RSC.
- G. A. Ludueña, T. D. Kühne and D. Sebastiani, Chem. Mater., 2011, 23, 1424–1429 CrossRef.
- P. C. Rieke and N. E. Vanderborgh, J. Membr. Sci., 1987, 32, 313–328 CrossRef CAS.
- G. Zundel, Advances in Chemical Physics, 2007, pp. 1–217 Search PubMed.
- M. Eigen, Angew. Chem., Int. Ed. Engl., 1964, 3, 1–19 CrossRef.
- R. Buzzoni, S. Bordiga, G. Ricchiardi, G. Spoto and A. Zecchina, J. Phys. Chem., 1995, 99, 11937–11951 CrossRef CAS.
- J. K. Clark II, S. J. Paddison, J. K. Clark, S. J. Paddison, J. K. Clark II and S. J. Paddison, Electrochim. Acta, 2013, 101, 279–292 CrossRef CAS.
- S. J. Hamrock and M. A. Yandrasits, J. Macromol. Sci., Part C: Polym. Rev., 2006, 46, 219–244 CrossRef CAS.
- I. A. Koppei, R. W. Taft, A. S. Zbu, L. Hu, K. Sung, D. D. Desmarteau, L. M. Yagupolskii, Y. L. Yagupolskii, N. V Ignat, V. Kondratenko, Y. Volkonskii, V. M. Vlasov, R. Notario, P. Maria, I. A. Koppel, R. W. Taft, F. Anvia, S.-Z. Zhu, L. Hu, K. Sung, D. D. Desmarteau, L. M. Yagupolskii, Y. L. Yagupolskii, N. V. Ignat'ev, N. V. Kondratenko, A. Y. Volkonskii, V. M. Vlasov, R. Notario and P. Maria, J. Am. Chem. Soc., 1994, 116, 3047–3057 CrossRef.
- D. T. Hallinan and Y. a Elabd, J. Phys. Chem. B, 2009, 113, 4257–4266 CrossRef CAS PubMed.
- K. Kunimatsu, B. Bae, K. Miyatake, H. Uchida and M. Watanabe, J. Phys. Chem. B, 2011, 115, 4315–4321 CrossRef CAS PubMed.
- M. Ludvigsson, J. Lindgren and J. Tegenfeldt, Electrochim. Acta, 2000, 45, 2267–2271 CrossRef CAS.
- S. Liu, A. J. a Aquino and C. Korzeniewski, Langmuir, 2013, 29, 13890–13897 CrossRef CAS PubMed.
- M. Danilczuk, L. Lin, S. Schlick, S. J. Hamrock and M. S. Schaberg, J. Power Sources, 2011, 196, 8216–8224 CrossRef CAS.
- D. T. Hallinan and Y. a Elabd, J. Phys. Chem. B, 2007, 111, 13221–13230 CrossRef CAS PubMed.
- T. A. T. Zawodzinski, M. Neeman, L. O. L. O. Sillerud and S. Gottesfeld, J. Phys. Chem., 1991, 95, 6040–6044 CrossRef CAS.
- T. A. Zawodzinski, T. E. Springer, J. Davey, R. Jestel, C. Lopez, J. Valeria and S. Gottesfeld, J. Am. Chem. Soc., 1993, 140, 5–9 Search PubMed.
- M. Emery, M. Frey, M. Guerra, G. Haugen, K. Hintzer, K. H. Lochhaas, P. Pham, D. Pierpont, M. Schaberg, A. Thaler, M. Yandrasits and S. Hamrock, ECS Trans., 2007, 11, 3–14 CAS.
- J. W. Eaton, D. Bateman, S. Hauberg and R. Wehbring, GNU Octave version 4.0.0 manual: a high-level interactive language for numerical computations, 2015 Search PubMed.
- E. R. Henry and J. Hofrichter, Methods Enzymol., 1992, 210, 129–192 CAS.
- M. Elgeti, E. Ritter and F. J. Bartl, Z. Phys. Chem., 2008, 222, 1117–1129 CrossRef CAS.
- I. Noda, J. Am. Chem. Soc., 1989, 111, 8116–8118 CrossRef CAS.
- I. Noda, Appl. Spectrosc., 1990, 44, 550–561 CrossRef CAS.
- I. Noda, in Handbook of Vibrational Spectroscopy, ed. P. R. Griffiths, John Wiley & Sons, Ltd, Chichester, UK, 2006 Search PubMed.
- T. Pazderka and V. Kopecky Jr, Tech. Comput. Prague, 2008, 978–980 Search PubMed.
- S. Sun, H. Tang, P. Wu and X. Wan, Phys. Chem. Chem. Phys., 2009, 11, 9861 RSC.
- Z. Liang, W. Chen, J. Liu, S. Wang, Z. Zhou, W. Li, G. Sun and Q. Xin, J. Membr. Sci., 2004, 233, 39–44 CrossRef CAS.
- H. R. Zelsmann, J. Mol. Struct., 1995, 350, 95–114 CrossRef CAS.
- C. Heitner-Wirguin, Polymer, 1979, 20, 371–374 CrossRef CAS.
- S. R. Lowry and K. A. Mauritz, J. Am. Chem. Soc., 1980, 102, 4665–4667 CrossRef CAS.
- J. Ostrowska and A. Narebska, Colloid Polym. Sci., 1983, 261, 93–98 CAS.
- G. Xie, T. Okada and T. Arimura, Z. Phys. Chem., 1998, 205, 113–125 CrossRef CAS.
- C. K. Byun, I. Sharif, D. D. Desmarteau, S. E. Creager and C. Korzeniewski, J. Phys. Chem. B, 2009, 113, 6299–6304 CrossRef CAS PubMed.
- I. Rey, P. Johansson, J. Lindgren and J. C. Lasse, J. Phys. Chem. A, 1998, 102, 3249–3258 CrossRef CAS.
- A. Gruger, A. Régis, T. Schmatko and P. Colomban, Vib. Spectrosc., 2001, 26, 215–225 CrossRef CAS.
- M. Laporta, M. Pegoraro and L. Zanderighi, Phys. Chem. Chem. Phys., 1999, 1, 4619–4628 RSC.
- J. Pacansky, M. Miller, W. Hatton, B. Liu and A. Scheiner, J. Am. Chem. Soc., 1991, 113, 329–343 CrossRef CAS.
- K. Feng, L. Hou, B. Tang and P. Wu, Phys. Chem. Chem. Phys., 2015, 17, 9106–9115 RSC.
- D. S. Warren and A. J. McQuillan, J. Phys. Chem. B, 2008, 112, 10535–10543 CrossRef CAS PubMed.
- M. Falk, Can. J. Chem., 1980, 58, 1495–1501 CrossRef CAS.
- J.-B. Brubach, A. Mermet, A. Filabozzi, A. Gerschel and P. Roy, J. Chem. Phys., 2005, 122, 184509 CrossRef PubMed.
- M. Falk, Spectrochim. Acta, Part A, 1984, 40, 43–48 CrossRef.
- E. S. Stoyanov, I. V. Stoyanova and C. A. Reed, Chem. Sci., 2011, 2, 462–472 RSC.
- D. Lin-Vien, N. B. Colthup, W. G. Fateley and J. G. Grasselli, The Handbook of Infrared and Raman Characteristic Frequencies of Organic Molecules, Elsevier, 1991 Search PubMed.
| This journal is © the Owner Societies 2017 |