Pursuing reliable thermal analysis techniques for energetic materials: decomposition kinetics and thermal stability of dihydroxylammonium 5,5′-bistetrazole-1,1′-diolate (TKX-50)†
Nikita V.
Muravyev
*a,
Konstantin A.
Monogarov
a,
Andrey F.
Asachenko
bc,
Mikhail S.
Nechaev
 bcd,
Ivan V.
Ananyev
e,
Igor V.
Fomenkov
b,
Vitaly G.
Kiselev
fg and
Alla N.
Pivkina
a
aSemenov Institute of Chemical Physics RAS, 4, Kosygina Str., 119991 Moscow, Russia. E-mail: n.v.muravyev@ya.ru; Fax: +7 4991378203; Tel: +7 4991378203
bZelinsky Institute of Organic Chemistry RAS, 47, Leninsky Ave., 119991 Moscow, Russia
cTopchiev Institute of Petrochemical Synthesis RAS, 29, Leninsky Ave., 119991 Moscow, Russia
dLomonosov Moscow State University, Department of Chemistry, 1/3, Leninskiye Gory, 119991 Moscow, Russia
eNesmeyanov Institute of Organoelement Compounds RAS, 28, Vavilova Str., 119991 Moscow, Russia
fNovosibirsk State University, 2, Pirogova Str., 630090 Novosibirsk, Russia
gInstitute of Chemical Kinetics and Combustion SB RAS, 3, Institutskaya Str., 630090 Novosibirsk, Russia
First published on 10th November 2016
Abstract
Thermal decomposition of a novel promising high-performance explosive dihydroxylammonium 5,5′-bistetrazole-1,1′-diolate (TKX-50) was studied using a number of thermal analysis techniques (thermogravimetry, differential scanning calorimetry, and accelerating rate calorimetry, ARC). To obtain more comprehensive insight into the kinetics and mechanism of TKX-50 decomposition, a variety of complementary thermoanalytical experiments were performed under various conditions. Non-isothermal and isothermal kinetics were obtained at both atmospheric and low (up to 0.3 Torr) pressures. The gas products of thermolysis were detected in situ using IR spectroscopy, and the structure of solid-state decomposition products was determined by X-ray diffraction and scanning electron microscopy. Diammonium 5,5′-bistetrazole-1,1′-diolate (ABTOX) was directly identified to be the most important intermediate of the decomposition process. The important role of bistetrazole diol (BTO) in the mechanism of TKX-50 decomposition was also rationalized by thermolysis experiments with mixtures of TKX-50 and BTO. Several widely used thermoanalytical data processing techniques (Kissinger, isoconversional, formal kinetic approaches, etc.) were independently benchmarked against the ARC data, which are more germane to the real storage and application conditions of energetic materials. Our study revealed that none of the Arrhenius parameters reported before can properly describe the complex two-stage decomposition process of TKX-50. In contrast, we showed the superior performance of the isoconversional methods combined with isothermal measurements, which yielded the most reliable kinetic parameters of TKX-50 thermolysis. In contrast with the existing reports, the thermal stability of TKX-50 was determined in the ARC experiments to be lower than that of hexogen, but close to that of hexanitrohexaazaisowurtzitane (CL-20).
1. Introduction
The development of high-performance explosives with good thermal stability, moderate sensitivity to external stimuli, and low environmental pollution is a subject of intense ongoing research worldwide. Nitrogen-rich heterocycles and their derivatives have recently attracted considerable attention as promising environmentally friendly energetic compounds.1–19 In contrast to “conventional” energetic materials producing energy by oxidation of the carbon backbone, strained high-N heterocycles release great amounts of energy in very exothermal decomposition reactions yielding thermodynamically favorable molecular nitrogen.20–22 Among a huge variety of various heterocyclic species, tetrazole N-oxides are of significant interest for high-energy applications due to beneficial combination of their properties. For example, they combine high enthalpies of formation, good oxygen balance and high densities due to the presence of N → O moieties.22 Significant efforts are being made toward the synthesis of various N-oxide derivatives and the design of efficient combination of various explosophoric moieties in energetic salts.23–33Dihydroxylammonium 5,5′-bistetrazole-1,1′-diolate (TKX-50, Chart 1), first synthesized in 2012,34 is among the most promising novel energetic compounds. On the basis of computational estimations, TKX-50 was proposed to be superior in terms of explosive performance to hexanitrohexaazaisowurtzitane (CL-20), the most energetic compound among the commonly used ones. Namely, the detonation velocity of TKX-50 was calculated to be 9.70 km s−1 (cf. 9.45 km s−1 in the case of CL-20).34 The density of TKX-50 (1.88 g cm−3 at room temperature) is comparable to that of octogen (1.90 g cm−3) and slightly lower than that of CL-20 (2.04 g cm−3).34 However, its moderate impact sensitivity (∼20 J, which is profoundly better than the corresponding values of octogen, hexogen, and CL-20), low toxicity, and simple and easily scalable synthetic procedure (in comparison with that of CL-20) render TKX-50 very attractive for potential applications.34 Notable efforts have also been made toward the design of simple scalable synthetic procedures, evaluation of compatibility, and more efficient formulations of TKX-50 with energetic binders.35,36
One of the most important properties of energetic materials is their thermal stability. Thus, knowledge of the kinetics and mechanism of thermolysis of new compounds is crucial for storage and compatibility issues and, more generally, for a proper understanding of their chemistry. However, even though the thermal decomposition of TKX-50 has been intensively studied experimentally and theoretically, both the kinetics and mechanism of initial stages of thermolysis still remain unclear. Note that differential scanning calorimetry (DSC) and thermogravimetry/differential thermal analysis (TGA/DTA) measurements performed by several independent groups yielded profoundly different results. Namely, on the basis of DSC measurements (503–553 K), Yang et al.37 estimated the average Arrhenius parameters of the primary stage of TKX-50 decomposition to be Ea = 237.6 kJ mol−1 and log(A/s−1) = 23.9. On the other hand, from similar DSC experiments Fischer et al.38 found the average Arrhenius parameters to be Ea = 143.2 kJ mol−1 and log(A/s−1) = 12.2. All the above-mentioned values were obtained using the Kissinger method.
Finally, very recently Sinditskii et al.39 have obtained similar Arrhenius parameters of non-isothermal DSC kinetics Ea = 156.6 kJ mol−1 and log(A/s−1) = 13.7. Nevertheless, on the basis of isothermal manometric measurements (443–473 K), the same group proposed an autocatalytic kinetic scheme with the Arrhenius parameters of the first and second stages Ea = 166.9 kJ mol−1, log(A/s−1) = 13.8 and Ea = 190.0 kJ mol−1, log(A/s−1) = 18.1, respectively.39 The authors39 also analyzed the condensed products of TKX-50 decomposition using IR spectroscopy and proposed the diammonium salt of the same anion (ABTOX, Chart 1)13 to be the most abundant primary product. Thermolysis of TKX-50 was speculated to occur via the dissociation to neutral precursors, hydroxylamine and 1,1′-bistetrazole diol (BTO, Chart 1).39
It is also worth mentioning that quantum chemical calculations (DFT) along with molecular dynamics (MD) simulations were employed to study the initial reactions of TKX-50 thermolysis.40 The sequential proton transfer from hydroxylamine to the bistetrazole moiety was found to be the initial thermal process occurring in the MD simulations. This finding agrees well with the results of Sinditskii et al.39 In turn, the N2 elimination reaction was predicted to dominate the subsequent decomposition of the bistetrazole moiety, and the activation barrier of this reaction decreased upon sequential proton transfer from the cation to the anion moiety. The lowest activation barrier of N2 elimination was predicted to be 151.9 kJ mol−1 (at the B3LYP level of theory) for the neutral BTO species.40 It should be emphasized that the decomposition of neutral hydroxylamine (NH2OH) occurred at higher temperatures than that of BTO even at tremendously high heating rates (180 K per picosecond) employed in the MD simulations.40 Given the well-established poor thermal stability of NH2OH,41 this issue remains unclear.
Apart from this, very recently, decomposition of TKX-50 from excited electronic states has been studied experimentally and theoretically (at the CASSCF level), and the ˙NO radical and molecular nitrogen were found to be the most abundant primary products.42
It is seen that the existing experimental data on the primary reactions of the thermal decomposition of TKX-50 are incomplete and to some extent contradictory.37–39 Since the distribution of the primary reaction products is almost lacking, the proposed mechanisms39,40 were not rationalized with sufficient experimental evidence. Moreover, the existing estimations of the activation barriers and rate constants of the elementary reactions are based exclusively either on the non-isothermal kinetics of a sample weight loss or on the rate of the sample gas evolution. Unfortunately, the correct processing and interpretation of results of TGA and DSC experiments in the case of energetic materials are under no circumstances a trivial problem. Note that the thermal decomposition of energetic species typically comprises several stages, which are not kinetically independent. At the same time, the choice of the correct thermokinetic model is crucial for obtaining physically meaningful kinetic parameters and, ultimately, their reliable extrapolation beyond the range of temperatures and heating rates of a particular experiment.43 Moreover, in the case of solid-state systems, the results of TGA and DSC decomposition experiments, apart from the chemistry per se, can be subject to various complex factors, e.g., processes at the reaction interface, nucleation and crystal growth of the solid product and diffusion removal of the gaseous product, mass- and heat-transfer limitations, etc.44
Therefore, the main goals of the present contribution were to obtain the robust kinetic parameters of TKX-50 decomposition, identify the products of primary thermolysis reactions, and, eventually, obtain insights into the kinetics and mechanism of the primary stages of TKX-50 thermal decomposition. To this end, we employed a variety of the most sophisticated kinetic instruments (viz., DSC, TGA, and accelerating rate calorimetry, ARC) under various experimental conditions (isothermal/non-isothermal conditions and normal and low pressures of the inert gas). Apart from this, we carefully analyzed various procedures of raw thermokinetic data processing: viz., the Kissinger method (ASTM E698), differential isoconversional (Friedman), integral isoconversional (Ozawa–Flynn–Wall, Vyazovkin methods), and formal kinetic methods.43 We clearly showed that the widely employed Kissinger method43 and the kinetic deconvolution procedure45 are not applicable in the present case. As an additional benchmarking tool to verify the reliability of the obtained kinetics, we calculated the self-heating of the TKX-50 sample under adiabatic conditions using the kinetic models obtained from DSC/TGA measurements. These data were compared with the direct experimental results obtained by ARC calorimetry. Moreover, to obtain more comprehensive experimental evidence, we also studied the thermolysis of BTO and its mixtures with TKX-50. In contrast to all previous studies, we paid particular attention to the correct interpretation of thermal analysis data and providing convincing evidence for the proposed reaction mechanisms (including direct detection of intermediates) and kinetic models employed.
2. Experimental and computational methods
2.1. Synthesis
5,5′-Bistetrazole-1,1′-diolate (TKX-50) was synthesized from dichloroglyoxime and sodium azide in N-methyl-2-pyrrolidone with the yield of 79% in accordance with a technique described elsewhere.34 The synthesized crystalline TKX-50 is comprised of elongated crystals with a smooth surface with the length of about 250 μm and thickness of 50–100 μm (cf. the scanning electron microscopy images in Fig. S3, ESI†). 1H,1′H-5,5′-bistetrazole-1,1′-diol (BTO) dihydrate was prepared in accordance with the literature procedure.13 The purity of the obtained species was confirmed to be higher than 99% by 13C NMR (2,6-di-tert-butyl-4-methyl-phenol was used as an internal standard).2.2. Instruments
Thermal behavior of the species under study was investigated with a STA449 F3 (Netzsch) thermal analyzer in both isothermal and non-isothermal modes. The non-isothermal TGA experiments were performed under argon flow (70 ml min−1) at a constant heating rate 10 K min−1 from room temperature to 1273 K. The samples of about 1 mg weight were placed in alumina pans covered with pierced lids. Isothermal TGA measurements were performed with larger samples of about 50 mg, the powder was put in open alumina crucibles of 0.3 ml volume. Note that such a high sample weight was chosen to obtain an appropriate signal-to-noise ratio in long isothermal experiments accompanied by a moderate mass loss rate. The evolved gas products were detected by means of an in-line FTIR spectrometer (Alpha, Bruker, spectral resolution 4 cm−1) simultaneously with TGA/DSC measurements. Non-isothermal DSC measurements were performed with the DSC 204 HP apparatus (Netzsch) at heating rates of 0.5, 1, 2, 5, 10, 20, and 40 K min−1 under a nitrogen flow of 100 ml min−1. Samples of 0.30 ± 0.04 and 1.01 ± 0.06 mg weight placed in aluminum pans covered with pierced lids were used. To study the thermal stability of the species under adiabatic conditions, the accelerating rate calorimeter MMC 274 Nexus (Netzsch) was used. The standard “heat–wait–search” procedure46 was employed for TKX-50 samples of 100–250 mg placed into titanium containers ARCTC Ti-LBQ. The initial temperature for the “heat–wait–search” program was chosen to be 393 K with a temperature step of 4 K. A scanning electron microscope (Helios NanoLab™ 660, FEI) was used to study the morphology of the condensed products of thermolysis. The SEM samples were prepared by the focused ion beam (FIB) technique. 1H and 13C NMR spectra were recorded using AVANCE III Bruker 600 and AVANCE III Bruker 150 instruments. The structures of several compounds were studied using single crystal X-ray diffraction analysis. Suitable single-crystals were placed in a Bruker Apex 2K CCD diffractometer equipped with an X-ray source using graphite-monochromated Mo-Kα radiation (λ = 0.71073 Å). The structures were solved using the direct methods of the difference Fourier synthesis and were further refined by the full-matrix least-squares method using the APEX 2 and CELL NOW program packages.47 The positions of hydrogen atoms were calculated geometrically and refined in the framework of rigid body approximation (riding model). The crystallographic data and the details of the final refinement are given in the ESI† (Section S2).2.3. Processing of raw thermochemical data
A number of various techniques were employed to extract the kinetic parameters from the raw DSC and TGA data. These procedures use the dependence of reaction rate on temperature T (which, in turn, depends on time via a predefined, typically linear, time program T = T(t)) and the conversion degree α: | (1) |
![[thin space (1/6-em)]](https://www.rsc.org/images/entities/char_2009.gif) exp(−Ea/RT), and f(α) corresponds to a kinetic model (e.g., f(α) = 1 − α for the first-order reaction). The conversion degree α was determined experimentally as a ratio of the integral mass loss at a particular time to the total mass loss in the case of TGA data, and as a ratio of heat released at a particular time moment to the total heat released in the case of DSC. In the isothermal experiments the end point α = 1 corresponded to the mass-loss rate that is lower than a threshold value for a given period of time. Note that the reaction progress in the solid-state kinetics is typically described in terms of conversion degree, not concentration, due to the heterogeneous nature of the processes occurring.
exp(−Ea/RT), and f(α) corresponds to a kinetic model (e.g., f(α) = 1 − α for the first-order reaction). The conversion degree α was determined experimentally as a ratio of the integral mass loss at a particular time to the total mass loss in the case of TGA data, and as a ratio of heat released at a particular time moment to the total heat released in the case of DSC. In the isothermal experiments the end point α = 1 corresponded to the mass-loss rate that is lower than a threshold value for a given period of time. Note that the reaction progress in the solid-state kinetics is typically described in terms of conversion degree, not concentration, due to the heterogeneous nature of the processes occurring.
The Kissinger method allows obtaining solely the activation energy Ea without any a priori knowledge of the reaction model f(α). Note, however, that the model is not arbitrary, but must satisfy the assumption of the same extent of reaction (conversion degree) at a maximum rate (typically, at the DSC peak). In the framework of this method, Ea is obtained from a series of experiments at various heating rates β using the following relation between β and the temperature Tp of the maximum on a DSC curve:48
 | (2) |
The more sophisticated isoconversional methods allow obtaining the effective activation energy Ea as a function of the conversion degree α. Similarly to the case of the Kissinger method, the a priori knowledge on the reaction model f(α) is not necessary. In the current work, we employed three isoconversional techniques, viz., Friedman, Ozawa–Flynn–Wall, and Vyazovkin methods.43 The Friedman method (FM) is a typical differential isoconversional method, where the effective Arrhenius parameters A and Ea(α) are derived at various conversion degrees from a series of measurements:
 | (3) |
In contrast to differential methods, the integral isoconversional techniques are based on the integral form of the kinetic equation, eqn (1):
 | (4) |
All numerical calculations in this work were performed using two software packages: viz., Netzsch Thermokinetics49 and a self-developed code THINKS.50
2.4. Modeling of temperature evolution of the sample
The thermal behavior of the samples was modeled using the static heat balance equation:51 | (5) |
 | (6) |
3. Results and discussion
3.1. Global kinetics of thermal decomposition of TKX-50 under non-isothermal conditions: insufficiency of Kissinger and Ozawa methods
As the first step of our studies of TKX-50 thermal decomposition, we used the conventional techniques of thermal analysis: viz., non-isothermal differential scanning calorimetry (DSC) and thermogravimetry (TGA). Fig. 1 presents the typical TGA/DSC curves for the title species recorded at a heating rate of 10 K min−1 (the full set of DSC curves in the whole range of heating rates employed is shown in Fig. S5, Section S4a, ESI†). In good agreement with previously reported results,38 the two exothermic peaks at 516 and 546 K were observed on the DSC curve (Fig. 1). The average heat effect of TKX-50 decomposition in the aluminum pans covered with pierced lids is 2320 ± 190 J g−1, which is comparable with the corresponding values of octogen (1600 J g−1), hexogen (2100 J g−1) and CL-20 (2600 J g−1) obtained under the same conditions. Indeed, this fact agrees well with the proposed high-energy nature of the species studied.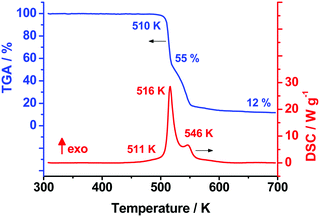 | ||
| Fig. 1 Differential scanning calorimetry (red) and thermogravimetry curves (blue) of the TKX-50 sample of 1 mg at a heating rate 10 K min−1. | ||
In order to compare our data with previously reported results,37–39,53 we have processed experimental DSC curves obtained at various heating rates (0.5–20 K min−1) by means of the widely used Kissinger method (specified in the ASTM E698 standard).48 The obtained Arrhenius parameters of the rate constant are presented in Table 1. It is clearly seen from Table 1 that our values (first line, dataset #1) perfectly reproduce the results of Fischer et al. obtained under the same experimental conditions.38 However, there are several issues worthy of discussion at this point. First, it is seen that the amplitude of the first DSC peak is higher than 25 mW (Fig. 1 and Table 1), while the ASTM E698 standard suggests the maximum amplitude of DSC signal to be less than 8 mW.48 Moreover, in the case of simple polymers the product of heating rate and sample mass was recommended to be less than 100 mg K min−1.54 The energetic species TKX-50 liberates upon decomposition several times more energy than inert polymers absorb (see previous section), therefore, the conditions employed (the sample mass of 1 mg at 20 K min−1, Table 1, first line) are of doubtful reliability.
| # of dataset | Experimental conditions | Log(A/s−1) | E a kJ mol−1 | Conversion degrees at the DSC peaks at various heating rates |
|---|---|---|---|---|
| a This work. b Ref. 38. c Ref. 39. d Ref. 37. e Ref. 53. | ||||
| 1a | m = 1 mg, β = 1–20 K min−1 | 12.3 ± 0.6 | 145 ± 5 | α min = 0.36 (β = 20 K min−1); αmax = 0.55 (β = 1 K min−1); |
| 2a | m = 1 mg, β = 0.5–2 K min−1 | 8.7 ± 0.5 | 112 ± 3 | α min = 0.52 (β = 2 K min−1); αmax = 0.55 (β = 0.5 K min−1); |
| 3a | m = 0.3 mg, β = 2–10 K min−1 | 15.7 ± 0.7 | 176 ± 8 | α min = 0.45 (β = 10 K min−1); αmax = 0.50 (β = 2 K min−1); |
| Fischer et al.b | m = 1 mg, β = 1–20 K min−1 | 12.3 | 143.2 | |
| Sinditskii et al.c | not specified | 13.7 | 156.6 | |
| Huang et al.d | m = 1 mg, β = 5–20 K min−1 | 23.9 | 237.6 | |
| Wang et al.e | m = 0.7 mg, β = 2–20 K min−1 | 12.6 | 143.6 | |
To clarify this issue, we performed two additional series of experiments: (1) with reduced heating rates (sample mass 1 mg, heating rates 0.5–2 K min−1, dataset #2, Table 1) and (2) with reduced sample mass (mass 0.3 mg, heating rates 2–10 K min−1, dataset #3, Table 1). It is seen that the activation energy values corresponding to datasets #1–3 are scattered by more than 60 kJ mol−1 (Table 1). For comparison, we also included in Table 1 the results obtained by other groups, and the discrepancies are even larger (up to 120 kJ mol−1). Apart from this, the ranges of heating rates used and statistics collected are often not sufficient to make reliable conclusions.55
However, the most important point to be emphasized here is that the Kissinger method is based on the pivotal assumption, viz., the conversion degree at a DSC peak temperature remains the same at all heating rates employed.43 The last column of Table 1 shows the variation of conversion values at the DSC peak obtained in our experiments at various heating rates. Indeed, the value of (αmax − αmin) is profoundly lower for the datasets #2 and #3 than that for #1. Nevertheless, the difference between the obtained kinetic parameters for both series of experiments is quite large. All these facts suggest that the application of the Kissinger method in the particular case of TKX-50 is not justified and the corresponding kinetic parameters, including those obtained before,37–39,53 cannot be considered to be reliable. At the same time, it should be emphasized that this fact does not mean the intrinsic failure of the Kissinger method, but rather the too complex nature of kinetics of the energetic species under study. More specifically, the basic assumption of the method (the constant conversion degree) is exact for simple first-order reactions and typically works well for the extended Prout–Tompkins model. However, the decomposition kinetics of TKX-50 turned out to be poorly described by the single-stage Prout–Tomkins model (vide infra, see also Fig. S6, ESI†). At least two-stage formal models render an appropriate fit to the experimental kinetics (Section S4b, ESI†), and this fact can partly explain the above-described poor performance of the Kissinger method.
Contrary to the Kissinger procedure, the methods of isoconversional analysis43 do not assume any restrictions on the reaction model, and allow for tracking of the apparent activation energy at various conversion degree values. It is therefore reasonable to apply these techniques in our case. In the present work, we calculated the kinetic parameters from the DSC data (Fig. 1) using Ozawa–Flynn–Wall (OFW), Friedman (FM), and Vyazovkin (VM) methods.43 The obtained effective activation energies are shown in Fig. 2. In the case of a reduced-weight sample of 0.3 mg, the FM (curve 1) and VM (curve 2) yield similar results, while the OFW values (curve 3) differ profoundly. The reason for such disagreement is insufficient accuracy of the Doyle approximation of the temperature integral employed in the OFW method.43 It is therefore worth mentioning that the OFW activation energies of TKX-50 decomposition reported in the literature are thus of doubtful reliability.37,38
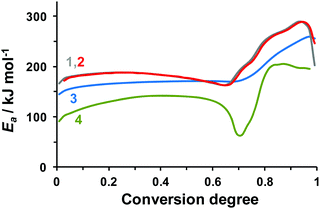 | ||
| Fig. 2 Effective activation energy of TKX-50 decomposition obtained from the DSC data by various isoconversional methods: (1) the Friedman method (FM), dataset #3 (m = 0.3 mg, β = 2–10 K min−1); (2) the Vyazovkin method (VM), dataset #3 (m = 0.3 mg, β = 2–10 K min−1); (3) the Ozawa–Flynn–Wall method, dataset #3 (m = 0.3 mg, β = 2–10 K min−1); (4) the Friedman method, dataset #2 (m = 1 mg, β = 0.5–2 K min−1). The data sets are denoted in accordance with Table 1. | ||
However, even though the two more robust methods (FM and VM) perform similarly (Fig. 2, curves 1 and 2) in the case of the reduced mass (0.3 mg) sample (Table 1, dataset #3), the effective activation energy in the case of a larger sample (Table 1, dataset #2) differs profoundly (Fig. 2, curve 4). Most probably, the discrepancy is due to the self-generated atmosphere inside semi-closed pans, which, in turn, influences the rates of gaseous and condensed phase reactions (vide infra). Nevertheless, we consider the results of reduced sample mass experiments (Fig. 2, curves 1 and 2) to be more reliable, because they are less prone to the influence of evolving gas products.
It is therefore clear that the thermal decomposition of TKX-50 is indeed a complex process comprised of several stages. Because the first and second stages of decomposition are naturally not independent kinetically, the widely employed kinetic deconvolution procedures cannot be applied in the present case (Section S4a, ESI†). Moreover, the above-discussed kinetic parameters were obtained from the DSC experiments and refer to the rate of heat release, not the concentration changes directly. To better understand the mechanism of the TKX-50 decomposition process and obtain reliable kinetic parameters corresponding to particular stages, we studied these stages separately by performing the isothermal measurements of mass loss data.
3.2. The first stage of TKX-50 decomposition: kinetics and intermediates involved
We continued our studies with isothermal TGA measurements of the title compound under argon flow (0.1 MPa). The mass loss measurements of ∼50 mg sample were performed in the temperature range 443–463 K, the results are displayed in Fig. 3. The average value of the total mass loss is 49 ± 2% independent of temperature (Fig. 3). As experimental evidence of achieving the end of a process, we employed the criterion of the TGA rate being below 0.01% min−1 for a continuous time period of longer than 1 hour.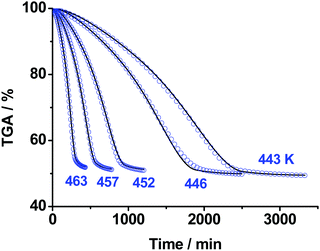 | ||
| Fig. 3 The isothermal TGA mass loss curves of TKX-50 decomposition under Ar flow (0.1 MPa) in the temperature range 443–463 K: blue circles – experimental data; solid curves – formal kinetic modeling (Section S4b, ESI†). | ||
It is seen from Fig. 3 that the decomposition of TKX-50 is indeed complex and consists of several elementary stages. In accordance with the existing suggestions,56,57 we tried to fit the kinetics with various models from simple to more complex. The details of fitting and reaction parameters are given in the ESI† (Section S4b). However, even the best model comprising two consequent reactions turned out not to have a direct physical meaning due to the non-integer values of the reaction orders. We will further discuss the deficiencies of the formal kinetic description in Sections 3.4 and 3.5.
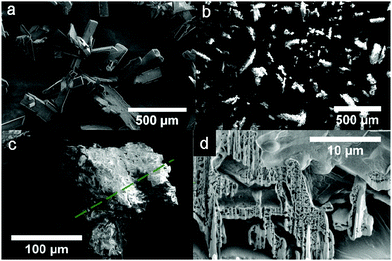
To obtain more physical insight into the nature of decomposition reactions, we also studied the morphology of both pristine crystalline TKX-50 and the solid product of the first stage of its thermolysis (the ∼50% wt asymptote, Fig. 3) using the scanning electron microscopy technique. As seen from Fig. 4, the crystallites in the product of thermolysis approximately retain the dimensions of the pristine crystals (see Fig. 4a and b). However, the product particles (Fig. 4b and c) are in fact agglomerates of glued porous platelets (Fig. 4d). This complex morphology of the product (Fig. 4(b–d)) indicates that the kinetics is highly influenced by physico-geometrical factors. More specifically, the Avrami–Erofeev order of 1.76 in the kinetic model (Scheme S2, Section S4b, ESI†), which describes the first formal step being close to n ∼ 2, agrees well with the platelet structure of the product. Similar kinetics has recently been reported for the thermal decomposition of sodium percarbonate58 and silver acetate.59
Thermal decomposition of nearly all energetic hydroxylammonium salts was proposed to occur via the dissociation to the corresponding acids and bases.60 It is also worth mentioning that the intermediacy of these species in the particular case of the decomposition mechanism of TKX-50 has also been recently suggested.39 On the basis of these facts, we hypothesized the initial thermolysis process of TKX-50 to be dissociation into 1,1′-bistetrazole diol (BTO, Chart 1) and hydroxylammonium NH2OH. In order to further clarify the nature of the occurring reactions, we characterized the condensed product of the first stage of thermolysis (the ∼50% wt asymptote, Fig. 3, see also Fig. 4b). The X-ray powder diffraction revealed this solid to consist primarily of an ammonium salt of 5,5′-bistetrazole-1,1′-diolate (ABTOX, Chart 1). Note that the mass content of ABTOX in the condensed product estimated from 13C NMR data was found to be 75% wt (ESI,† Section S2). The rest 25% wt of the residue comprises a polymeric material, probably melamine-like species, which is known to be formed during the thermolysis of tetrazole derivatives.61,62 To verify this assumption further, single crystals of the product were grown by evaporation from solution in water and their structure was studied by X-ray diffraction. The structural parameters turned out to coincide perfectly with those of ABTOX (Section S2, ESI†). Therefore, we provide direct experimental evidence of the earlier hypothesized intermediacy of ABTOX in the mechanism of TKX-50 decomposition.39
Recall that NH2OH is known to decompose readily at temperatures below 420 K yielding NH3, H2O, and N2O.41 It is therefore reasonable to propose that ammonia reacts with BTO producing the observed ABTOX salt. Note that the stoichiometry of ammonia formed from hydroxylamine is 1![[thin space (1/6-em)]](https://www.rsc.org/images/entities/char_2009.gif) :
:![[thin space (1/6-em)]](https://www.rsc.org/images/entities/char_2009.gif) 2.41 Therefore, the whole amount of NH3 reacts with approximately half of the BTO species forming the observed ABTOX salt. On the basis of these facts, we supposed the following qualitative sketch of decomposition chemistry of TKX-50: at first, the diffusion of the formed gaseous products (NH2OH or simple gas products of its decomposition) through the formed condensed end products takes place. Then the remaining part of BTO decomposes yielding a polymeric residue and simple gas products, this mass loss was directly detected in the TGA experiments.
2.41 Therefore, the whole amount of NH3 reacts with approximately half of the BTO species forming the observed ABTOX salt. On the basis of these facts, we supposed the following qualitative sketch of decomposition chemistry of TKX-50: at first, the diffusion of the formed gaseous products (NH2OH or simple gas products of its decomposition) through the formed condensed end products takes place. Then the remaining part of BTO decomposes yielding a polymeric residue and simple gas products, this mass loss was directly detected in the TGA experiments.
It is also worth mentioning that we monitored the gas products evolving in TGA experiments in situ using IR spectroscopy. The most intensive bands in the IR spectra were assigned to CO2 and N2O in the concentration ratio of 1![[thin space (1/6-em)]](https://www.rsc.org/images/entities/char_2009.gif) :
:![[thin space (1/6-em)]](https://www.rsc.org/images/entities/char_2009.gif) 1.4 (Fig. S12a, Section S5, ESI†). Other weak IR bands were attributed to hydrocyanic (HCN) and hydrazoic (HN3) acids, no traces of water were observed among the gas products. However, it is obvious that the IR-inactive N2 could not be detected. At the same time, N2 and N2O were observed in the MD simulations of TKX-50 decomposition.40 Note that HCN and HN3 were detected as products of the thermolysis of 5-aminotetrazole.62–66 Finally, the two bands detected at 1542 and 1508 cm−1 (Fig. S12a, Section S5, ESI†) could be attributed to melamine-like products.63
1.4 (Fig. S12a, Section S5, ESI†). Other weak IR bands were attributed to hydrocyanic (HCN) and hydrazoic (HN3) acids, no traces of water were observed among the gas products. However, it is obvious that the IR-inactive N2 could not be detected. At the same time, N2 and N2O were observed in the MD simulations of TKX-50 decomposition.40 Note that HCN and HN3 were detected as products of the thermolysis of 5-aminotetrazole.62–66 Finally, the two bands detected at 1542 and 1508 cm−1 (Fig. S12a, Section S5, ESI†) could be attributed to melamine-like products.63
Having obtained these data, we were able to propose the chemical mechanism of TKX-50 thermolysis (Scheme 1, the second stage will be discussed in the next section). It should be clearly emphasized here that these reaction steps are not elementary and do not match directly the formal kinetic scheme (Scheme S2 and Table S1, Section S4b, ESI†). At the moment, it is not possible to provide a complete description at the microscopic level of all physical and chemical processes occurring during the solid-state decomposition of the title species using the available macroscopic thermoanalytical techniques.
 | ||
| Scheme 1 Proposed chemical mechanism of thermal decomposition of TKX-50. The experimentally detected intermediates and products are marked in blue. | ||
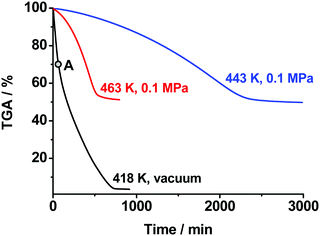
As was discussed above, we directly detected and characterized several solid and gas products and intermediates of thermolysis (marked blue in Scheme 1). In contrast, the first reaction of Scheme 1 was mainly speculated to be dissociation into BTO and NH2OH (Chart 1). Note that such reactions are naturally pressure-dependent, e.g., due to the different volatilities of the product species. To obtain deeper experimental insight into the nature of the reaction proposed, we performed isothermal TGA decomposition experiments under low pressure conditions (the pressure inside the furnace was ∼40 Pa) in the temperature range 393–418 K. A typical kinetic curve at 418 K is displayed in Fig. 5. As could be expected, the low-pressure mass loss occurs at substantially lower temperatures. It is clearly seen from Fig. 5 that the sample was fully consumed at 40 Pa, while the solid residue of ∼50% mass remained under normal pressure (see Fig. 3).
It is worth mentioning that the low-pressure TGA curve exhibits an inflection point at a conversion degree of ∼25–30% (Fig. 5). This value matches well the mass fraction of hydroxylamine in the TKX-50 salt (28%). This fact gives additional evidence of the dissociation of TKX-50 into BTO and hydroxylamine as a primary decomposition process (Scheme 1). Apart from this, we characterized the solid product obtained at a conversion degree of 25% (point “A” in Fig. 5, cf. the same point in Fig. 7). Rather surprisingly, the IR spectra and XRD patterns of this product (ESI,† Section S2) do not match those of BTO dihydrate, ABTOX, or any other BTO salts. The results of elemental analysis formally correspond to a 90%![[thin space (1/6-em)]](https://www.rsc.org/images/entities/char_2009.gif) :
:![[thin space (1/6-em)]](https://www.rsc.org/images/entities/char_2009.gif) 10% wt mixture of BTO and TKX-50. We hypothesize this species to be a hydrate of bistetrazole diol of complicated stoichiometry.
10% wt mixture of BTO and TKX-50. We hypothesize this species to be a hydrate of bistetrazole diol of complicated stoichiometry.
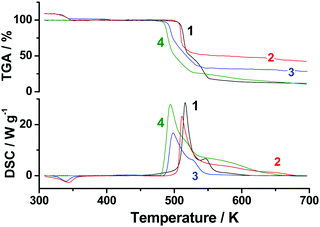
Furthermore, we compared TGA and DSC profiles of TKX-50, BTO·2H2O, their 50![[thin space (1/6-em)]](https://www.rsc.org/images/entities/char_2009.gif) :
:![[thin space (1/6-em)]](https://www.rsc.org/images/entities/char_2009.gif) 50 mechanical mixture, and the low-pressure decomposition product discussed above. It is seen from Fig. 6 (curves 1 and 2) that BTO·2H2O and TKX-50 exhibit very similar decomposition kinetics at low conversion degrees. This fact justifies the key role of BTO decomposition in the TKX-50 thermolysis. Moreover, the decomposition of the 1
50 mechanical mixture, and the low-pressure decomposition product discussed above. It is seen from Fig. 6 (curves 1 and 2) that BTO·2H2O and TKX-50 exhibit very similar decomposition kinetics at low conversion degrees. This fact justifies the key role of BTO decomposition in the TKX-50 thermolysis. Moreover, the decomposition of the 1![[thin space (1/6-em)]](https://www.rsc.org/images/entities/char_2009.gif) :
:![[thin space (1/6-em)]](https://www.rsc.org/images/entities/char_2009.gif) 1 mixture of TKX-50 and BTO·2H2O occurs at a temperature close to that of the low-pressure decomposition product (curves 3 and 4, Fig. 6), but significantly lower than those of individual components. This fact gives further evidence that the low-pressure product studied (point “A” in Fig. 5) is actually a mixture of TKX-50 and BTO. It is also worth mentioning that BTO·2H2O catalyzes the decomposition of TKX-50, and vice versa (cf. curves 1–3, Fig. 6).
1 mixture of TKX-50 and BTO·2H2O occurs at a temperature close to that of the low-pressure decomposition product (curves 3 and 4, Fig. 6), but significantly lower than those of individual components. This fact gives further evidence that the low-pressure product studied (point “A” in Fig. 5) is actually a mixture of TKX-50 and BTO. It is also worth mentioning that BTO·2H2O catalyzes the decomposition of TKX-50, and vice versa (cf. curves 1–3, Fig. 6).
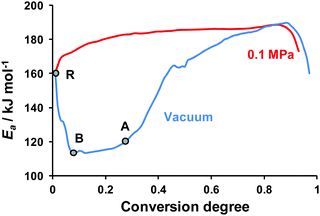
Finally, we processed the isothermal TGA curves obtained at both low and normal pressures by isoconversional Friedman and Vyazovkin methods. The kinetic parameters obtained by both computational methods turned out to coincide with each other. The detailed set of Friedman parameters obtained is given in the ESI† (Section S7, Table S5). The dependencies of apparent activation energy on the conversion degree under normal (red curve) and low (blue curve) pressures are shown in Fig. 7.
At the starting point of decomposition (point R, Fig. 7) the effective activation energy values coincide for both low and atmospheric pressures. Then the apparent activation energy decreases (see the RB section, Fig. 7), which is typical of the decomposition processes with a reversible stage.67 The almost constant value of Ea = 114 ± 7 kJ mol−1 (see the BA section, α = 0.05–0.25, Fig. 7) probably corresponds to the continuous evaporation of hydroxylamine, the most volatile component. The sharp rise of the effective activation energy at ∼25% conversion, which approximately coincides with the hydroxylamine content in TKX-50, again supports the dissociation hypothesis (cf.Fig. 5). Note that at α > 0.6 both low and normal pressure curves are close to each other (Fig. 7). This region probably corresponds to the above-discussed BTO decomposition (Scheme 1).
Therefore, the variety of experimental thermoanalytical and structural methods employed allowed for deeper understanding of the chemistry of primary stages of TKX-50 thermolysis, which commences with dissociation into hydroxylamine and BTO. This process is followed by decomposition of the former species yielding primarily ABTOX among the solid products (Scheme 1). BTO also decomposes in parallel producing some melamine-like polymers in a solid residue (Scheme 1).
3.3. The second stage of TKX-50 decomposition: kinetics and intermediates involved
In the next step of our study, we performed isothermal TGA measurements of decomposition of the product of the first stage of TKX-50 thermolysis, i.e., the solid mixture of ABTOX and polymer (cf. the ∼50% wt asymptote, Fig. 3), in the temperature range 486–519 K under argon flow (0.1 MPa). The results are shown in Fig. 8. The total mass loss at this stage is ∼75% (Fig. 8), which is close to the content of ABTOX in the sample studied (see previous section). The final product, in turn, further decomposes at ∼563 K (vide infra). Similar to the case of the first stage of TKX-50 decomposition, the formal kinetic scheme was sequentially built by addition of the reaction steps in the flexible form; the best resulting model was comprised of the two consequent stages (cf. Scheme S2, Section 4b, ESI†). All details of the kinetic models proposed are given in the ESI† (Section S4d). As in the previous case, it is hard to match the formal kinetic scheme and the observed chemistry.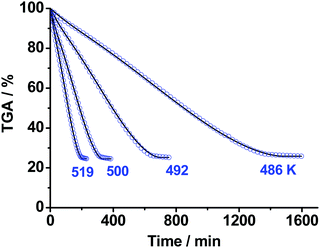 | ||
| Fig. 8 The isothermal TGA mass loss curves of the second stage of TKX-50 decomposition under Ar flow (0.1 MPa) in the temperature range 486–519 K: blue circles – experimental data; solid curves – formal kinetic modeling (Section S4d, ESI†). | ||
Similar to the first stage of TKX-50 decomposition, we propose the initial step of the second stage to be dissociation into BTO acid and ammonia (Scheme 1). The most abundant gas product detected at this stage using IR spectroscopy was ammonia (Fig. S11 and S12b, Section S5, ESI†). This fact also supports the proposed dissociation reaction (Scheme 1). Other IR bands were attributed to simple carbon and nitrogen oxides and hydrocyanic acid in the concentration ratio [NH3]/[NO]/[CO2]/[CO]/[N2O]/[HCN] = 5.0![[thin space (1/6-em)]](https://www.rsc.org/images/entities/char_2009.gif) :
:![[thin space (1/6-em)]](https://www.rsc.org/images/entities/char_2009.gif) 1.0
1.0![[thin space (1/6-em)]](https://www.rsc.org/images/entities/char_2009.gif) :
:![[thin space (1/6-em)]](https://www.rsc.org/images/entities/char_2009.gif) 1.0
1.0![[thin space (1/6-em)]](https://www.rsc.org/images/entities/char_2009.gif) :
:![[thin space (1/6-em)]](https://www.rsc.org/images/entities/char_2009.gif) 0.7
0.7![[thin space (1/6-em)]](https://www.rsc.org/images/entities/char_2009.gif) :
:![[thin space (1/6-em)]](https://www.rsc.org/images/entities/char_2009.gif) 0.3
0.3![[thin space (1/6-em)]](https://www.rsc.org/images/entities/char_2009.gif) :
:![[thin space (1/6-em)]](https://www.rsc.org/images/entities/char_2009.gif) 0.3.
0.3.
Having obtained the isothermal kinetics of the second stage of TKX-50 decomposition (Fig. 8), we complemented this data with non-isothermal TGA and DSC experiments at heating rates 1–20 K min−1. At a typical heating rate of 10 K min−1 decomposition starts at 534 K, followed by a mass loss of about 83% (Fig. S7, Section S4c, ESI†). The heat effect of this exothermic process determined in closed aluminum pans with pierced lids was 1380 ± 300 J g−1.
It is also instructive to compare the Friedman plots for isothermal and non-isothermal data (Fig. S8, Section S4c, ESI†). They are entirely different, thus giving more credence to the choice of isothermal methodology that minimizes heat and mass transfer effects.
Finally, we studied the black-colored powder that remained after the isothermal decomposition in the temperature range employed (Fig. 8). According to elemental analysis, this product has a stoichiometry [C5H5N8O] (ESI,† Section S2). The IR spectrum of this powder has several bands in the region 1250–1700 cm−1 typical of melon C6H3N9 and ammeline C3H5N5O.68 We also tried to decompose this product completely. Upon heating to 1273 K it undergoes a three-stage mass loss with the onset of decomposition at 563 K (Fig. S10, Section S4e, ESI†). Note that only the third stage (starts at ∼773 K) is affected by the changing atmosphere from argon to oxygen (Fig. S10, Section S4e, ESI†). This fact indicates that the earlier stages proceed via intrinsic oxidation of the species.
3.4. Overall mechanism of thermal decomposition of TKX-50
On the basis of the above-discussed experimental observations, we propose the global chemical model of thermolysis of TKX-50 (Scheme 1). Recall that decomposition of TKX-50 is comprised of two distinct stages (Fig. 1). The first stage commences with dissociation of the TKX-50 salt to the corresponding acid and base, viz., hydroxylamine and BTO. The latter (or the corresponding hydrate) decomposes into gaseous species and a polymeric product (Scheme 1). In parallel with the decomposition of BTO, about half of this acid reacts with the decomposition products of NH2OH yielding ABTOX. In the second global stage of the overall process ABTOX dissociates into ammonia and BTO, and the latter decomposes into simple products detected and a stable polymeric residue (Scheme 1).Note that our results confirmed the intermediacy of ABTOX in the thermolysis mechanism of TKX-50, recently hypothesized by Sinditskii et al.39 The authors39 proposed the decomposition of free hydroxylamine to be the key process in the thermolysis of TKX-50. However, our findings (see Fig. 6 and discussion therein) do not confirm this idea. NH2OH initially produced transforms into volatile gases, and some of them react with BTO forming the rather stable ABTOX salt. In contrast, decomposition of BTO is a key process at the first stage of thermolysis of TKX-50, as demonstrated by the direct experiments (cf.Fig. 6 and discussion therein). Therefore, the present data allowed for clarification of the mechanism and exclusion of some contradictory assumptions on the key reactions and intermediates of thermolysis of TKX-50.
However, it should be mentioned once again that it is hard to match directly these processes with the steps of the two-stage formal kinetics (Schemes S2 and S3, Section S4, ESI†). The acid–base dissociation does not directly lead to mass loss since some of the products formed later on a solid product (ABTOX), and cannot be directly detected with TGA. While the first formal reaction of Scheme S2 (ESI†) can be attributed to nuclei formation accompanied by diffusion of hydroxylammonium in the surface product layer,58 the second formal step has a complicated deformed autocatalytic form and does not allow for a simple physical explanation. These facts clearly point out that the formal kinetics cannot describe the set of experimental data obtained for TKX-50. Thus, the kinetic evaluation of the isothermal data on TKX-50 decomposition results in an isoconversional description of the process. At the same time, the formal kinetic methods describe the isothermal kinetics with very good quality of fitting per se (cf. Section S4, ESI†). Nevertheless, in the next section, we perform a detailed independent assessment of various kinetic approaches employed.
3.5. Direct verification of the proposed kinetics: accelerating rate calorimetry experiments
For applications of thermal analysis data, the issue of utmost interest is whether the kinetic parameters, e.g., obtained in DSC experiments with small samples (typically, of milligram weight), can be reliably extrapolated to industrial scale weights and wide temperature intervals. In order to address these issues and independently verify the obtained kinetic parameters, we employed accelerating rate calorimetry (ARC). In comparison with the DSC technique, ARC typically uses the sample mass two orders of magnitude as high. This renders the latter technique to be profoundly more sensitive. In our experiments, 180–240 mg samples of TKX-50 were heated stepwise.46 At each step, after thermal equilibration, the presence of self-heating was monitored. When the self-heating occurred, the system switched to the adiabatic mode: i.e., the furnace temperature tracked the temperature of the sample (recall that self-heating is deliberately avoided in the DSC technique).48Several runs with TKX-50 were performed with different sample loadings, i.e., different thermal inertia factors Φ (Section 2.4). The typical experimental parameters are listed in Table 2. More detailed raw data, including pressure–time and temperature–time curves, are given in the ESI† (Section S6, Fig. S13). Note that relatively high values of the Φ-factor were employed due to the high energetic content of TKX-50. Several attempts to perform measurements with lower Φ values resulted in severe explosions leading to the destruction of containers, thus the sample mass used was limited by the maximal pressure Pmax of the gaseous products inside the sample holder. The onset self-heating temperature was T0 = 454 K (Table 2). The samples of TKX-50 underwent self-heating under adiabatic conditions until the thermal explosion occurred.
The thermal behavior of the samples was calculated using the static heat conductivity equation (the details are described in Section 2.4). To evaluate the reliability of the above-obtained sets of kinetic parameters, all of them were employed in modeling. The typical experimental and calculated time dependencies of temperature under adiabatic conditions are shown in Fig. 9. The isothermal Friedman kinetics (Table S5, Section S7, ESI†) of the first stage of TKX-50 decomposition (Fig. 3) was employed in the present case. It is seen from Fig. 9 that the modeling matches the experimental curve quite well. A slight discrepancy between the two curves at high time values is due to the poor applicability of the model in the vicinity of thermal explosion. At the same time, it is quite useful for the estimation of critical storage and operation conditions and comparison with other energetic species.
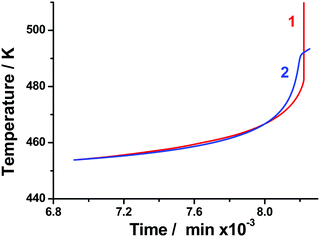 | ||
| Fig. 9 Temperature versus time under adiabatic conditions for the TKX-50 sample (run #2, Table 2): adiabatic reaction calorimetry experiment (red); and modeling using isoconversional Friedman kinetic parameters for an isothermal set of data (blue). | ||
To make a broad benchmark of various approaches for processing the kinetic data, we employed particular kinetic models to calculate the self-heating rate at the onset temperature (SHR0) and time to maximum rate (TMRad). These values were compared with those obtained directly from experiment (Table S4, Section S6, ESI†). The relative deviations of calculated TMRad from the experimental values are summarized in Fig. 10. It is clearly seen that the best performance is achieved for the isoconversional treatment of isothermal data (Sections 3.2 and 3.3) with Friedman (IFM) and Vyazovkin (IVM) methods. These methods are remarkably more accurate than the formal kinetic approach (IFK, Schemes S2 and S3, ESI†) applied to the same isothermal experimental dataset (Fig. 10, green bars). On the other hand, the global non-isothermal kinetic methods (Section 3.1) considerably overestimate (by ∼50%) the TMRad values (Fig. 10, blue bars). Finally, the red group of bars in Fig. 10 corresponds to the modeling using kinetic parameters already reported in the literature.37–39 It is seen that all of them exhibit poor performance.
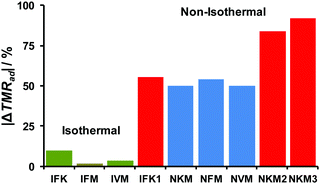 | ||
| Fig. 10 Relative deviations from experiment (Table 2) of the time-to-maximum-heating-rates (TMRad) values calculated using various datasets of kinetic parameters from the experimental values. Isothermal heating (green bars): IFK – formal kinetics, IFM – Friedman isoconversional analysis, IVM – Vyazovkin isoconversional analysis. Non-isothermal heating (blue bars): NKM – Kissinger method, NFM – Friedman isoconversional analysis, NVM – Vyazovkin isoconversional analysis. All these values are from the present work. Reported data (red bars): IFK1 – isothermal formal kinetics from ref. 39; NKM2, NKM3 – the Kissinger method values from ref. 37 and 38, respectively. | ||
This issue clearly points out that the thermal analysis, particularly in the case of energetic materials, should not be reduced (as often happens) to an “overall DSC/TGA processed with the Kissinger method”. Chemical transformations accompanying decomposition can lead to complicated multi-stage chemistry and render the extrapolation of the obtained parameters to different heating rates and temperature intervals entirely unreliable. Attention should always be paid to a thorough consideration of the feasible interplay between physical and chemical processes and a clear separation of the overlapping factors.
The best performance of isoconversional kinetic methods is probably due to better flexibility of this type of representation of the kinetic equations. More specifically, the arbitrary dependence of effective activation energy Ea(α) on the conversion degree allows for reproducing very tiny details of the complex decomposition kinetics. On the other hand, introducing a particular formal kinetic model renders the constraints on the description of kinetics too restrictive. This affects the prediction ability of these methods (Fig. 10). Nevertheless, it should be emphasized here that under no circumstances do these results indicate a general poor intrinsic performance of the tested methods. In contrast, the isoconversional methodology applied to the isothermal mass loss data provides reliable kinetic parameters only in the particular case of the highly energetic species TKX-50. Ultimately, we propose this most robust set of kinetic parameters describing the thermal stability of TKX-50 as a detailed dataset of effective activation energies and pre-exponential factors for various conversion degrees α in Table S5 (Section S7, ESI†).
3.6. Comparison of thermal stability of TKX-50 with other energetic materials
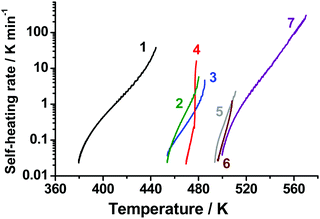
Accelerating rate calorimetry allows for a reliable comparison of thermal stability of various energetic materials. With the aid of this technique, we obtained the dependencies of self-heating rates on temperature for TKX-50 and several other widely used energetic materials. The results are shown in Fig. 11. The curves show that the sample self-heating rate increases at the adiabatic segment of an experimental ARC run. Actually, the left end of each curve corresponds to the detected onset of thermal decomposition, while the right one to thermal explosion. It is worth discussing here that the term “onset temperature” has no strict physical meaning and indeed should be avoided in general context. There are, however, a number of problems, for which this term, being properly and unambiguously defined, is meaningful and useful. In the present case, this value corresponds to a switch of the calorimeter to the adiabatic (“following the sample temperature”) mode. The quantitative criterion for this switch was the self-heating rate being higher than a threshold value (in our case, 0.02 K min−1). Indeed, the chemical reactions proceed at lower temperatures as well, however, at too low rates.Thus, it is clear that the onset values in Fig. 11 are dependent on both “intrinsic” (decomposition kinetics) and “instrumental” properties (e.g., chosen thresholds). These onsets are, therefore, not important as numbers per se. Nevertheless, the mutual thermal stability of the species is indeed meaningful. Consequently, Fig. 11 shows three distinct groups of compounds studied in terms of whole self-heating curves. Among them, the most thermally unstable is ammonium dinitramide (the onset at ∼370 K, curve 1, Fig. 11), hexanitrohexaazaisowurtzitane (CL-20), hexogen, and TKX-50 lie in the middle range (the onset at ∼450–465 K, curves 2, 3, and 4, Fig. 11), followed by the most thermally stable group with octogen, FOX-7, and trinitrotoluene (the onset at ∼490 K, curves 5, 6, and 7, Fig. 11).
It is worth mentioning that TKX-50 and hexogen were claimed34 to have similar thermal stability entirely on the basis of the DSC results. However, the ARC data, which are more germane to real application conditions, reveal that TKX-50 indeed possesses lower thermal stability than hexogen (Fig. 11). The decomposition onset determined by ARC is in line with the isothermal TGA data (Section 3.2), where the mass loss has been observed at 443 K. As was shown in previous section, the results of ARC experiments agree well with modeling based on isothermal TGA data. These facts give additional evidence of the reliability of ARC. More generally, this indicates that the thermal stability of a particular energetic compound should be critically assessed using several complementary thermoanalytical techniques.
4. Conclusions
The thermal decomposition of energetic materials and compositions is typically profoundly more complicated than the gas-phase processes. Consequently, a correct description of the solid-state decomposition process typically requires non-trivial approaches to solution of the inverse kinetic problem. In the case of energetic materials, the matter of choosing appropriate experimental conditions is also crucial to obtain reliable kinetic data. In the present contribution, thermolysis of dihydroxylammonium 5,5′-bistetrazole-1,1′-diolate (TKX-50) was studied using a huge set of complementary thermolysis experiments (isothermal and non-isothermal; under atmospheric and low pressures; of pure TKX-50 samples, and mixtures of TKX-50 with BTO and various decomposition products). The full interplay of the performed experiments is shown in Scheme S1 (Section S1, ESI†). To properly deconvolute the two stages of decomposition of TKX-50, we conducted separate isothermal experiments. Two main stages of decomposition were observed; both are exothermic and proceed with mass losses of 49% and 38% at the first and second stages, respectively. The kinetic parameters for both stages of decomposition were obtained using various data processing techniques. In contrast to the majority of thermal analytical studies, the kinetic parameters obtained were independently verified by comparison of modeling results with experimental accelerating rate calorimetry data. The most important findings of the present work are:(1) We clearly showed that the previously used procedures37–39,53 (“overall DSC + TGA processed with the Kissinger method”) are not applicable in the present case. Moreover, we tested various data processing techniques (Kissinger, isoconversional, formal kinetic approaches, etc.) and, most importantly, independently benchmarked them against the accelerating rate calorimetry data, which are more germane to real material storage and usage conditions. This allowed for a substantiated choice of the most reliable set of kinetic parameters, viz., those obtained by the isoconversional Friedman method (Table S5, Section S7, ESI†).
(2) The important intermediates of TKX-50 thermolysis were directly identified. Decomposition commences with dissociation into hydroxylamine and bistetrazole diol (BTO), and the decomposition of the latter species is a key step in the TKX-50 thermolysis. Moreover, BTO catalyzes TKX-50 decomposition (and vice versa). The final solid product of the first stage of decomposition is ∼75![[thin space (1/6-em)]](https://www.rsc.org/images/entities/char_2009.gif) :
:![[thin space (1/6-em)]](https://www.rsc.org/images/entities/char_2009.gif) 25% wt mixture of diammonium 5,5′-bistetrazole-1,1′-diolate (ABTOX) and a polymeric residue. The second stage of TKX-50 thermolysis comprises the ABTOX dissociation to ammonia and BTO, the latter acid produces simple gases during the decomposition.
25% wt mixture of diammonium 5,5′-bistetrazole-1,1′-diolate (ABTOX) and a polymeric residue. The second stage of TKX-50 thermolysis comprises the ABTOX dissociation to ammonia and BTO, the latter acid produces simple gases during the decomposition.
(3) On the basis of accelerating rate calorimetry data, the thermal stability of TKX-50 was found to be slightly lower than that of hexogen and to be at the same level as that of hexanitrohexaazaisowurtzitane. This fact does not support the conclusions made before on the basis of simple DSC measurements.34
Acknowledgements
N. V. M. acknowledges Russian Foundation for Basic Research for financial support of the experimental part (project 16-33-60162 mol_a_dk). V. G. K. acknowledges Russian Science Foundation for financial support of the modeling part and interpretation of results (project 16-13-10155). A. F. A. and M. S. N. acknowledge Russian Science Foundation for financial support of the synthetic part (project 14-50-00126).References
- T. M. Klapotke and G. Holl, Green Chem., 2001, 3, G75–G77 Search PubMed.
- A. Hammerl, M. A. Hiskey, G. Holl, T. M. Klapotke, K. Polborn, R. Stierstorfer and J. J. Weigand, Chem. Mater., 2005, 17, 3784–3793 CrossRef CAS.
- R. P. Singh, R. D. Verma, D. T. Meshri and J. M. Shreeve, Angew. Chem., Int. Ed., 2006, 45, 3584–3601 CrossRef CAS PubMed.
- G. Steinhauser and T. M. Klapotke, Angew. Chem., Int. Ed., 2008, 47, 3330–3347 CrossRef CAS PubMed.
- T. M. Klapotke and C. M. Sabate, Chem. Mater., 2008, 20, 3629–3637 CrossRef.
- T. M. Klapotke and J. Stierstorfer, J. Am. Chem. Soc., 2009, 131, 1122–1134 CrossRef CAS PubMed.
- Y. C. Li, C. Qi, S. H. Li, H. J. Zhang, C. H. Sun, Y. Z. Yu and S. P. Pang, J. Am. Chem. Soc., 2010, 132, 12172–12173 CrossRef CAS PubMed.
- H. X. Gao and J. M. Shreeve, Chem. Rev., 2011, 111, 7377–7436 CrossRef CAS PubMed.
- T. M. Klapotke and D. G. Piercey, Inorg. Chem., 2011, 50, 2732–2734 CrossRef PubMed.
- T. M. Klapotke, F. A. Martin and J. Stierstorfer, Angew. Chem., Int. Ed., 2011, 50, 4227–4229 CrossRef PubMed.
- Q. H. Zhang and J. M. Shreeve, Angew. Chem., Int. Ed., 2013, 52, 8792–8794 CrossRef CAS PubMed.
- T. M. Klapotke, D. G. Piercey and J. Stierstorfer, Eur. J. Inorg. Chem., 2013, 1509–1517 CrossRef.
- N. Fischer, T. M. Klapotke, M. Reymann and J. Stierstorfer, Eur. J. Inorg. Chem., 2013, 2167–2180 CrossRef CAS.
- N. Fischer, D. Izsak, T. M. Klapotke and J. Stierstorfer, Chem. – Eur. J., 2013, 19, 8948–8957 CrossRef CAS PubMed.
- M. A. Kettner and T. M. Klapotke, Chem. – Eur. J., 2015, 21, 3755–3765 CrossRef CAS PubMed.
- Y. X. Tang, H. X. Gao, D. A. Parrish and J. M. Shreeve, Chem. – Eur. J., 2015, 21, 11401–11407 CrossRef CAS PubMed.
- D. Fischer, T. M. Klapotke and J. Stierstorfer, Angew. Chem., Int. Ed., 2015, 54, 10299–10302 CrossRef CAS PubMed.
- J. H. Zhang, L. A. Mitchell, D. A. Parrish and J. M. Shreeve, J. Am. Chem. Soc., 2015, 137, 10532–10535 CrossRef CAS PubMed.
- N. V. Muravyev, A. A. Bragin, K. A. Monogarov, A. S. Nikiforova, A. A. Korlyukov, I. V. Fomenkov, N. I. Shishov and A. N. Pivkina, Propellants, Explos., Pyrotech., 2016 DOI:10.1002/prep.201600068.
- T. M. Klapotke, Struct. Bonding, 2007, 125, 85–121 CrossRef.
- R. P. Singh, H. Gao, D. T. Meshri and J. M. Shreeve, Struct. Bonding, 2007, 125, 35–83 CrossRef CAS.
- T. M. Klapotke and J. Stierstorfer, in Green Energetic Materials, ed. T. Brinck, John Wiley & Sons Ltd, 2014, ch. 6, pp. 133–177 Search PubMed.
- I. V. Tselinskii, S. F. Mel'nikova and T. V. Romanova, Russ. J. Org. Chem., 2001, 37, 430–436 CrossRef CAS.
- A. M. Churakov and V. A. Tartakovsky, Chem. Rev., 2004, 104, 2601–2616 CrossRef CAS PubMed.
- M. Gobel, K. Karaghiosoff, T. M. Klapotke, D. G. Piercey and J. Stierstorfer, J. Am. Chem. Soc., 2010, 132, 17216–17226 CrossRef CAS PubMed.
- T. M. Klapotke, D. G. Piercey and J. Stierstorfer, Chem. – Eur. J., 2011, 17, 13068–13077 CrossRef PubMed.
- D. Fischer, T. M. Klapotke, D. G. Piercey and J. Stierstorfer, Chem. – Eur. J., 2013, 19, 4602–4613 CrossRef CAS PubMed.
- A. A. Dippold and T. M. Klapotke, J. Am. Chem. Soc., 2013, 135, 9931–9938 CrossRef CAS PubMed.
- D. G. Piercey, D. E. Chavez, S. Heimsch, C. Kirst, T. M. Klapotke and J. Stierstorfer, Propellants, Explos., Pyrotech., 2015, 40, 491–497 CrossRef CAS.
- D. Fischer, T. M. Klapotke and J. Stierstorfer, Eur. J. Inorg. Chem., 2015, 4628–4632 CrossRef CAS.
- K. Hafner, T. M. Klapotke, P. C. Schmid and J. Stierstorfer, Eur. J. Inorg. Chem., 2015, 2794–2803 CrossRef CAS.
- T. M. Klapotke, M. Q. Kurz, R. Scharf, P. C. Schmid, J. Stierstorfer and M. Suceska, ChemPlusChem, 2015, 80, 97–106 CrossRef.
- P. Yin, Q. H. Zhang and J. M. Shreeve, Acc. Chem. Res., 2016, 49, 4–16 CrossRef CAS PubMed.
- N. Fischer, D. Fischer, T. M. Klapotke, D. G. Piercey and J. Stierstorfer, J. Mater. Chem., 2012, 22, 20418–20422 RSC.
- R. Pesce-Rodriguez, E. Klier, H. Grau, P. Samuels, Compatibility of TKX-50. August 2014, ARL-TR-7043.
- S. Nicolich, P. Samuels, R. Damavarapu, A. Paraskos, E. Cooke, V. Stepanov, P. Cook, K. Caflin and R. Duddu, Dihydroxylammonium 5,5′-bis-tetrazole-1,1′-diolate (TKX-50) Synthesis and Lab Scale Characterization, in Insensitive Munitions and Energetic Materials Technical Symposium, Rome, Italy, Insensitive Munitions European Manufacturers Group, Rome, Italy, 2015; 5B3-17189.
- H. F. Huang, Y. M. Shi and J. Yang, J. Therm. Anal. Calorim., 2015, 121, 705–709 CrossRef CAS.
- D. Fischer, T. M. Klapotke, S. M. Musanic, J. Stierstorfer and M. Suceska, TKX-50, in Proceedings of the 16th Seminar on New Trends in Research of Energetic Materials, ed. J. Pachman, J. Selesovsky and R. Matyas, University of Pardubice, Czech Republic, 2013, pp. 566–577.
- V. P. Sinditskii, S. A. Filatov, V. I. Kolesov, K. O. Kapranov, A. F. Asachenko, M. S. Nechaev, V. V. Lunin and N. I. Shishov, Thermochim. Acta, 2015, 614, 85–92 CrossRef CAS.
- Q. An, W. G. Liu, W. A. Goddard, T. Cheng, S. V. Zybin and H. Xiao, J. Phys. Chem. C, 2014, 118, 27175–27181 CrossRef CAS.
- T. Adamopoulou, M. I. Papadaki, M. Kounalakis, V. Vazquez-Carreto, A. Pineda-Solano, Q. S. Wang and M. S. Mannan, J. Hazard. Mater., 2013, 254, 382–389 CrossRef PubMed.
- B. Yuan, Z. J. Yu and E. R. Bernstein, J. Phys. Chem. A, 2015, 119, 2965–2981 CrossRef CAS PubMed.
- S. Vyazovkin, A. K. Burnham, J. M. Criado, L. A. Perez-Maqueda, C. Popescu and N. Sbirrazzuoli, Thermochim. Acta, 2011, 520, 1–19 CrossRef CAS.
- A. K. Galwey and M. E. Brown, Thermal Decomposition of Ionic Solids, Elsevier, Amsterdam, 1999 Search PubMed.
- A. Perejon, P. E. Sanchez-Jimenez, J. M. Criado and L. A. Perez-Maqueda, J. Phys. Chem. B, 2011, 115, 1780–1791 CrossRef CAS PubMed.
- ASTM, E1981-98(2012)e2. In Standard Guide for Assessing Thermal Stability of Materials by Methods of Accelerating Rate Calorimetry, ASTM International, West Conshohocken, PA, 2012.
- Bruker APEX 2, Bruker AXS Inc., Madison, Wisconsin, USA, 2004.
- ASTM, E698-05. In Standard Test Method for Arrhenius Kinetic Constants for Thermally Unstable Materials, ASTM International, West Conshohocken, PA, 2005.
- NETZSCH Thermokinetics Software 3.1, NETZSCH Corporation, Selb, Germany, 2014.
- N. V. Muravyev, THINKS – thermokinetic software, v1.0; Moscow, 2015. This package is available on request from the authors.
- B. Roduit, W. Dermaut, A. Lunghi, P. Folly, B. Berger and A. Sarbach, J. Therm. Anal. Calorim., 2008, 93, 163–173 CrossRef CAS.
- N. V. Muravyev, K. A. Monogarov, A. A. Bragin, I. V. Fomenkov and A. N. Pivkina, Thermochim. Acta, 2016, 631, 1–7 CrossRef CAS.
- J. Wang, Y. Yang, C. Zhang, X. Wang and X. Zhang, Chin. J. Explos. Propellants, 2015, 38, 42–45 Search PubMed.
- J. Opfermann, J. Therm. Anal. Calorim., 2000, 60, 641–658 CrossRef CAS.
- A. K. Burnham and L. N. Dinh, J. Therm. Anal. Calorim., 2007, 89, 479–490 CrossRef CAS.
- R. E. Lyon, N. Safronava, J. Senese and S. I. Stoliarov, Thermochim. Acta, 2012, 545, 82–89 CrossRef CAS.
- A. K. Burnham, Thermochim. Acta, 2014, 597, 35–40 CrossRef CAS.
- M. Nakano, T. Wada and N. Koga, J. Phys. Chem. A, 2015, 119, 9761–9769 CrossRef CAS PubMed.
- M. Nakano, T. Fujiwara and N. Koga, J. Phys. Chem. C, 2016, 120, 8841–8854 CrossRef CAS.
- G. B. Manelis, G. M. Nazin, Yu. I. Rubtsov and V. A. Strunin, Thermal decomposition and combustion of explosives and propellants, Taylor and Francis, London and New York, 2003 Search PubMed.
- A. I. Lesnikovich, O. A. Ivashkevich, G. V. Printsev, P. N. Gaponik and S. V. Levchik, Thermochim. Acta, 1990, 171, 207–213 CrossRef CAS.
- A. I. Lesnikovich, O. A. Ivashkevich, S. V. Levchik, A. I. Balabanovich, P. N. Gaponik and A. A. Kulak, Thermochim. Acta, 2002, 388, 233–251 CrossRef CAS.
- A. Gao, Y. Oyumi and T. B. Brill, Combust. Flame, 1991, 83, 345–352 CrossRef CAS.
- S. V. Levchik, O. A. Ivashkevich, A. I. Balabanovich, A. I. Lesnikovich, P. N. Gaponik and L. Costa, Thermochim. Acta, 1992, 207, 115–130 CrossRef CAS.
- T. B. Brill and H. Ramanathan, Combust. Flame, 2000, 122, 165–171 CrossRef CAS.
- V. G. Kiselev and N. P. Gritsan, J. Phys. Chem. A, 2009, 113, 3677–3684 CrossRef CAS PubMed.
- S. V. Vyazovkin, V. I. Goryachko and A. I. Lesnikovich, Thermochim. Acta, 1992, 197, 41–51 CrossRef CAS.
- C. E. Stoner Jr. and T. B. Brill, Combust. Flame, 1991, 83, 302–308 CrossRef.
Footnote |
| † Electronic supplementary information (ESI) available: Characterization of condensed decomposition products of TKX-50; scanning electron microscopy images of TKX-50 and condensed products of its thermolysis; non-isothermal DSC data for TKX-50 decomposition; fitting the kinetic model for the first and second stages of TKX-50 decomposition; and thermal behavior of the condensed product of the first stage and of the final decomposition product. The IR spectra of the evolved gases; accelerating rate calorimetry data and its modeling; and the proposed isoconversional kinetic parameters for the first stage of TKX-50 decomposition. See DOI: 10.1039/c6cp06498a |
| This journal is © the Owner Societies 2017 |


