The conformational landscape of 2-(4-fluoro-phenyl)-ethylamine: consequences of fluorine substitution at the para position†
Afik
Shachar
,
Nitzan
Mayorkas
,
Hanan
Sachs
and
Ilana
Bar
*
Department of Physics, Ben-Gurion University of the Negev, Beer-Sheva 84105, Israel. E-mail: ibar@bgu.ac.il
First published on 22nd November 2016
Abstract
Fluorination is considered as a possible means for alteration of conformational landscapes in molecules. The effect of fluorine substitution was studied here by measuring the vibronic and vibrational spectra of gas phase 2-(4-fluoro-phenyl)-ethylamine (4-FPEA) by resonant two-photon ionization (R2PI) and by ionization-loss stimulated Raman spectroscopy (ILSRS). The measurement of survey ILSR spectra of 4-FPEA in the amino group region allowed to associate the bands in the R2PI spectrum to origin and vibronic transitions of the ground (S0) to the excited (S1) electronic states of three different conformers. The presence of these conformers of 4-FPEA in the molecular beam was confirmed by measurement of distinctive ILSRS spectral signatures in the 400–1700 and 2750–3500 cm−1 broad spectral range. The interpretation of their structures was assisted by the results of quantum chemical calculations, including a torsional potential energy surface, energies of the fully optimized geometries in the S0 state and harmonic Raman spectra as well as natural bond orbital and atoms in molecule analyses. Comparison of the spectra with the results of scaled harmonic Raman spectra revealed two gauche configurations with folded ethylamino side chains and amino groups aiming to different directions together with a symmetric anti structure with an outward extended chain. The site-specific para-fluorination, at a distant position from the side chain modified the energetic ordering of the conformers, relative to the structure with the fluorine atom at the ortho position, but kept it close to that of PEA.
1. Introduction
Insertion of fluorine atoms into organic molecules can lead to a wide range of different compounds, with modified conformational preferences and properties, relative to their non-fluorinated counterparts. Of particular importance is the selective fluorination of bioactive molecules, which allows design of new drugs with modified physicochemical characteristics and increased pharmaceutical effectiveness.1–5 This is due to the very unique properties of fluorine, including its small size and highest electronegativity, which lead to highly polarized C–F bonds and non-polarizable fluorine lone pairs.A class of biomolecules that was often studied is that of monoamine neurotransmitters (NTs) and neuromodulators,6–25 which transmit, enhance and modulate neural signals across the synapse between neurons; nevertheless, their fluorinated neutral26–28 and protonated29,30 analogs gained much less attention. Essentially, NTs are characterized by a rigid skeleton and a flexible ethylamino (–CH2CH2NH2) side chain attached to it. This chain can experience large-amplitude motions consisting of internal rotations about the C–N and the two C–C single bonds (see Fig. 1), i.e., the ψ, β, and α dihedral angles, respectively, as well as NH2 group inversion. Nevertheless, the chain flexibility is mainly determined by the ψ and β angles, leading to different conformers and to interesting ridged potential energy surfaces (PESs) for the various compounds. The most stable conformers, obtained by delicate balance between intramolecular forces, can be distinguished since the high PE barriers prevent their isomerization.
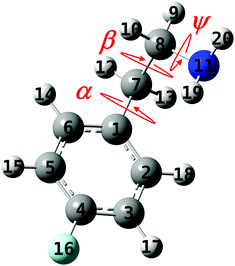 | ||
| Fig. 1 The geometry of the 2-(4-fluoro-phenyl)-ethylamine molecule with the ψ, α, and β dihedral angles that are responsible for the conformational changes and the numbering of the atoms. | ||
Indeed, the structures of different NTs were studied, using a variety of gas-phase spectroscopic methods, involving one-color mass-selected resonant two-photon ionization (R2PI), ultraviolet–ultraviolet hole burning (UV-UV HB), infrared ion-dip spectroscopy (IR-IDS), or infrared-ultraviolet (IR-UV) hole burning (HB) spectroscopy,31–34 ionization-loss stimulated Raman spectroscopy (ILSRS),20,35 or stimulated Raman-ultraviolet hole-burning (SR-UV HB) spectroscopy and rotational Fourier-transform microwave spectroscopy.14,18,21 Specifically, these methods allowed monitoring of vibronic, vibrational and rotational spectra of the species found in molecular beams, which could then be identified by the help of quantum chemical calculations, disclosing their structures.
Of particular interest is the simplest NT, 2-phenylethylamine (PEA), which is an aromatic biogenic amine and the building block for NTs. The observation of five different conformers was suggested,8 however, the fifth one was reassigned to a water cluster.9 From these four structures, out of five predicted ones,6,9–11,18,20 two favored gauche and two other anti geometries, compatible with lower and higher energy conformers, respectively. The main difference between the structures came from the folding or extension of the side chain that led to different positions and orientations of the amino hydrogen atoms, where one, or both hydrogen atoms pointed towards, or far away from the aromatic ring, leading to the respective gauche and anti conformers. The folded structures allowed formation of weak N–H⋯π hydrogen-bonds and consequently slight stabilization.
Very recently,27,28 the conformational preferences of 2-(2-fluoro-phenyl)-ethylamine (F–C6H4–CH2–CH2–NH2, 2-FPEA), the ortho-fluoro derivative of PEA, were studied. This site-specific fluorine substitution on the aromatic ring, led to the uncovering of five different conformers of 2-FPEA in the molecular beam, while using microwave spectroscopy27 and ILSR and UV-UV HB spectroscopies.28 These five conformers, out of nine possible structures, included three folded gauche and two extended anti conformers. The fluorine substitution at the ortho-position led to a phenyl ring of reduced symmetry, raising the number of possible conformers, where in the two lowest energy gauche structures (G1h and G2h) the amino group pointed toward the hydrogen atom (facing the fluorine) and in the additional one (G2f) toward the fluorine atom. The structures of the anti conformers (A1h and A2) resembled those of PEA. Accordingly, the proximity of the fluorine atom to the ethylamino side chain, modified somewhat the energy gaps between the various conformers, due to the interplay between the hydrogen-bonds and the repulsive interactions, which put forth a delicate stabilizing effect that raised the number of conformers, compared to PEA.
At this point, our study is extended toward the para fluorine substituted PEA, namely, 2-(4-fluoro-phenyl)-ethylamine (F-C6H4–CH2–CH2–NH2, 4-FPEA), shown in Fig. 1. The fluorine presence might alter the electron density in the molecule, however, this site-specific substitution is expected to be less effective in inducing conformational variations, and therefore it would be interesting to test whether it is really so. This could be realized by measuring, for the first time, the R2PI and ILSRS spectral signatures of this compound and by comparing the latter to quantum chemical calculated Raman spectra. Actually, this comparison and the energetic considerations, allowed to distinguish three (two gauche and symmetric anti) structures, resembling those of PEA, but with somewhat different energy gaps. Interestingly, the additional anti structure, which is somewhat lower in energy than the symmetric one, could not be identified among the structures existing in the molecular beam.
2. Methods
a. Experimental
Briefly, mass-selected one-color R2PI and ILSR spectra were measured, similarly to our previous studies,20,23,24,28 in a pumped Wiley-McLaren home-built time-of-flight mass spectrometer (TOFMS). The TOFMS included a differentially pumped source and a main detection chamber, separated by a skimmer aperture [2.0 mm diameter (dia.)]. A stream of carrier gas (Ar), at a pressure of about 1 bar, flowed through the vapor of 4-FPEA, purchased from Sigma-Aldrich (99% pure), held in a small reservoir at a temperature of about 50 °C. The gas mixture pointed toward the detection plane and was expanded and passed through a 10 Hz operating pulsed valve (0.8 mm dia. orifice) and the skimmer, respectively, before entering into the main vacuum chamber. The molecular beam was crossed by the laser beams, in the interaction region of the TOFMS, allowing monitoring of the R2PI and ILSR spectra.The R2PI spectrum was measured using a tunable frequency-doubled pulsed dye laser (UV), pumped by a tripled neodymium:yttrium aluminum-garnet (Nd:YAG) laser (∼5 ns pulses, 10 Hz frequency and energy of <50 μJ per pulse). The ILSR spectra were monitored by using an additional Nd:YAG laser that supplied the SR scattering beams, while parking the UV laser on resonances observed in the R2PI spectrum and related to the different conformers. This laser provided the second harmonic (532 nm) (∼5 ns pulses at 10 Hz), split in a one to four ratio, so that the weaker beam served as pump, ωp, and the stronger pumped a dye laser to generate a tunable Stokes beam, ωS. The counterpropagating vertically polarized ωp and ωS beams (energies of ∼17 and 25 mJ per pulse, respectively) were focused with 35 and 30 cm focal length (f.l.) planoconvex lenses and were spatially and temporally overlapped in the interaction region of the TOFMS. The UV beam entered from the same side of the chamber as ωp and was focused by the same 35 cm f.l. lens, to overlap the SR beams and to be delayed, relative to them by ∼40 ns. Ions obtained by the different methods were detected by a microchannel plate and fed into a home-made fast preamplifier, allowing measurement of mass spectra, or the integrated intensity of the molecular ion peak with a fast digital oscilloscope.
The R2PI or ILSR spectra were obtained either by scanning the UV laser beam, or by parking the UV laser beam on each of the peaks of the features in the R2PI spectrum, keeping ωp constant and scanning ωS. Loss signals were obtained by population depletion of the vibrational ground state of 4-FPEA molecules, whenever the frequency differences, ωp–ωS, matched the frequencies of particular vibrations of the different conformers. The resultant R2PI and ILSR spectra were obtained by measuring the integrated ion signal as a function of the wavelengths of the respective tunable laser beams, UV and ωS. Depending on the fractional population of each conformer in the molecular beam, three to ten ILSR spectra were measured and averaged to obtain proper signal-to-noise levels in the spectrum of each conformer, while scanning the ωS laser at 0.026 nm per step.
b. Calculations
The MMFF94s force field in Avogadro36 was used for initial geometry optimizations of the 4-FPEA conformers. These geometries were then introduced in the GAUSSIAN 09 package37 to carry out density functional theory (DFT) calculations for determining the structures, energies and Raman spectra of the 4-FPEA conformers. The geometric optimization was carried out using “tight” self-consistent field convergence criteria and “ultrafine” integration grids. The optimizations were performed by the Becke three parameter hybrid functional combined with the Lee–Yang–Parr correlation functional (B3LYP)38,39 and by dispersion-corrected DFT, i.e., the M06-2X functional.40 The 6-311++G(d,p) basis set was used with both methods. The optimized structures were then used for ab initio single point energy calculations, with the second order Møller–Plesset perturbation theory (MP2)41 and similar basis set, to confirm the energetic ordering. The optimized geometries of all conformers were computed without symmetry restrictions, except for the symmetric anti conformer, A2 (see below), which was constrained to the Cs point group.The resulting optimized geometries were also used for calculation of the harmonic vibrational frequencies and the Raman activities at the B3LYP/6-311++G(d,p), or M06-2X/6-311++G(d,p) levels. The positive values of all calculated vibrational frequencies, assured positioning of these geometries at true local minima on the PES. The harmonic frequencies computed with B3LYP/6-311++G(d,p) and M06-2X/6-311++G(d,p) were scaled by the previously derived factors for 2-FPEA,28 0.956, 0.964 and 0.964 and 0.943 and 0.946, 0.953 and 0.949 and 0.974 for the stretches of N–H, of C–Hs of the ring, of C–Hs of the ethylamino group and for the low <1700 cm−1 frequency range, respectively. The calculated Raman activities and depolarization ratios were used to evaluate the Raman intensities, according to ref. 22. In addition, the two dimensional (2D) torsional PES of 4-FPEA was calculated at the MP2/6-311++G(d,p) level of theory, and scanning the ψ and β angles with 10° steps.
In addition, the numerical data derived from the output files of the quantum chemical analysis with Gaussian 09,37 at the M06-2X/6-311++G(d,p) level, were processed and used by Gaussview42 to visualize the motion of the atoms in each of the calculated normal modes, to generate electrostatic potential (ESP)43 maps onto a particular value of the total electron density and to carry out natural bond orbital (NBO)44,45 and atoms in molecule (AIM)46 analyses. Each ESP map used consistent isovalues and color scaling for the conformers of 4-FPEA and PEA. The NBO method allowed to find possible interactions between a filled (bonding or lone pair) Lewis type NBO donor and an empty (antibonding) non-Lewis NBO acceptor. The strength of the interactions was estimated via second-order perturbation theory analysis of the Fock matrix.45 The topological analysis of the electronic charge density was performed by using the AIM methodology, with the AIMAll program package.47
3. Results and discussions
a. Resonant two-photon ionization and survey ionization-loss stimulated Raman spectra
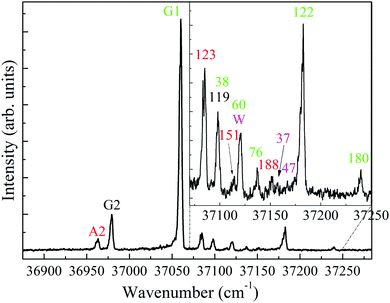
Fig. 2, presents the ion signal of the m/z 139 mass channel, corresponding to the low energy region of the S1 ← S0 band in the one-color R2PI spectrum of 4-FPEA. The R2PI spectrum is characterized by an intense feature at 37 060 cm-1, appearing well below the comparable S1 ← S0 origins in PEA6,9,10,48 (37![[thin space (1/6-em)]](https://www.rsc.org/images/entities/char_2009.gif) 610) and in 2-FPEA,28 (37
610) and in 2-FPEA,28 (37![[thin space (1/6-em)]](https://www.rsc.org/images/entities/char_2009.gif) 608 cm−1). In addition, it consists of some extra features of moderate and weak intensities shifted to blue and red (also shown as an enlarged spectrum in the inset). A plausible assumption was that the features in this rich spectrum are related to origins, or to excited vibronic transitions in the S1 ← S0 states of various conformers of 4-FPEA. Like in our previous study,28 these features could be classified by first measuring survey ILSR spectra, in the limited range of the amino stretches (3280–3550 cm−1).
608 cm−1). In addition, it consists of some extra features of moderate and weak intensities shifted to blue and red (also shown as an enlarged spectrum in the inset). A plausible assumption was that the features in this rich spectrum are related to origins, or to excited vibronic transitions in the S1 ← S0 states of various conformers of 4-FPEA. Like in our previous study,28 these features could be classified by first measuring survey ILSR spectra, in the limited range of the amino stretches (3280–3550 cm−1).
The resulting ILSR survey spectra, shown in Fig. 3(a)–(m) were monitored while parking on the peaks of each of the features (starting from the lowest frequency and going up) existing in the R2PI spectrum. These survey spectra included sharp peaks related to the rotational band contours of the Q-branches of the observed bands. It is immediately apparent that most spectra include two peaks, related to the symmetric and antisymmetric N–H stretches of the 4-FPEA conformers, while Fig. 3(e), (g), (j) and (k) exhibit more complicated patterns.
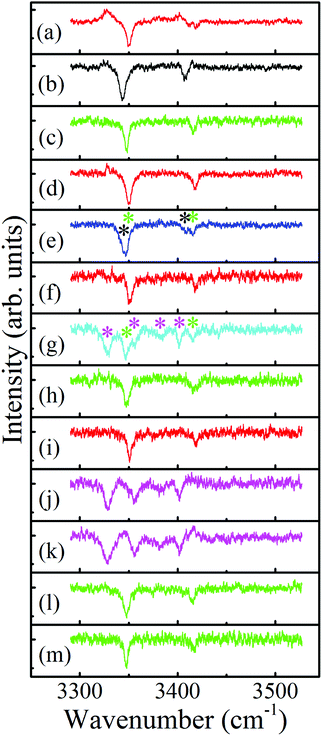 | ||
| Fig. 3 Survey ionization-loss stimulated Raman spectra of the conformers of 2-(4-fluoro-phenyl)-ethylamine in the amino group range, displayed in panels (a) to (m), measured by parking the UV probe laser on all marked bands in Fig. 2, starting from the lowest frequency band and going up. The spectra related to the A2, G2, G1 and W species and the mixed ones that include contributions of G1 and G2, and of G1 and W are displayed by red, black, green and magenta, and by blue and cyan, respectively. | ||
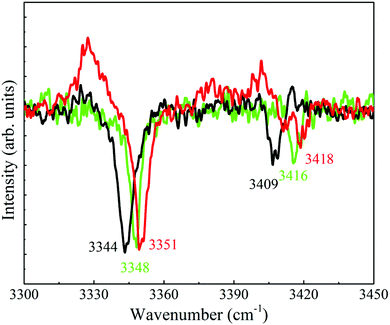
As for the spectra that contain only two peaks it was noticed that they exhibit similar or different Raman shifts for the N–H stretches and this resemblance or dissimilarity could be used to sort the spectra accordingly; indicating that the N–H stretches are extremely sensitive to the conformation of the side chain. In particular, the shifts of the symmetric and antisymmetric N–H stretches correspond to 3351 and 3418 [panels (a), (d), (f) and (i)], 3344 and 3409 [panel (b)], and 3348 and 3416 cm−1 [panels (c), (h), (l) and (m)], respectively. Consequently, the distinctive types of spectra in the corresponding panels were displayed by red, black and green colors, indicating the occurrence of three different conformers of 4-FPEA. This sorting allowed to distinguish between the R2PI features of 4-FPEA, related to origin transitions marked by A2, G2 and G1 (see below) at 36![[thin space (1/6-em)]](https://www.rsc.org/images/entities/char_2009.gif) 963, 36
963, 36![[thin space (1/6-em)]](https://www.rsc.org/images/entities/char_2009.gif) 979 and 37
979 and 37![[thin space (1/6-em)]](https://www.rsc.org/images/entities/char_2009.gif) 060 cm−1, respectively, and those associated with excited vibronic states, denoted with shifts in cm−1 (relative to the band origin of the conformer marked by a specific color) (Fig. 2). This change in the frequency of the UV electronic transitions was expected since it is related to molecular structure, leading to slightly different UV absorptions for any two conformers.
060 cm−1, respectively, and those associated with excited vibronic states, denoted with shifts in cm−1 (relative to the band origin of the conformer marked by a specific color) (Fig. 2). This change in the frequency of the UV electronic transitions was expected since it is related to molecular structure, leading to slightly different UV absorptions for any two conformers.
The survey ILSR spectra, related to the origin bands in the R2PI spectrum are shown in Fig. 4, emphasizing the slight Raman shifts which allowed this conformer classification. In fact, the R2PI spectrum includes origin transitions of the three conformers and also some vibronic transitions at higher frequencies for G1 and A2. Actually, a quite rich R2PI spectrum is observed for 4-FPEA, in contrast to that of PEA, which showed only four features, corresponding to the origins of four different conformers.9,10,20 Even so, the pattern observed here resembles that in 2-FPEA,28 exhibiting bands related to the origins and to the excited vibronic states.
As already mentioned above, some of the survey ILSR spectra, Fig. 3(e), (g), (j) and (k) include more complicated signatures. Essentially it could be noted that the signatures in Fig. 3(e) and (g) are a result of the contributions of two different species. Indeed, the weighted sum of the spectra in Fig. 3(b) and (c), also shown in panels (a) and (b) of Fig. 5, leads to the resultant spectrum in Fig. 5(c), which matches well the displayed measured spectrum in Fig. 5(d). This spectrum is equivalent to the one shown in Fig. 3(e), implying that it consists of contributions from both G1 and G2, as marked by the corresponding green and black asterisks. This is also pointed out above the feature (where the UV laser was parked on) at 37![[thin space (1/6-em)]](https://www.rsc.org/images/entities/char_2009.gif) 098 cm−1, which includes overlapping vibronic transitions labeled with the respective colored shifts.
098 cm−1, which includes overlapping vibronic transitions labeled with the respective colored shifts.
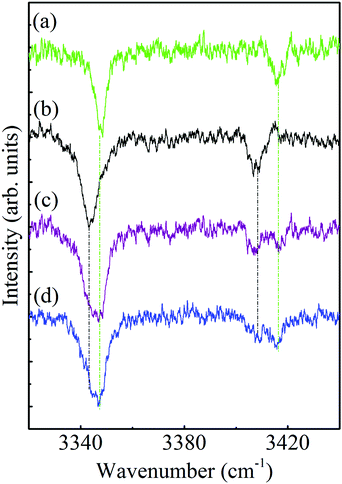 | ||
| Fig. 5 Ionization-loss stimulated Raman spectra in the amino group range of conformers (a) G1, (b) G2, (c) G1 + G2 and (d) that obtained when parking the ionization laser at 37 098 cm−1. | ||
Moreover, the survey spectrum in Fig. 3(g) contains even more features and is a result of involvement of G1 (labeled by green asterisks) and of some additional species, contributing four additional lines (magenta asterisks). These lines are similar to those observed in Fig. 3(j) and (k) and suggested to be probably related to a 4-FPEA-(H2O) cluster, but definitive assignment awaits approval, through comparison of the measured ILSR spectrum to the calculated Raman spectrum. It seems that although, only neat 4-FPEA was introduced into the TOFMS, the very low contamination of the system by water was enough to effectively produce hydrated species, i.e., 4-FPEA-(H2O) clusters. This indicates that the band at 37![[thin space (1/6-em)]](https://www.rsc.org/images/entities/char_2009.gif) 120 cm−1 in the R2PI spectrum, Fig. 2, corresponds to a vibronic transition of G1 (marked by the green shift) and to the origin of the water cluster (marked by magenta W). The two additional features in the R2PI spectrum, marked by magenta shifts, signify two vibronic states of the W cluster. Actually, these features in the R2PI and in the corresponding survey spectra, are a result of the photofragmentation of the parent ion, leading to their appearance in the 4-FPEA mass channel. The observation of photofragment ILSR spectrum agrees with our previous finding, where a PEA–H2O water cluster could be detected by measuring the ILSR spectrum of PEA.48
120 cm−1 in the R2PI spectrum, Fig. 2, corresponds to a vibronic transition of G1 (marked by the green shift) and to the origin of the water cluster (marked by magenta W). The two additional features in the R2PI spectrum, marked by magenta shifts, signify two vibronic states of the W cluster. Actually, these features in the R2PI and in the corresponding survey spectra, are a result of the photofragmentation of the parent ion, leading to their appearance in the 4-FPEA mass channel. The observation of photofragment ILSR spectrum agrees with our previous finding, where a PEA–H2O water cluster could be detected by measuring the ILSR spectrum of PEA.48
b. Ionization-loss stimulated Raman spectra
The three-color ILSR spectra, measured by employing the SR beams, with the ωS beam scanned over the 543–585 and 621–658 nm wavelength range, while fixing the delayed UV probe laser on the wavelengths corresponding to the band origin peaks (36![[thin space (1/6-em)]](https://www.rsc.org/images/entities/char_2009.gif) 963, 36
963, 36![[thin space (1/6-em)]](https://www.rsc.org/images/entities/char_2009.gif) 979 and 37
979 and 37![[thin space (1/6-em)]](https://www.rsc.org/images/entities/char_2009.gif) 060 cm−1) of the conformers of 4-FPEA, are shown in panels (a)–(c) of Fig. 6 and 7. The monitored traces exhibit almost constant ion background levels, due to the ionization of the 4-FPEA parent by the UV beam, and very sharp features pointing down. In addition, in Fig. 6(a), (b) and 7(a) some very intense lines pointing up are apparent. These pointing down or up features represent Raman transitions, at specific Raman shifts, related to loss or gain23,24,49,50 in the background signal, respectively. The loss signals are consequence of the depletion in the population of the lower level of the Raman transitions, while the gain lines rise from the ionization probing of the upper Raman-pumped level by the UV laser at 36
060 cm−1) of the conformers of 4-FPEA, are shown in panels (a)–(c) of Fig. 6 and 7. The monitored traces exhibit almost constant ion background levels, due to the ionization of the 4-FPEA parent by the UV beam, and very sharp features pointing down. In addition, in Fig. 6(a), (b) and 7(a) some very intense lines pointing up are apparent. These pointing down or up features represent Raman transitions, at specific Raman shifts, related to loss or gain23,24,49,50 in the background signal, respectively. The loss signals are consequence of the depletion in the population of the lower level of the Raman transitions, while the gain lines rise from the ionization probing of the upper Raman-pumped level by the UV laser at 36![[thin space (1/6-em)]](https://www.rsc.org/images/entities/char_2009.gif) 963 and 36
963 and 36![[thin space (1/6-em)]](https://www.rsc.org/images/entities/char_2009.gif) 979 cm−1.
979 cm−1.
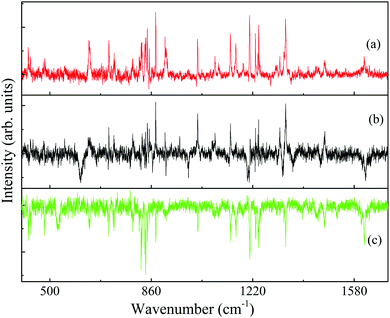 | ||
| Fig. 6 Ionization-loss stimulated Raman (lines pointing down) spectra of the conformers (a) A2, (b) G2 and (c) G1 of 2-(4-fluoro-phenyl)-ethylamine in the 400–1700 cm−1 spectral range, measured by parking the ultraviolet probe laser on the origin bands in the resonantly-enhanced two photon ionization spectrum, Fig. 2, and labeled accordingly. The observed gain lines in (a) and (b) result mainly from resonances of the G1 conformer. | ||
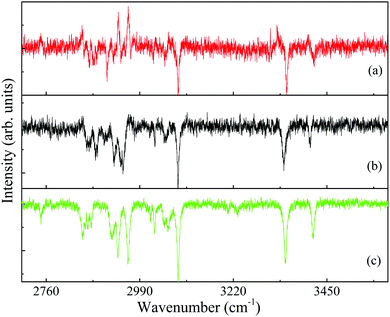 | ||
| Fig. 7 Ionization-loss stimulated Raman (lines pointing down) spectra of the conformers (a) A2, (b) G2 and (c) G1 of 2-(4-fluoro-phenyl)-ethylamine in the 2750–3500 cm−1 spectral range, measured by parking the ultraviolet probe laser on the origin bands in the resonantly-enhanced two photon ionization spectrum, Fig. 2, and labeled accordingly. The few gain lines in (a) and (b) result mainly from resonances of the G1 conformer. | ||
Actually, the loss lines dominate the high frequency range of the spectra of all three conformers, Fig. 7(a)–(c). On the other hand, the intense gain lines obscure and perturb some of the loss lines in the low frequency range, Fig. 6(a) and (b). The position of the Raman transitions that lead to most gain lines in Fig. 6(a) and (b) is identical, although they were obtained by ionization with different UV probe frequencies. The gain lines in the A2, Fig. 6(a), and G2, Fig. 6(b), spectra are situated at frequencies corresponding to those of the G1 loss lines, Fig. 6(c), inferring that the gain lines observed in the loss spectra of the less populated conformers are a result of the signal ensuing from the most populated G1 conformer of 4-FPEA.
For the identification of the 4-FPEA structures, we are interested in the loss lines, which led us to suppress the gain lines and to obtain the resulting broad range ILSR spectra of A2, G2 and G1, given in the top traces of panels (a), (b) and (c) of Fig. 8, respectively, and in the data of Table S1 of the ESI.† It is important to note that in addition to the loss lines, two exceptionally broad features with full-width half-maxima (FWHM) of about 13 cm−1, appearing at 610 and 528 cm−1 and marked by black and green asterisks in panels (b) and (c), are observed. This led us to conclude that they are not related to ILSR signals, but are features obtained by some other process. Indeed, by considering the energies of the involved photons, it turns out that these the features reflect the origin transitions of G2 and G1, which are obtained by interaction of the ωp, ωS and the UV photons with the 4-FPEA molecules and compatible with the features observed in the R2PI spectrum of Fig. 2. The two different visible (vis) photons, deplete some of the population of the ground electronic state, while promoting some of the molecules to the S1 state and leading to a loss in the signal due to a three-color vis–vis-UV HB process. This process is reminiscent of the two-color vis–vis–UV HB in tryptamine,23,24 where two similar ωS photons were involved.
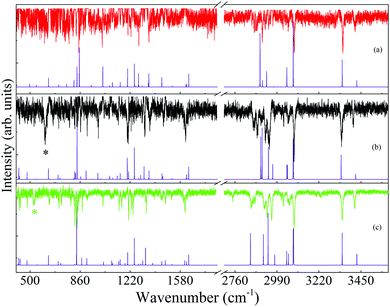 | ||
| Fig. 8 Ionization-loss stimulated Raman spectra, following screening of the gain lines, for the (a) A2, (b) G2 and (c) G1 conformers of 2-(4-fluoro-phenyl)-ethylamine in the 400–1700 and 2750–3500 cm−1 spectral ranges, measured by parking the ultraviolet probe laser on the origin bands in the resonantly-enhanced two photon ionization spectrum, Fig. 2, and labeled accordingly. Below each measured spectrum a calculated Raman spectrum with the closest agreement, is shown. The computed spectra were calculated at the M06-2X/6-311++G(d,p) level of theory for each conformer with scaling of the harmonic vibrational frequencies,28 conversion of the Raman activities to intensities22 and convoluting with Lorentzian lines of full width at half maximum of 0.5 cm−1. The black and green asterisks in (b) and (c) mark the features related to the three-color visible–visible-ultraviolet hole burning process with two different visible photons (ωp + ωS) and correspond to the origin transitions of G2 and G1, respectively. | ||
Despite the appearance of these two lines in the spectra, most lines are obtained due to the ILSRS, providing valuable rich data on three conformers of 4-FPEA. It was expected that by considering the energetic ordering of the calculated conformers and particularly by finding which of the calculated Raman spectra match best the different measured ILSR spectra it would be possible to recognize the involved structures.
c. The torsional potential energy surface and the energetic ordering of the 4-FPEA conformers
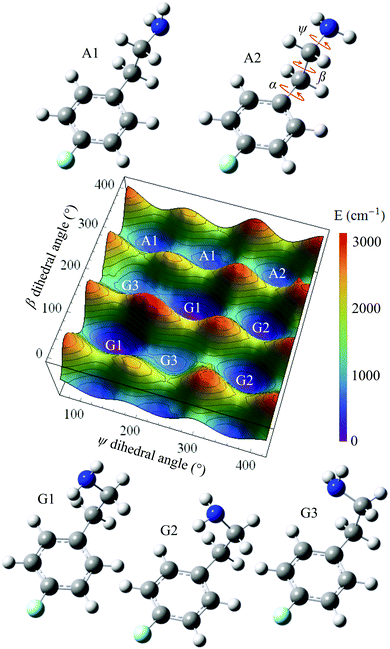
Starting from the A2 conformer of 4-FPEA (right corner of Fig. 9) a PES grid search was performed at the MP2/6-311++G(d,p) level of theory, while keeping the α dihedral angle fixed at 88.4° and changing the other dihedral angles, ψ and β, in the 0 to 400° range. Using this α is reasonable, considering that in the optimized structures of the 4-FPEA conformers it exhibits values of 98.3, 83.2, 88.0 and 77.3° for G2, G1, A1 and G3, respectively, indicating deviation of less than ±11° relative to the angle in A2. Hence, by varying ψ and β in steps of 10°, the resulting PES and the structures of the different conformers of 4-FPEA in the ground electronic state, S0, were obtained (see Fig. 9). The PES shows evidence for nine minima, including five core structures, where four of them have two equivalent PE minima and one a single minimum. This degeneracy in minima originates from the rotation around the ψ and β dihedral angles, and is related to structures that differ in both or in one of them. Three of the minima correspond to gauche structures, in which the amino group on the folded side chain is oriented in different directions toward the ring π electrons and the other two are related to anti structures where the side chain is extended away from the ring.As can be seen from Fig. 9, the structure of conformer G1 corresponds to the global minimum of the PES, while the other structures that include other side chain and NH2 group orientations, i.e., the G2, A1, A2 and G3 are higher in energy with variable gaps between them. Also, the conformers are separated from each other, and from the global minimum, by relatively high potential barriers. In particular, the anti conformers are separated by PE barriers close to 1000 cm−1 from each other and by considerably higher barriers from the G1 and G2 gauche conformers, see Table 1. The separation between the latter two conformers is somewhat lower and that between the G3 and G1 conformers is reduced even more, <300 cm−1. Since relatively high energy barriers exist between the four most stable conformers,31 it is reasonable to assume that relaxation between them during the adiabatic expansion might be excluded. As for G3, it would relax to G1 and it is likely that it could not be present in the jet expansion.
| A1 | A2 | G1 | G2 | G3 | |
|---|---|---|---|---|---|
| A1 | 944 | 1817 | 2747 | 1154 | |
| A2 | 989 | 2893 | 1779 | 2309 | |
| G1 | 1466 | 2497 | 1060 | 294 | |
| G2 | 2538 | 1525 | 1201 | 1052 | |
| G3 | 1359 | 2469 | 850 | 1466 |
d. Identification of the conformers of 4-FPEA existing in the molecular beam
The experimentally observed ILSR spectra and an enlarged portion of them, following gain lines removal, are presented in the top traces of Fig. 8(a)–(c) and Fig. 10(a)–(c), respectively. Although it is difficult to see at this scale, the spectra for each of the conformers show different patterns, in the high and low frequency ranges. Upon comparison of the experimentally observed ILSR spectra to the scaled harmonic Raman spectra, calculated at the M06-2X/6-311++G(d,p) and B3LYP/6-311++G(d,p) levels of theory, the former seemed to somewhat better fit the observed spectra and therefore were chosen to be presented here. The calculated spectra of the highest compatibility with each of the measured spectra, are shown in the corresponding bottom traces, Fig. 8(a)–(c) and Fig. 10(a)–(c), implying that the conformational assignments correspond to the A2, G2 and G1 conformers of 4-FPEA, respectively.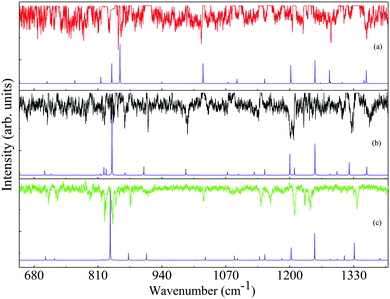 | ||
| Fig. 10 Expanded portion of the measured ionization-loss stimulated Raman spectra (top traces) compared to the calculated (bottom traces) Raman spectra of the A2 (a), G2 (b) and G1 (c) conformers of the 2-(4-fluoro-phenyl)-ethylamine in the 615–1400 cm−1. The presented calculated spectra are at the M06-2X/6-311++G(d,p) level of theory with scaled harmonic vibrational frequencies,29 Raman activities converted to intensities22 and convoluted with Lorentzian lines of full width at half maximum of 0.5 cm−1. | ||
This assignment is actually based on comparison of the positions, intensities (somewhat less reliable and still challenging in the quantum chemical calculations) and patterns exhibited in the high- and low-frequency ranges in the measured and calculated spectra for the different conformers. It turns out that some of the features appear at quite constant frequencies, while others are shifted, depending on the structures that they represent. For example, in the high-frequency range, which includes stretches of N–H, C–Hs of the aromatic ring and C–Hs of the ethylamino group, the N–H stretches show different Raman shifts, while the C–H stretches of the ring and of the side chain different patterns being sensitive to the conformations of 4-FPEA.
In particular the antisymmetric and symmetric N–H stretches of A2, G2 and G1, Fig. 8(a)–(c) are situated in the experimentally observed spectra at the respective frequencies of 3418 and 3351, 3409 and 3344 along with 3416 and 3348 cm−1, which correspond to those in the calculated spectra at 3419 and 3347, 3409 and 3342 along with 3416 and 3347 cm−1 (see the data of Table S1 of the ESI†). Essentially, the bands related to the symmetric and antisymmetric N–H stretches in the measured and calculated spectra of G2 are shifted to the red compared to the other two structures. This kind of frequency shift for the symmetric N–H stretch is considered to be a result of the interaction of the amino group with the ring that pulls out electron density from the N–H bond, thus elongating it and forming an N–H⋯π-type hydrogen-bond (see below). Usually, this interaction leads to structural stabilization and it is interesting to note that in the most stable conformer, G1, of 4-FPEA the red shift of the N–H stretch in the measured spectrum is less than in G2 and in the calculated spectrum it is not shifted at all compared to the A2 conformer, implying that this interaction fulfills only a minor role in the stabilization of G1. This differs from the behavior in PEA20 and in 2-FPEA,28 where the G1 and G2 as well as the G1h and G2h conformers showed almost similar red shifts, with respect to the anti conformers.
As for the C–H stretches of the ring and of the alkyl group in 4-FPEA, they mainly exhibit different patterns in the spectra of the various conformers. In fact, for both of them four transitions are expected, associated to distinctive symmetric and antisymmetric C–H stretches in the ring and in the CH2 groups. Nevertheless, in the experimentally observed ILSR spectra, a different number of features is encountered in the range corresponding to the C–H stretches of the ring. Referring to the first two or three features, appearing close to 3085 and 3050 cm−1, it can be seen that in each of the measured ILSR spectra, Fig. 8(a)–(c), the feature of highest frequency is the most prominent, while the other are somewhat less intense. It is interesting to note that the prominent features are characterized by FWHM of 6.7, 5.1 and 4.0 cm−1 and the less intense ones show relatively high (∼10 cm−1), intermediate and no splitting, while passing from G1 to G2 and to A2, respectively. A closer inspection into the calculated spectra reveals that the dominant lines include two features, related to two distinctive symmetric C–H stretches of the ring in G1 and G2 and to a symmetric and antisymmetric C–H stretch in A2, separated by 2.19, 1.72 and 0.04 cm−1, respectively. As for the less intense features, they correspond to two types of antisymmetric C–H stretches of the ring in G1 and G2 and to an antisymmetric and symmetric C–H stretch in A2 and they are separated by 9.91, 3.15 and 0.33 cm−1, respectively. This behavior, where the tendency of separation in the dominant and less intense lines decreases, is compatible with that observed in the experimentally observed spectra. Actually, in these spectra no splitting was observed in the dominant features, probably due to the insufficient spectral resolution, but yet their FWHM decreased, and the splitting between the less intense lines decreased while going from conformer G1 to G2 and to A2.
The calculated spectra of the C–H stretches of the ethylamino side chain of 4-FPEA in the 2820–2990 cm−1 range, displayed in Fig. 8(a)–(c), show unique patterns as well, including a triplet separated from a highest Raman shifted line, two doublets with different separations and a triplet separated from a very weak lowest frequency line, respectively. These patterns match quite well those appearing in the experimentally observed ILSR spectra of the C–H stretches. Even in the spectrum of the A2 conformer, Fig. 8(a), which is extensively perturbed by the gain lines in this range, Fig. 7(a), a triad of very sharp lines is observed. Actually, the different observed patterns for the C–H stretches in the measured spectra and their matching to the calculated spectra, confirm their sensitivity to the amino group orientation.
In addition, to the above discussed bands in the high frequency range, some weak features, measured at 3230, 3207, 3026 and 2747 cm−1 appear in Fig. 8(c) and at 3026 [Fig. 8(a) and (b)] and 2760 cm−1 [Fig. 8(b)]. These transitions were not predicted by the scaled harmonic Raman spectra, which do not account for anharmonic couplings and local mode mixing, of any of the 4-FPEA conformers. Therefore, they are considered to be a result of Fermi resonances that couple the stretches with overtones and combination bands in the respective groups. The involvement of these resonances, might also rationalize the fact that quantitative agreement between the experimentally observed ILSR spectra and the calculated Raman spectra could not be obtained at this stage.
The identification of the conformers of 4-FPEA in the molecular beam is also greatly assisted by the comparison of the experimentally observed ILSR, Fig. 6 and 8, and calculated Raman spectra, Fig. 8, in the low frequency range. In particular, the intense and the weak features in the experimentally observed spectrum of G1, Fig. 8(c), are well matched by the calculated Raman spectrum that includes lines related to a variety of collective motions. In the other conformers, G2 and A2 in Fig. 8(b) and (a), the measured spectra are somewhat perturbed by the gain lines. For example, the feature around 1615 is completely missing in the top trace of Fig. 8(a) and of 1240 cm−1 in Fig. 8(a) and 8(b), due to the gain lines resulting from the G1 conformer, appearing with similar Raman shifts. Nevertheless, some characteristic ILSR features clearly point to the existence of a particular conformer, i.e., the doublet and singlet at ∼1200 cm−1 and the characteristic patterns in the 780–940 cm−1 range in panels (b) and (a) of Fig. 10, respectively. In addition, the frequency increases in the order 992 < 1020 < 1024 cm−1 for the mode appearing in the spectra of the three conformers, G2, A2 and G1, Fig. 10(b), (a) and (c), respectively. This trend is very well reproduced by the calculated Raman shifts 989 < 1023 < 1028 cm−1 for the same conformers. By considering the geometries of the conformers and the involved collective motions of the atoms, it can be seen that the normal modes of the vibrations, represented with the displacement vectors generated by Gaussview,42Fig. 11, exhibit very different movements in the various conformers. While in G1, Fig. 11(c), and in G2, Fig. 11(b), there is some out-of-plane movement of the C–H groups of the ring and mainly movement of the alkyl moieties of the tail, in A2, Fig. 11(a), the movement is governed by C–C stretch and out-of-plane motions of C–Hs. Because of the extended chain in the A2 conformer, this movement seems very possible, but it is extensively hindered in the other conformers, leading to completely different motions.
e. Spectral signatures, energetics and structures
The different sets of experimentally obtained spectroscopic data and their comparison to the results of the calculated spectra revealed the presence of three conformers of 4-FPEA, i.e., G1, G2 and A2, in the molecular beam. It is quite surprising that the A1 conformer was not observed in the measured R2PI and ILSR spectra, particularly if the energetic ordering of the conformers is taken into account. As can be seen from the relative energies of the conformers of 4-FPEA, calculated at the MP2/6-311++G(d,p) level of theory with corrections for zero-point vibrational energies from M06-2X/6-311++G(d,p), shown in Fig. 12, the A1 conformer is predicted to be situated at a lower energy than the A2 conformer. Considering that the abundances of the conformers are expected to follow the trend of their relative energies, Fig. 12, and that population transfer to the lower energy conformers is unlikely (see the calculated PES in Fig. 9 and the data of Table 1) one would expect observation of A1. Furthermore, since the A1(A1h) and A2 conformers of PEA20 and 2-FPEA,27,28 respectively, could be detected in their molecular beams and their predicted energies, Fig. 12, are very close to that of the A1 conformer of 4-FPEA, it was anticipated that the latter should also be present, but despite our efforts we could not find it.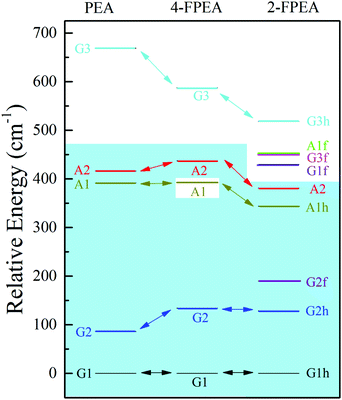 | ||
| Fig. 12 Relative energies, calculated at the MP2/6-311++G(d,p) level of theory with corrections for zero-point vibrational energies from M06-2X/6-311++G(d,p), of the different conformers of 2-phenylethylamine (PEA) (ref. 20), 2-(4-fluoro-phenyl)-ethylamine (4-FPEA) and 2-(2-fluoro-phenyl)-ethylamine (2-FPEA) (ref. 28). The conformers of the different compounds, appearing above the light blue background were detected in their molecular beams. G and A refer to the gauche and anti orientations of the side chain, respectively; 1, 2 and 3 indicate the energetic order due to the different positions of the amino group; and h and f represent the amino group pointing toward the hydrogen atom (opposite to the fluorine) and toward the fluorine atom, respectively. | ||
A plausible reason that could be suggested is based on the R2PI spectra of 4-FPEA and PEA.48 The pattern exhibited by the 4-FPEA conformer origins in the R2PI spectrum of the S1 ← S0 band, Fig. 2, resembles very much that of PEA.48 Actually, in both spectra a small separation is observed between the low frequency conformers, A2 and G2 and a larger one to the most stable conformer, G1. As for the A1 conformer of PEA, a displacement of about 37 cm−1 above the frequency of G1 was observed,48 but in case of 4-FPEA, it could not be uncovered, since this region of the spectrum is seeded with vibronic bands that probably overlapped it.
It is important to note that the fluorination at the para position in 4-FPEA preserved the shapes of the conformers of the nonsubstituted PEA, setting the A1 conformers at almost similar energies in both compounds and destabilizing to some extent the G2 and A2 conformers in 4-FPEA, see Fig. 12. This implies that the attachment of a strongly electronegative atom did not affect the conformational landscape of 4-FPEA, even upon a change in the electron distribution. Fig. 13, shows the ESP maps, which provide qualitative visualization of relative charge distributions for the G1, G2, A1 and A2 conformers of 4-FPEA [(a)–(d)] and PEA [(e)–(h)]. In these maps deepest red and blue indicate electron-rich and -poor regions of −0.01 and 0.01 a.u., respectively, and they also include the respective molecular structures embedded in them. As can be seen from the maps of 4-FPEA and PEA, the charge distributions in the region of the ring and chain are affected by the fluorine atom presence. In fact, localization of a negative potential site over fluorine leads to somewhat smaller negative and larger positive regions on the ring and side chain, respectively, depending on the specific conformer. As for the negative potentials situated on the nitrogen, they seem to be quite similar for the respective conformers in 4-FPEA and PEA.
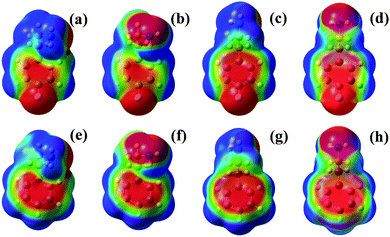 | ||
| Fig. 13 Electrostatic maps of the G1, G2, A1 and A2 conformers of 4-FPEA [(a)–(d)] and PEA [(e)–(h)]. Surface potential ranges are −0.01 a.u. (red) to 0.01 a.u. (blue) and the isovalue is 0.0004 a.u. | ||
Actually, based on the ESP maps, it can be suggested that like in PEA the polar and somewhat less polar hydrogen atoms, bonded to the nitrogen and pointing toward the ring in the G1 and G2 conformers of 4-FPEA, respectively, can participate in the hydrogen-bonds. In the anti conformers, it is unlikely that a hydrogen-bond will be formed due to the very large separation between the amino hydrogen atoms and the negative region on the ring. Anyhow, since a reduced negative region of the potential appears on the ring of the gauche conformers of 4-FPEA, which is somewhat departed from the amino hydrogen, a weaker N–H⋯π bonding interaction might be expected compared to that in PEA. Hence, the ESP maps show that fluorine substitution at the para position, being far away from the amino group, only slightly affects the conformational landscape relative to that of the unsubstituted PEA. This differs from the situation in 2-FPEA,27,28 where the fluorine atom is close to the side chain and from the ESP maps and the distances between the interacting moieties, it was suggested that the interplay between four bonding interactions [N–H⋯π, N–H⋯F, C–H⋯F, and N(lp)⋯H, involving the lone pair (lp) of nitrogen] and a repulsive one [N(lp)⋯F(lp)] determine the conformational PES.
The encountered behavior in 2-FPEA and 4-FPEA, resembles that observed in fluorine substituted protonated PEA (H+PEA).29,30 Essentially, H → F substitution at the ortho position led to strong interaction with the protonated ethylammonium side chain and consequently to a complex conformational landscape, while substitution at the meta and para positions showed only a minor impact on the conformational PES of H+PEA, since the F atom is too distant to allow for significant interactions with the side chain. The main stabilization of the gauche conformers, relative to the extended anti conformers came from an intramolecular noncovalent cation–π (NH+⋯π) interaction. On the other hand, in orthoF-H+PEA, the F atom, interacted with the side chain, so that the subtle competition between the NH+⋯F and NH+⋯π interactions produced a variety of different gauche conformers, that exhibited rather different strengths of both interactions.
The interpretation of the results can be also assisted by the NBO analysis at the M06-2X/6-311++G(d,p) level. Following this analysis, the data of Table S2 of the ESI† and Table 2, which show the absolute values of partial charge located on a specific atom, and the donor–acceptor orbital interactions and their perturbation energies, E(2), involved in stabilizing the observed conformers of 4-FPEA and PEA were obtained. As expected, it is obvious from Table S2 of the ESI,† that the nitrogen and carbon atoms in the PEA conformers hold negative charges, while the hydrogen atoms positive ones. In the 4-FPEA conformers most of the atoms behave similarly, except the C(4) which possess positive charges and are bonded to the negative charged fluorine atoms. Actually, the charges show a delicate response to the changes in the molecular structures, yet all of them are characterized by largest values of negative and positive charges, positioned on the nitrogen and the hydrogen atoms, respectively.
| 4-FPEA | PEA | |||||||
|---|---|---|---|---|---|---|---|---|
| G1 | G2 | A1 | A2 | G1 | G2 | A1 | A2 | |
| πring → πring* | 173.32 | 172.04 | 173.86 | 174.08 | 172.96 | 171.99 | 173.83 | 173.98 |
| σring → σring* | 117.37 | 117.35 | 117.07 | 117.00 | 136.67 | 136.59 | 136.35 | 136.30 |
| σC1C7 → σring* | 22.50 | 22.68 | 22.62 | 22.68 | 22.23 | 22.42 | 22.35 | 22.44 |
| nF → πCCring* | 20.86 | 20.99 | 20.83 | 20.86 | ||||
| nF → σCCring* | 15.96 | 16.01 | 15.96 | 15.98 | ||||
| σCCring → σC4F* | 12.64 | 12.60 | 12.62 | 12.60 | ||||
| nN → σchain* | 11.79 | 14.36 | 11.78 | 14.04 | 11.85 | 14.26 | 11.69 | 13.05 |
| σCCring → σC7H* | 9.83 | 9.82 | 9.82 | 9.82 | 9.84 | 9.84 | 10.45 | 9.87 |
| σC1C7 → σC7H* | 8.47 | 8.33 | 3.54 | 3.64 | 9.03 | 8.88 | 3.63 | 3.74 |
| σCCchain → πCCring* | 6.86 | 6.96 | 6.65 | 6.80 | 7.81 | 8.06 | 7.95 | 8.07 |
| σNH → σC8H* | 6.76 | 13.75 | 6.82 | 13.78 | 6.71 | 13.72 | 6.81 | 13.74 |
| σCHchain → σCHchain* | 5.77 | 5.85 | 11.74 | 11.70 | 5.76 | 5.85 | 11.74 | 11.72 |
| σC7H12 → σCN* | 5.15 | 5.47 | 0.00 | 0.00 | 5.15 | 5.49 | 0.00 | 0.00 |
| σCCchain → σNH20* | 5.09 | 0.00 | 4.81 | 0.00 | 5.14 | 0.00 | 4.81 | 0.00 |
| σC7H → πCCring* | 3.87 | 3.92 | 4.02 | 3.98 | 3.98 | 4.04 | 3.42 | 3.96 |
| σC4F → σCCring* | 2.50 | 2.50 | 2.49 | 2.50 | ||||
| σCCchain → σCCring* | 0.88 | 1.07 | 1.26 | 1.24 | 0.00 | 0.52 | 0.00 | 0.00 |
| πCCring → σCN* | 0.00 | 0.00 | 0.63 | 0.61 | 0.00 | 0.00 | 0.63 | 0.61 |
| σC1C7 → σCN* | 0.00 | 0.00 | 3.92 | 4.02 | 0.00 | 0.00 | 3.93 | 4.02 |
The N–H bonds participate as donors in the hydrogen-bonds,51–53 while partly sharing the hydrogen atom between the relatively electronegative nitrogen atoms and the π-systems of the phenyl rings, which play the role of acceptors, in the 4-FPEA and PEA conformers. In fact, the sum of charges on the phenyl ring, see Table S2 of the ESI,† follows the trend −0.041130e <−0.044170e >−0.033310e <−0.034060e for the G1, G2, A1 and A2 conformers of 4-FPEA and a similar one −0.037640e <−0.040420e >−0.029610e <−0.030550e for the respective conformers of PEA. These sums of charges are somewhat higher in 4-FPEA, but yet they are highest in the G1 and G2 conformers of both compounds, which might be a manifestation of the role played by electrostatic interactions and their involvement in the hydrogen-bonds. Moreover, the highest charge in the G2 conformer of 4-FPEA might be the driving force to the largest red shift in the N–H stretch, albeit the distance of the N–H to the center of the phenyl group is higher, 3.362 Å, than that in the G1 conformer, 3.278 Å.
The results of the NBO analysis, Table 2, give detailed quantitative insight into the hyperconjugation contributions for the interactions involved in stabilizing the observed conformers of 4-FPEA and PEA. Comparison of the available data provides information on the nature and strength of these interactions in the fluorinated and bare PEA and as a function of the side chain conformation. Except the large interactions of the atoms in the rings, which are quite similar, there are specific interactions like that of σC1C7 → σC7CH* which show larger delocalization in the G1 and G2 than in A1 and A2 conformers (8.47, 8.33, 3.54 and 3.64 kcal mole−1) of 4-FPEA and even higher (9.03, 8.88, 3.63 and 3.74 kcal mole−1) in PEA. In addition, the σC7H, is more delocalized into the σCN* in the G1 (5.15 and 5.15 kcal mole−1) and G2 (5.47, 5.49 kcal mole−1) conformers of 4-FPEA and PEA than in the anti conformers of both compounds, which show values of 0 kcal mole−1. These interactions allude to the role of the side chain conformation in inducing better overlap between particular donor and acceptor orbitals. It is interesting to note that the G1 and A1 conformers of 4-FPEA (5.09 and 4.81 kcal mole−1) and PEA (5.14 and 4.81 kcal mole−1) show large localization of the σCCchain into the σNH* orbital, compared to no localization in the additional conformers.
Moreover, as mentioned above, the formation of hydrogen-bonds in the different conformers has been further explored in framework of the AIM theory.46 According to this theory, the nature of bonding between atoms can be characterized by the value of the electron density at specific points, ρ(r), and the sign of its Laplacian, ∇2ρ(r), at critical points (CPs). The AIM analysis for the obtained ground state optimized geometries of the conformers of 4-FPEA and PEA, revealed bond critical points (BCP) between the atoms that possess large ρ(r) with negative ∇2ρ(r) values, typical to appreciable interactions between the atoms, i.e., covalent bonds. In addition, a ring critical point (RCP), positioned in the center of the phenyl ring in each of the structures was found. This point is related to minimum electron density within the ring surface and a maximum on the ring line. The values of ρ(r) and ∇2ρ(r) for these points, Table 3, are very slightly higher and lower, respectively, for the gauche conformers than for the anti ones, implying that they might suggest hydrogen-bonds formation in the former conformers of 4-FPEA and PEA, since the N–H bond is directed toward the RCP. It is likely that the electron density at the RCP and the Laplacian of the intensity correspond to the favorable geometries for intramolecular hydrogen-bonding in the gauche conformers of both compounds, as evidenced by their ILSR spectra, shown here and in ref. 20.
| 4-FPEA | PEA | |||||||
|---|---|---|---|---|---|---|---|---|
| G1 | G2 | A1 | A2 | G1 | G2 | A1 | A2 | |
| ρ | 0.022406 | 0.022401 | 0.022388 | 0.022370 | 0.022518 | 0.022517 | 0.022487 | 0.022505 |
| ∇2ρ | 0.165051 | 0.165040 | 0.165123 | 0.165130 | 0.166100 | 0.166102 | 0.166183 | 0.166159 |
It is worth noting that while AIM analysis has been extensively applied in many molecular systems, for instance those in ref. 54, 55, 56 and it is generally accepted, some criticism regarding the meaning of the results still exists.57 This is particularly true for the application of AIM theory to systems with weak long-range bonds, where either an intuitive bond does not exhibit a BCP, or a BCP occurs without apparent bonding interaction.57,58 The former case was observed for intramolecular hydrogen-bonds and it seems that the absence of a BCP should not necessarily be considered as evidence to the lack of a chemical bond.
4. Summary
The conformational properties of gas phase isolated 4-FPEA molecules, with the fluorine atom at a remote position from the ethylamino side chain, has been explored and directly revealed by the use of R2PI and ILSR spectroscopies. ILSRS allowed monitoring three conformer specific vibrational spectra in the low- and high-frequency regions, providing information on the collective and the localized vibrational motions, respectively. Comparison of these spectra to scaled harmonic Raman spectra, computed by dispersion-corrected DFT calculations at the M06-2X/6-311++G(d,p) level, allowed to elucidate the spectral signatures and the delicate differences between them. The interpretation of the results was further supported by the results of additional quantum chemical calculations, including the energetics of the conformers, the torsional PES and the NBO and AIM analyses. These considerations allowed structural assignment of the conformers of 4-FPEA that indicated the presence of two gauche conformers, G1 and G2, and one anti, A2, even though the more stable anti conformer, A1, could not be found in the sampled molecular beam. It was inferred that substitution of a single hydrogen atom by fluorine, at the para-position, only slightly affects the conformational properties of 4-FPEA, through slight destabilization of the G2 and A2 conformers, with respect to the similar ones in PEA. This contrasts the behavior encountered in 2-FPEA,27,28 where the fluorine atom was in close proximity to the side chain, increasing the number of conformers, slightly modifying the energetic ordering and the energy gaps between them. While in 4-FPEA and PEA, the folded gauche conformers were stabilized by an intramolecular (NH···π) interaction relative to the extended anti conformers, in 2-FPEA the interplay between the hydrogen-bonds and the repulsive interactions, exerted a delicate stabilizing effect that increased the number of conformers. Moreover, the NBO analysis indicated the importance of the side chain conformation in promoting better overlap between particular donor and acceptor orbitals. The behavior of the neutral fluorinated PEA resembles that observed in the fluorine substituted protonated PEA.29 Additionally, the trends shown by the density characteristics of the RCPs in the gauche conformers of 4-FPEA and FPEA, which correspond to the favorable geometries for intramolecular hydrogen-bonding and to the findings of the ILSR spectra might provide some indication for these interactions. On the other hand, the absence of BCPs in these structures should not be considered as a proof for the lack of hydrogen-bonds, implying that a more delicate measure is required. Finally, it is suggested that site-specific fluorination altered the electron density in the molecule and provided the means to fine tune the conformational properties of 4-FPEA, compared to 2-FPEA, and to sense the subtle changes in ILSR spectra of the different conformers.Acknowledgements
We thank Otto Dopfer for fruitful discussions. Financial support of this research by the United States – Israel Binational Science Foundation (BSF) under Grant 2014370, the German-Israeli Foundation for Scientific Research and Development (G.I.F) under Grant No. 1164-158.5/2011 and the Israel Science Foundation (ISF) founded by The Israel Academy of Science and Humanities under Grant No. 519/15.References
- K. Müller, C. Faeh and F. Diederich, Science, 2007, 317, 1881–1886 CrossRef PubMed.
- D. O'Hagan, Chem. Soc. Rev., 2008, 37, 308–319 RSC; K. Müller, C. Faeh and F. Diederich, Science, 2007, 317, 1881–1886 CrossRef PubMed.
- S. Purser, P. R. Moore, S. Swallow and V. Gouverneur, Chem. Soc. Rev., 2008, 37, 320–330 RSC.
- E. Bogdan, G. Compain, L. Mtashobya, J.-Y. Le Questel, F. Besseau, N. Galland, B. Linclau and J. Graton, Chem. – Eur. J., 2015, 21, 11462–11474 CrossRef CAS PubMed.
- Y. Zhou, J. Wang, Z. Gu, S. Wang, W. Zhu, J. L. Aceñ, V. A. Soloshonok, K. Izawa and H. Liu, Chem. Rev., 2016, 116, 422–518 CrossRef CAS PubMed.
- S. J. Marinez III, J. C. Alfano and D. H. Levy, J. Mol. Spectrosc., 1993, 158, 82–92 CrossRef.
- P. D. Godfrey, L. D. Hatherley and R. D. Brown, J. Am. Chem. Soc., 1995, 117, 8204–8210 CrossRef CAS.
- S. Sun and E. R. Bernstein, J. Am. Chem. Soc., 1996, 118, 5086–5095 CrossRef CAS.
- J. A. Dickinson, M. R. Hockridge, R. T. Kroemer, E. G. Robertson, J. P. Simons, J. McCombie and M. Walker, J. Am. Chem. Soc., 1998, 120, 2622–2632 CrossRef CAS.
- M. R. Hockridge and E. G. Robertson, J. Phys. Chem. A, 1999, 103, 3618–3628 CrossRef CAS.
- J. Yao, H. S. Im, M. Foltin and E. R. Bernstein, J. Phys. Chem. A, 2000, 104, 6197–6211 CrossRef CAS.
- R. Weinkauf, F. Lehrer, E. W. Schlag and A. Metsala, Faraday Discuss., 2000, 115, 363–381 RSC.
- J. R. Carney and T. S. Zwier, J. Phys. Chem. A, 2000, 104, 8677–8688 CrossRef CAS.
- W. Caminati, Phys. Chem. Chem. Phys., 2004, 6, 2806–2809 RSC.
- M. Schmitt, M. Böhm, C. Ratzer, C. Vu, I. Kalkman and W. L. Meerts, J. Am. Chem. Soc., 2005, 127, 10356–10364 CrossRef CAS PubMed.
- J. R. Clarkson, B. C. Dian, L. Moriggi, A. DeFusco, V. McCarthy, K. D. Jordan and T. S. Zwier, J. Chem. Phys., 2005, 122, 214311 CrossRef PubMed.
- T. Nguyen and D. W. Pratt, J. Chem. Phys., 2006, 124, 054317 CrossRef PubMed.
- J. C. López, V. Cortijo, S. Blanco and J. L. Alonso, Phys. Chem. Chem. Phys., 2007, 9, 4521–4527 RSC.
- M. Böhm, R. Brause, C. Jacoby and M. Schmitt, J. Phys. Chem. A, 2009, 113, 448–455 CrossRef PubMed.
- A. Golan, N. Mayorkas, S. Rosenwaks and I. Bar, J. Chem. Phys., 2009, 131, 024305 CrossRef PubMed.
- S. Melandri, A. Maris, B. M. Giuliano, L. B. Favero and W. Caminati, Phys. Chem. Chem. Phys., 2010, 12, 10210–10214 RSC.
- I. A. Lobo, D. J. D. Wilson, E. Bieske and E. G. Robertson, Phys. Chem. Chem. Phys., 2012, 14, 9219–9229 RSC.
- N. Mayorkas, S. Izbitski, A. Bernat and I. Bar, J. Phys. Chem. Lett., 2012, 3, 603–607 CrossRef CAS PubMed.
- N. Mayorkas, A. Bernat, S. Izbitski and I. Bar, J. Chem. Phys., 2013, 138, 124312 CrossRef PubMed.
- M. Wilke, C. Brand, J. Wilke and M. Schmitt, Phys. Chem. Chem. Phys., 2016, 18, 13538–13545 RSC.
- R. Karaminkov, S. Chervenkov and H. J. Neusser, Phys. Chem. Chem. Phys., 2008, 10, 2852–2859 RSC.
- S. Melandri, A. Merloni and A. Maris, ChemPhysChem, 2012, 13, 3504–3509 CrossRef CAS PubMed.
- N. Mayorkas, H. Sachs, M. Schütz, S. Ishiuchi, M. Fujii, O. Dopfer and I. Bar, Phys. Chem. Chem. Phys., 2016, 18, 1191–1201 RSC.
- M. Schütz, A. Bouchet, B. Chiavarino, M. E. Crestoni, S. Fornarini and O. Dopfer, Chem. – Eur. J., 2016, 22, 8124–8136 CrossRef PubMed.
- M. Schütz, A. Bouchet and O. Dopfer, Phys. Chem. Chem. Phys., 2016, 18, 26980–26989 RSC.
- E. G. Robertson and J. P. Simons, Phys. Chem. Chem. Phys., 2001, 3, 1–18 RSC.
- T. S. Zwier, J. Phys. Chem. A, 2001, 105, 8827–8839 CrossRef CAS.
- M. Mons, I. Dimicoli and F. Piuzzi, Int. Rev. Phys. Chem., 2002, 21, 101–135 Search PubMed.
- M. S. de Vries and P. Hobza, Annu. Rev. Phys. Chem., 2007, 58, 585–612 CrossRef CAS PubMed.
- G. V. Hartland, B. F. Henson, V. A. Venturo, R. Hertz and P. M. Felker, J. Opt. Soc. Am. B, 1990, 7, 1950–1959 CrossRef CAS.
- Avogadro: an open-source molecular builder and visualization tool, Version 1. 00, see http://avogadro.openmolecules.net/; M. D. Hanwell, D. E. Curtis, D. C. Lonie, T. Vandermeersch, E. Zurek and G. R. J. Hutchison, J. Cheminf., 2012, 4, 17 CAS.
- M. J. Frisch, G. W. Trucks, H. B. Schlegel, G. E. Scuseria, M. A. Robb, J. R. Cheeseman, G. Scalmani, V. Barone, B. Mennucci, G. A. Petersson, H. Nakatsuji, M. Caricato, X. Li, H. P. Hratchian, A. F. Izmaylov, J. Bloino, G. Zheng, J. L. Sonnenberg, M. Hada, M. Ehara, K. Toyota, R. Fukuda, J. Hasegawa, M. Ishida, T. Nakajima, Y. Honda, O. Kitao, H. Nakai, T. Vreven, J. A. Montgomery Jr, J. E. Peralta, F. Ogliaro, M. Bearpark, J. J. Heyd, E. Brothers, K. N. Kudin, V. N. Staroverov, R. Kobayashi, J. Normand, K. Raghavachari, A. Rendell, J. C. Burant, S. S. Iyengar, J. Tomasi, M. Cossi, N. Rega, J. M. Millam, M. Klene, J. E. Knox, J. B. Cross, V. Bakken, C. Adamo, J. Jaramillo, R. Gomperts, R. E. Stratmann, O. Yazyev, A. J. Austin, R. Cammi, C. Pomelli, J. W. Ochterski, R. L. Martin, K. Morokuma, V. G. Zakrzewski, G. A. Voth, P. Salvador, J. J. Dannenberg, S. Dapprich, A. D. Daniels, Ö. Farkas, J. B. Foresman, J. V. Ortiz, J. Cioslowski and D. J. Fox, Gaussian 09, revision C.01, Gaussian, Inc., Wallingford, CT, 2010 Search PubMed.
- C. Lee, W. Yang and R. G. Parr, Phys. Rev. B: Condens. Matter Mater. Phys., 1988, 37, 785–789 CrossRef CAS.
- A. D. Becke, Phys. Rev. A: At., Mol., Opt. Phys., 1988, 38, 3098–3100 CrossRef CAS.
- Y. Zhao and D. G. Truhlar, Theor. Chem. Acc., 2008, 120, 215–241 Search PubMed.
- C. Møller and M. S. Plesset, Phys. Rev., 1934, 46, 618–622 CrossRef.
- R. Dennington II, T. Keith and J. Millam, K. Eppinnett, W. L. Hovell and R. Gilliland, GaussView,Version 3.09, Semichem Inc., Shawnee Mission, KS, 2003 Search PubMed.
- S. E. Wheeler and K. N. Houk, J. Chem. Theory Comput., 2009, 5, 2301–2312 CrossRef CAS PubMed.
- A. E. Reed, L. A. Curtiss and F. Weinhold, Chem. Rev., 1988, 88, 899–926 CrossRef CAS.
- E. D. Glendening, A. E. Reed, J. E. Carpenter and F. Weinhold, NBO 3.1, Theoretical Chemistry Institute, University of Wisconsin, Madison, 2013 Search PubMed.
- R. F. W. Bader, Atoms in Molecules: A Quantum Theory, Clarendon Press, Oxford, UK, 2000 Search PubMed.
- T. A. Keith and T. K. Gristmill, AIMAll (Version 16.10.31), Software, Overland Park KS, USA, 2016 (http://aim.tkgristmill.com) Search PubMed.
- N. Mayorkas, S. Cohen, H. Sachs and I. Bar, RSC Adv., 2014, 4, 58752–58757 RSC.
- V. A. Venturo and P. M. Felker, J. Phys. Chem., 1993, 97, 4882–4886 CrossRef CAS.
- T. Kim and P. M. Felker, J. Phys. Chem. A, 2007, 111, 12466–12470 CrossRef CAS PubMed.
- P. Hobza and Z. Havlas, Chem. Rev., 2000, 100, 4253–4264 CrossRef CAS PubMed.
- S. Melandri, Phys. Chem. Chem. Phys., 2011, 13, 13901–13911 RSC.
- I. V. Alabugin, M. Manoharan, S. Peabody and F. Weinhold, J. Am. Chem. Soc., 2003, 125, 5973–5987 CrossRef CAS PubMed.
- B. K. Paul, S. Mahanta, R. B. Singh and N. Guchhait, J. Phys. Chem. A, 2010, 114, 2618–2627 CrossRef CAS PubMed.
- B. K. Paul and N. Guchhait, J. Lumin., 2011, 131, 1918–1926 CrossRef CAS.
- B. K. Paul and N. Guchhait, Comput. Theor. Chem., 2011, 966, 250–258 CrossRef CAS.
- J. R. Lane, J. Contreras-García, J.-P. Piquemal, B. J. Miller and H. G. Kjaergaard, J. Chem. Theory Comput., 2013, 9, 3263–3266 CrossRef CAS PubMed.
- P. Cassam-Chenai and D. Jayatilaka, Theor. Chem. Acc., 2001, 105, 213–218 Search PubMed.
Footnote |
| † Electronic supplementary information (ESI) available. See DOI: 10.1039/c6cp06456f |
| This journal is © the Owner Societies 2017 |

