An improved model of homogeneous nucleation for high supersaturation conditions: aluminum vapor
Received
12th June 2016
, Accepted 29th October 2016
First published on 31st October 2016
Abstract
A novel model of stationary nucleation, treating the thermodynamic functions of small clusters, has been built. The model is validated against the experimental data on the nucleation rate of water vapor obtained in a broad range of supersaturation values (S = 10–120), and, at high supersaturation values, it reproduces the experimental data much better than the traditional classical nucleation model. A comprehensive analysis of the nucleation of aluminum vapor with the usage of developed stationary and non-stationary nucleation models has been performed. It has been shown that, at some value of supersaturation, there exists a double potential nucleation barrier. It has been revealed that the existence of this barrier notably delayed the establishment of a stationary distribution of subcritical clusters. It has also been demonstrated that the non-stationary model of the present work and the model of liquid-droplet approximation predict different values of nucleation delay time, τs. In doing so, the liquid-droplet model can underestimate notably (by more than an order of magnitude) the value of τs.
1. Introduction
Homogeneous nucleation of supersaturated vapor plays an important role in a number of natural and technological processes. One of the main problems in the theory of homogeneous nucleation is to determine the steady-state nucleation rate. Most of the proposed theoretical models of condensed-phase particle formation are based either on the classical nucleation theory or on its modifications.
It should be emphasized that classical nucleation theory (CNT), built in the middle of last century by Becker and Dőring and, in the most complete form, by Frenkel and Zel'dovich,1–3 was a significant forward step compared to the earlier proposed models of the formation of a condensed phase in supersaturated vapor. It allowed one to achieve an acceptable compliance with experimental data on the values of critical supersaturation for water and alcohol vapors detected in an aerosol chamber. However, furthermore, due to the improvement of experimental techniques and direct measurements of the nucleation rate, significant discrepancies between the predictions of CNT and experimental data were observed.4–10 In addition, CNT possesses a few principal flaws: the neglect of the existence of internal degrees of freedom for formed clusters, contradiction of the mass action law and consideration of a critical cluster as a liquid droplet with appropriate values of density and surface energy.11–15
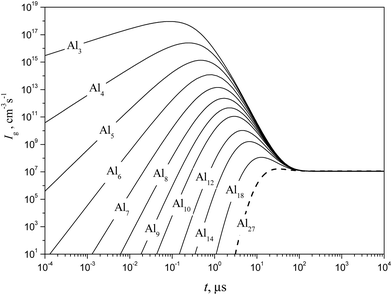
Altogether there is an urgent need to build more advanced models of nucleation. However, despite the significant efforts of the experts engaged in the field, a universal model of homogeneous nucleation, which would describe the whole set of obtained experimental data or, at least, a substantial part, has not been built yet. Therefore, the further development of nucleation models remains being of great importance until now. This is evidenced by a large number of recent publications concerning the improvement of CNT prediction ability (see, for example, ref. 15–19).
One of the most promising directions of CNT development is aimed at the accurate description of the nucleation in a metal vapor environment. This is dictated by the need for modeling the technological processes of nanoparticle production via chemical vapor deposition. This method is based on a well-known pattern: the reduction in the size of the condensed-phase particles with increasing supersaturation that is due to the fact that the nucleation rate increases faster than the rate of the condensation process.20 Therefore, in order to diminish the dispersion of the size of produced nanoparticles, one needs to increase the value of the supersaturation of metal vapor.
Generalization of the classical nucleation theory for the case of high supersaturation concerns overcoming the most fundamental disadvantage of CNT: consideration of a critical cluster (embryo) as a droplet. The point is that, at high values of supersaturation, the embryo is composed of only a few atoms or molecules, and representation of such clusters as a liquid droplet is very far from reality.
The rate constants of the processes of cluster evaporation are determined in CNT in line with the principle of detailed balancing through the known rate constants of clusterization reactions assuming the existence of equilibrated distribution of clusters. Therefore, in order to update the CNT for the accurate prediction of the nucleation rate at high supersaturation values, it is necessary, firstly, to determine what clusters are formed during the nucleation and, secondly, to calculate their thermodynamic properties (TP). Nowadays, due to great advances in the development of efficient numerical methods of molecular dynamics and quantum chemistry as well as the improvement of experimental techniques, the TP of various clusters can be defined with rather high accuracy as for the simplest atomic clusters so as for the more complex molecular clusters and even for charged molecular structures.21–26 Therefore, in past years, a number of attempts to build new nucleation models, based on the TP of clusters, were undertaken (see, for example ref. 27–34).
However, today, the accurate TP of clusters can be calculated only for rather small structures composed of a few monomers. The description of TP in the transition region, ranging from the simplest small clusters to the liquid-like large ones, meets serious difficulties in the frame of deterministic nucleation models. The point is that liquid-like clusters are composed of a large number of isomers.35 Therefore, in order to describe the formation and growth of liquid-like clusters, it is necessary to consider all possible isomeric structures corresponding to the local minima on the potential energy surface. The number of isomers increases sharply with increasing cluster size.35–37 Therefore, the direct simulation of the formation of liquid-like clusters, taking into account the detailed kinetics of the isomerization process, is not possible. In this regard, it is reasonable to develop a model that is based on the averaged TP of the ensembles of isomers for each class of clusters.
The averaging procedure may be accomplished by calculating the partition functions of isomers and, then, the partition function of the whole ensemble of each class of clusters22,26,38 or by calculating the configuration integral for the cluster.22 In this way, only TP for fairly small clusters, consisting of only a few atoms or molecules, can be obtained. For larger clusters, the usage of the stochastic model, based on the Monte Carlo method with the construction of the Markov chain of configurations and the calculation of the cluster work formation or the determination of the probability of the growth or destruction of clusters, are preferred.28,39 Unfortunately, the comparison of results, obtained by using these methods, with experimental data showed that their accuracy was not sufficient. The low efficiency of these methods can be caused by a large number of local minima on the potential energy surface, and the conventionally applied length of the Markov chain is not enough for the complete scan of configuration space.
Since the calculation of TP for the moderate- and large-sized clusters in the transition region, ranging from small clusters to liquid-like ones, is rather difficult, it is necessary to apply some simplifications. For example, in order to determine the TP for liquid-like large clusters, it was proposed to extrapolate the TP of small clusters to those of the nano-sized particles.32,40,41 The other method is based on the interpolation procedure for the TP of clusters in the transition region by matching certain thermodynamic functions of small clusters with similar characteristics of liquid droplets (see, for example ref. 31 and 42). The most commonly interpolated thermodynamic function is the change in the standard Gibbs energy in the reactions of cluster growth. As is shown in the present work, it is reasonable to utilize the standard chemical potential of the cluster as an interpolated function.
This work addresses the development of a steady-state model of homogeneous nucleation and its application for the analysis of the nucleation of Al vapor with the use of a special interpolation procedure for the standard chemical potential of clusters. This model is carefully validated against the available experimental data on the nucleation rate of water vapor obtained for small and high values of supersaturation. Also, the nucleation rate, calculated by using such a model, is compared with the results of direct non-stationary simulation of aluminum cluster formation.
2. Methodology
As is known, according to CNT, the nucleation in supersaturated vapor occurs via a condensation–evaporation process, when the clusters grow due to attachment of single monomer to clusters. In doing so, it is assumed that the concentration of monomers is much greater than the concentration of the resulting clusters, so the coagulation of clusters can be ignored. It is believed that only the most thermodynamically stable isomers can form in the course of clusterization, and liquid-like clusters have a spherical shape. The mechanism of cluster growth, adopted in CNT, can be written in the following form:where A1 is the monomer and Ag is the cluster composed of g monomers. The reaction rate of the formation of cluster Ag is governed by the equation:
| | |
I
g
= βg−1f1fg−1 − αgfg.
| (2) |
Here
fg is the concentration of cluster
Ag,
βg−1 is the rate constant of the reaction of
Ag−1 cluster formation and
αg is the rate constant of the process of
Ag cluster evaporation. Change in the concentrations of clusters in the processes of their growth can be described by the system of following equations:
With an increase of the cluster size, a gas–liquid interface forms. This leads to the acquisition of additional free energy by the system and to the appearance of a maximum in the dependence of Gibbs free energy ΔGg on the cluster size. Cluster with the size corresponding to this maximum, and comprising g* monomers, is called critical one. Due to the existence of a maximum for the dependence of ΔGg on the g value in a supersaturated vapor, the system of subcritical clusters reaches a steady state. In this case, from eqn (3), it follows that the steady-state nucleation currents for all clusters Ag equal to each other. In line with CNT, for the calculation of the stationary rate of nuclei formation I, an ensemble of clusters A1, A2,…,AL (where L is the number of monomers in the cluster with the size somewhat larger than the size of the so-called critical cluster) is introduced, and the stationary distribution of these clusters is determined for the following boundary conditions:
where
n1 is the monomer number density in supersaturated vapor. Steady-state concentrations
f1,
f2,…,
fL of clusters
A1,
A2,…,
AL are determined, taking into account
eqn (2), by solving the following system of equations:
| | |
β
L−1
f
L−1
f
1 − αLfL = I.
| (5) |
When denoting the equilibrium concentration of the Ag cluster as Cg, the solution of the system of eqn (5) can be written in the form:43
| |  | (6) |
CNT treats that
C1 =
n1, and the equilibrium concentrations of other clusters in the steady state are determined from the system of following equations:
| | | βg−1n1Cg−1 − αgCg = 0, g = 2 − L. | (7) |
Taking into account
eqn (4), the nucleation rate
I can be expressed as
| |  | (8) |
CNT assumes that the energy barrier of reaction (1) in the forward direction is equal to zero, and the corresponding rate constant βg is determined by the frequency of collisions between the cluster and the monomer as
| | | βg = πrg2(8kBT/πm1)1/2, | (9) |
where
rg is the radius of cluster
Ag,
m1 is the mass of monomer, and
kB is the Boltzmann constant. It is worth noting that if one introduces the so-called “mass accommodation coefficient” (smaller than unity) in expression
(9), not each monomer can attach to the cluster, and this implies that the energy barrier could exist.
In line with CNT, clusters are treated as spherical liquid droplets with the same density as that of macroscopic volume of liquid. The radius of clusters in the framework of this model is governed by the formula:
Here
rl = (3
vl/4π)
1/3 is the Wigner–Seitz radius and
vl is the volume of the molecular cell in the liquid phase. Substituting
eqn (9) and (10) into
eqn (8) gives
| |  | (11) |
In accordance with
ref. 3, the equilibrium distribution of clusters depends exponentially on Δ
Gg| | Cg = n1![[thin space (1/6-em)]](https://www.rsc.org/images/entities/char_2009.gif) exp(−ΔGg/kBT). exp(−ΔGg/kBT). | (12) |
The change in the Gibbs free energy Δ
Gg due to the formation of cluster
Ag from the monomers is expressed as Δ
Gg =
Gg −
gμ1, where
Gg is the Gibbs free energy of the cluster
Ag and
μ1 is the chemical potential of the monomer in the supersaturated vapor. Taking into account that
Gg =
gμl +
σFg, where
μl is the chemical potential of a single atom (molecule) in the liquid phase,
σ is the surface tension at the vapor–liquid interface and
Fg is the surface area of the cluster, composed of
g monomers, and accounting for the dependence of chemical potential on the pressure, the expression for Δ
Gg can be written in the form:
| | ΔGg = −gkBT![[thin space (1/6-em)]](https://www.rsc.org/images/entities/char_2009.gif) ln(P1/P∞) + σFg, ln(P1/P∞) + σFg, | (13) |
where
P1 and
P∞ are the supersaturated vapor pressure and the equilibrium vapor pressure above the flat liquid surface. Thus, taking into account
eqn (13), the relationship
(12) can be written in the form:
| |  | (14) |
When substituting expression
(14) into
eqn (11), one can deduce
| |  | (15) |
where
S =
P1/
P∞ is the supersaturation. At low
S values, the sum in the denominator of
eqn (15) can be replaced by an integral, and
eqn (15) can be written in the form proposed by Frenkel and Zel'dovich:
3| |  | (16) |
where
r* is the radius of a critical cluster. Its value is expressed by the known relationship:
| | r* = 2σvl/kBT![[thin space (1/6-em)]](https://www.rsc.org/images/entities/char_2009.gif) ln ln![[thin space (1/6-em)]](https://www.rsc.org/images/entities/char_2009.gif) S. S. | (17) |
Eqn (14) has been repeatedly criticized in the literature, because it is in contradiction with the mass action law. It should be emphasized that, in past years, a number of corrections of formula (14) was proposed in order to overcome this problem. Among them were Courtney's distribution11
| |  | (18) |
and self-consistent distribution
14,44| |  | (19) |
Following Frenkel and Zel'dovich,3 we considered a vapor, comprising monomers and clusters, as the gas phase system with the given values of temperature and pressure. In order to describe the formation of liquid-like clusters in such a system, it is necessary to take into account along with the growth of clusters also possible isomerization processes. In this case, the calculation of the nucleation rate becomes much more complicated. This procedure can be simplified, if we suggest that the steady-state nucleation takes place, when the stationary distribution of subcritical clusters is achieved, and each cluster represents the ensemble of isomers with equilibrium Boltzmann distribution. For such average clusters, the chemical potential is determined through the partition function Qg for the ensemble of isomeric forms in line with the formula:
| | μg = kBT(ln![[thin space (1/6-em)]](https://www.rsc.org/images/entities/char_2009.gif) Ng − ln Ng − ln![[thin space (1/6-em)]](https://www.rsc.org/images/entities/char_2009.gif) Qg), Qg), | (20) |
where
Ng is the total number of clusters with a fixed number of atoms (isomers). Based on this relationship, the standard chemical potential of an average cluster
μ0g can be defined as a potential
μg corresponding to the value of
Ng, at which the total pressure
Pg of clusters
Ag is equal to the standard unit pressure
P0 (the unit pressure
P0 is conventionally taken as 1 bar). According to the law of mass action for
reaction (1), the chemical potential of cluster
Ag can be expressed as
μg =
gμ1. Taking into account the connection between chemical potential and pressure, one can obtain:
| |  | (21) |
where
μ0g and
μ01 are the standard chemical potentials of cluster
Ag and monomers, respectively. Passing in
eqn (21) from the partial pressures to the concentrations of clusters
we can write
| |  | (23) |
When substituting
eqn (23) into
eqn (11), the nucleation rate can be expressed as
| |  | (24) |
As is seen from eqn (24), the nucleation rate I is partly specified by the standard chemical potential μ0g of clusters. It should be emphasized that, today, there is no consensus on the problem how to determine the Gibbs free energy of liquid droplets. Since the main objective of the present work is a generalization of CNT to the case of high supersaturation values, the potential μ0g of the droplet could be determined by using eqn (23) and the distribution (14). However, the contradiction between the distribution (14) and the law of mass action precludes such a definition.
For this reason, in the present work, the potential μ0g was defined assuming that the average number of monomers, evaporated from the cluster surface, occurred in a free molecular mode. In order to obtain the appropriate expression for μ0g let us take into account that, in the steady state, we have
As is known, the equilibrium constant for
reaction (1) can be expressed through the partial pressures of reactants and products
| |  | (26) |
When combining
eqn (25) and (26), one can obtain
| |  | (27) |
For the free molecular mode, the evaporation of monomers is defined by the Knudsen formula. Taking into account the Thomson correction factor for the pressure of saturated vapor over the surface of the droplet with a given radius, one can obtain the following expression for the rate constant of reaction (1) in the backward direction
| |  | (28) |
where
n∞ is the number density of monomers in the vapor over the flat surface in the equilibrium state. Taking into account that the rate constant for forward
reaction (1) is determined by the relationship
(9) and that, for high values of
g, the equations
rg2/
rg−12 ≈ 1 and
μ0l −
μ01 =
kBT![[thin space (1/6-em)]](https://www.rsc.org/images/entities/char_2009.gif)
ln(
P∞/
P0) are valid, for the equilibrium constant
Ke,g one can write
| |  | (29) |
where
μ0l is the standard chemical potential of a liquid. From
eqn (29), it follows
| |  | (30) |
and, thus, for the potential
μ0g, one can obtain the following equation
| |  | (31) |
For large
g values, we can write
| |  | (32) |
and assuming that, formally, for monomers, the equation
Fi = 4π
rl2i2/3 is also valid, the potential
μ0g can be written as
| | | μ0g = μ01 + (g − 1)μ0l + σ(Fg − F1). | (33) |
The potential
μ0g in a form analogous to
eqn (33) was obtained earlier by Blander and Katz.
45 Note that, for the large clusters with large
g numbers, the inaccuracy, caused by the application of the approximation formula 2
σvl/
ri ≈
σ(
Fi −
Fi−1), should be rather small because of the slight contribution of the corresponding terms to the sum

. So, for the droplets comprising 100 monomers, this inaccuracy does not exceed 1%. It should be emphasized that the similar approach for the estimation of potential
μ0g was applied earlier in a few studies addressing the development of nucleation models (see, for example,
ref. 46 and 47). In those works, the authors upon the calculation of the sum

used the Euler–Maclaurin formula, when leaving only one or two terms in the expansion after the integral

. Our estimation is based on neglecting these terms.
The nucleation rate, corresponding to the potential μ0g defined by eqn (33), can be expressed as:
| |  | (34) |
and proceeding to the partial pressure of the monomers, we have:
| |  | (35) |
One can conclude that the usage of the standard chemical potential (eqn (33)) allows one to obtain the self-consistent distribution (eqn (19)). Comparing the expressions (35) and (15), we can rewrite the nucleation rate in the following form:
| | I = S−1![[thin space (1/6-em)]](https://www.rsc.org/images/entities/char_2009.gif) exp(σF1/kBT)IFZ, exp(σF1/kBT)IFZ, | (36) |
where
IFZ is the nucleation rate defined by the Frenkel–Zel'dovich formula (
eqn (16)).
Nucleation barrier, corresponding to the distribution (eqn (23)), differs from that obtained on the basis of Frenkel–Zel'dovich theory. When writing eqn (24) in the form of eqn (15)
| |  | (37) |
and comparing
eqn (37) and eqn (15), one can conclude that the nucleation barrier Δ
Gg is expressed through the vapor pressure and standard chemical potential of the monomer
μ01 and the
g-th cluster
μ0g by the formula:
| | ΔGg = μ0g − gμ01 − kBT(g − 1)![[thin space (1/6-em)]](https://www.rsc.org/images/entities/char_2009.gif) ln(P1/P0). ln(P1/P0). | (38) |
Note that an analogous formula for Δ
Gg was earlier reported by Blander and Katz.
45 For liquid-droplet approximation, when the chemical potential of droplets is defined by formula
(33), we have:
| | ΔGg = (g − 1)kBT![[thin space (1/6-em)]](https://www.rsc.org/images/entities/char_2009.gif) ln(P∞/P0) + σ(Fg − F1). ln(P∞/P0) + σ(Fg − F1). | (39) |
To construct the dependence of μ0g on the g value in the entire range of g numbers; we divided the whole region of the cluster sizes into three subdomains: (1) the subdomain of small clusters (2 ≤ g≤ gc); (2) the transition subdomain (from small clusters to droplets with gc < g ≤ gd) and (3) the subdomain of liquid droplets (g > gd). In the first subdomain, the chemical potential μ0g was determined on the basis of the calculated or measured TP of clusters. In the liquid-droplet subdomain, it was supposed that the potential μ0g depended on the Gibbs free energy of liquid droplets. In the transition subdomain, the potential μ0g was determined through the interpolation function η(g) “matching” the potential μ0g of small clusters and the potential of liquid droplets. Taking into account that, in the transition subdomain, mostly compact clusters can form, the borderline cluster gc was chosen so that the monomers in this cluster were packed into a compact structure. In the liquid phase, in accordance with the definition of coordination number Z, each atom is surrounded by Z neighboring atoms, so that the gd number was taken equal to Z + 1. Because the results of direct numerical simulation of clustering in a supersaturated vapor showed that the droplet can be considered as a cluster consisting of not less than 100–200 atoms or molecules,48,49 it was adopted in our model that the borderline cluster was composed of 100 monomers, i.e. gd = 100.
In order to calculate the dependence of the standard chemical potential of the g-th cluster in the transition subdomain, we introduced an interpolation function η(g) bonding the standard chemical potentials of the simplest clusters and liquid droplets. As is known, in the transition subdomain, compact structures, which can be characterized by their own surface, form. This makes it possible to specify atoms (molecules) in a cluster as the bulk and surface ones. Assuming that the number of surface atoms is equal to g2/3 (as well as in a droplet), the interpolation function can be written as follows:
| | | η(g) = κ1g + κ2g2/3 + κ3. | (40) |
The coefficients
κ1,
κ2 и
κ3 in
eqn (40) can be found by solving the following system of linear algebraic equations:
|
κ
1(Z + 1) + κ2(Z + 1)2/3 + κ3 = μ0Z+1, |
|
κ
1
g
d + κ2gd2/3 + κ3 = μ01 + (gd − 1)μ0l + σ(Fgd − F1), |
| | |
κ
1 + 2/3κ2gd−1/3 = μ0l + 8/3σπrl2gd−1/3,
| (41) |
where
μ0Z+1 is the standard chemical potential of the cluster located at the right-hand boundary of the elementary cluster region. The first and second equations of system
(41) are the conditions of continuity of the standard chemical potentials at the boundaries of the transition subdomain, while the third equation is the condition of continuity of the first derivative of the standard chemical potential at the left-hand boundary of the liquid droplet subdomain.
It should be emphasized that, at low values of supersaturation, formula (24) transforms to the CNT expression for the nucleation rate. In fact, because the product of the sum in eqn (24) is characterized by a sharp peak at g = g*, the value of this sum is determined mostly by the critical cluster comprising g* monomers. Therefore, with decreasing S value, when g* is much greater than Z + 1, the simplest small clusters practically do not affect the nucleation rate, and the I value is determined mainly by the chemical potential of liquid particles. Thus, at low supersaturation values, the developed model provides the accuracy not worse than that of CNT. Conversely, at high supersaturation values, and, hence, small g* values, the magnitude of I is determined mostly by TP of small clusters, and the accuracy of the proposed model depends on the accuracy of the definition of the partition function Qg of clusters. This is the principal advance of the proposed nucleation model compared with analogous models developed previously.11–14 Note that, earlier, attempts to include the molecular level information about small clusters for the development of nucleation theory were undertaken by some researchers.50–53
It should be emphasized that during the isothermal compression of the vapor, the size of the critical cluster can decrease up to the size of the dimer (g* = 2). In line with eqn (38), such a compression results in diminishing the nucleation barrier. In doing so, there exists the boundary pressure Pb, at which the barrier for dimer formation ΔG2 disappeared i.e., at P = Pb, we have ΔG2 = 0. In this case, from eqn (38), it follows that
| | | ln(Pb/P0) = −(2μ01 − μ02)/kBT. | (42) |
Upon the compression of the gas to the pressure
Pb, the vapor becomes unstable, because the stable state of the medium cannot be achieved at
P >
Pb.
3. Validation of the model
The model, developed in the present work, can be used for the calculation of the nucleation rate for any substance in the vapor phase, if the standard chemical potentials of the first Z clusters and the corresponding physical characteristics of the vapor and liquid phases are known. Because most of the experimental data were accumulated for the nucleation of water vapor, it is reasonable to test the developed model over the data on H2O vapor nucleation obtained both at low and high values of supersaturation. The most complete data on homogeneous nucleation of H2O vapor were obtained by Wölk and Strey7 using the expansion chamber at sufficiently high values of supersaturation. Based on the results of the measurements, they proposed an empirical formula for calculating the rate of the homogeneous nucleation of steam in the ranges of temperature 220 K < T < 260 K and supersaturation 5 < S < 22:7| | I = I0![[thin space (1/6-em)]](https://www.rsc.org/images/entities/char_2009.gif) exp(−27.56 + 6500/T), exp(−27.56 + 6500/T), | (43) |
where the pre-exponential factor I0 was given by the Frenkel–Zel'dovich formula (eqn (16)).
A special analysis showed that the formula (43) remained to be valid even at lower temperatures up to T = 200 K.54 In addition, it was found that the approximation (43) was consistent with the experimental data not worse than an order of magnitude even at very high supersaturation values (up to S = 200).54 Under such a value of supersaturation, the nucleation embryo is composed of a few molecules only. In this case, the accuracy of the estimation of nucleation rate is strongly dependent on the TP of clusters.
In order to validate the model, developed in the present work, the calculations of the nucleation rate were performed in the range of S = 5–200 at the temperatures of 200 K, 210 K, 220 K and 230 K. It is worth noting that, at such low temperatures, the structure of supercooled water is close to that of ice, and, therefore, the coordination number Z was assumed equal to 4.55 The structure of small water clusters (H2O)g with g = 2–5, was investigated by many researchers (see, for example, ref. 56–61), and their TP were defined rather well. Among these small clusters, only the tetramer (H2O)4 has three isomers: two forms with a prismatic structure and one form with a cyclic structure.59 Moreover, at temperatures lower than 298 K, the most stable structure is a cyclic isomer possessing the highest bond energy compared to other isomeric forms of the (H2O)4 cluster. Therefore, the isomerization processes for small (H2O)n clusters can be ignored.
The values of standard Gibbs free energy for the reactions of the formation of (H2O)g (g = 2–5) clusters at T = 198 K, 208 K, 216.1 K, 221.5 K, 228.1 K, 240.5 K and 250.2 K were calculated in ref. 58. On the basis of these data, the standard chemical potentials of (H2O)g clusters were estimated by using the formula μ0g = ΔG0g + gμ01. Fig. 1 shows the calculated values of μ0g for g = 2–5 as well as the temperature dependence μ0g(T) obtained by using the interpolation procedure, and Fig. 2 depicts the standard chemical potentials of water clusters as a function of g at T = 220 K. Note that the potential of monomer μ01 was taken from the database,62 and the standard chemical potential of droplets was calculated by using the temperature dependences for the saturated water vapor pressure and density of the liquid phase, reported in ref. 7, while the surface tension of supercooled water was determined according to the formula reported in ref. 63 (this formula is valid for the temperature range 200 K ≤ T ≤ 267.5 K).
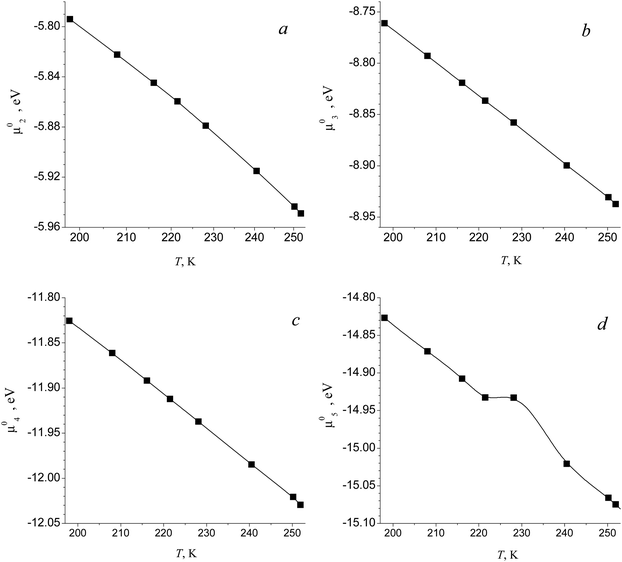 |
| | Fig. 1 Standard chemical potential μ0g of (H2O)g clusters for g = 2 (a), 3 (b), 4 (c) and 5 (d) as a function of temperature T. Symbols are the estimations on the basis of data58 and curves are the approximation of this work for the temperature dependence of potential μ0g used for the calculations. | |
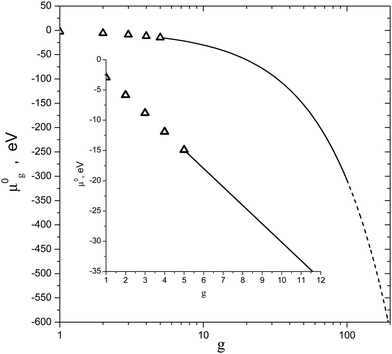 |
| | Fig. 2 Standard chemical potential μ0g of (H2O)g clusters vs. g number at T = 220 K. Symbols are the standard chemical potentials of the monomer and some small clusters. Solid and dashed lines depict the values of the potential of clusters in the transition and liquid droplet regions, respectively. The inset is the scaled fragment of potential μ0g for clusters with g = 1–11. | |
One can see that the proposed interpolation procedure allows one to obtain good correlation between chemical potentials of small clusters with g = 2–5 and those of liquid particles with g > 100. Depicted in Fig. 3 is the comparison of the nucleation rates for water vapor predicted by eqn (16), (24) and (36) as well as by the empirical formula reported by Wölk and Strey.7Fig. 3 also shows the dependence of the number of H2O molecules in a critical cluster on the S value calculated in line with the equation g* = (r*/rl)3. Although, at high values of supersaturation, CNT cannot provide reasonable accuracy for the r* value, nevertheless, it gives an indication of the possible size of the nucleation embryo. So, at S > 100, CNT predicts that the nucleation embryo comprises only few molecules. It should be emphasized that, upon the calculation of the nucleation rate with the usage of the Wölk–Strey formula (43), the pre-exponential factor in eqn (43) must be replaced by the temperature dependence of the thermal characteristics of water, which was directly used by Wölk and Strey during processing the experimental data. The corresponding dependence for the surface tension was taken from ref. 7, and can be expressed as the following one:
| | | σ = 93.6635 + 0.009133T − 0.000275T2, in mN m−1. | (44) |
From the plots shown in
Fig. 3 one can conclude that the model, developed in the present work, reproduces the curve, predicted by the Wölk–Strey formula, with reasonable accuracy (the difference does not exceed an order of magnitude). At the same time, CNT overestimates the measured values of nucleation rate by one or even several orders of magnitude (depending on the
S value). At smaller supersaturation values, the predictions of the model of the present work gradually approach the CNT calculated nucleation rate. So, at
S ≈ 5, the model of the present work gives practically the same magnitude of the nucleation rate that is provided by CNT.
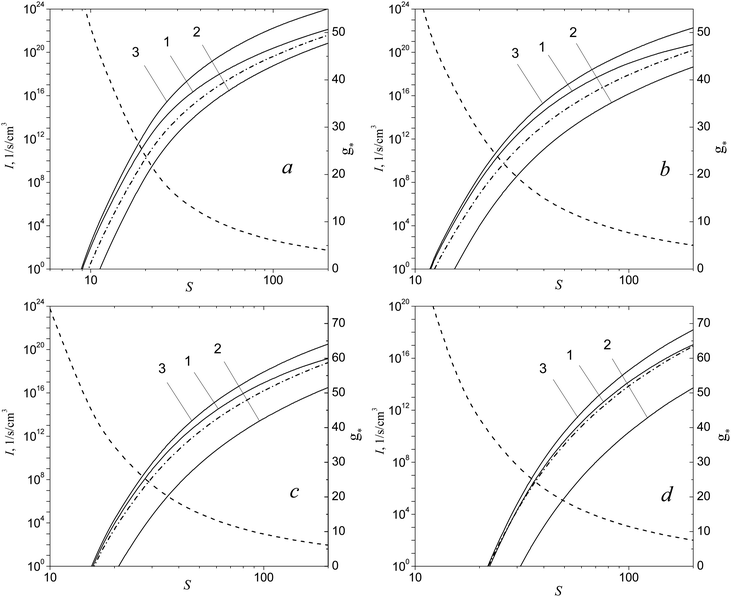 |
| | Fig. 3 Nucleation rate of water vapor I as a function of S value predicted by the model of this work (formula (24)), CNT (formula (16)) and CNT with the correction factor (formula (36)) (curves 1–3) at T = 230 K (a), 220 K (b), 210 K (c) and 200 K (d). Dash-dotted curve reproduces the empiric dependence of Wölk and Strey.7 Dashed curve depicts the number of monomers in a critical cluster g* predicted by CNT. | |
Note that earlier Hale64 developed the so-called scaled model especially to describe the temperature dependence of the nucleation rate. This model reproduces the Wölk–Strey approximation with a rather high accuracy. It should be emphasized that the appropriate prediction of the temperature dependence of the nucleation rate can serve as a clear indicator of how well a given model reproduces the Gibbs free energy of cluster formation.
Consider now how the nucleation barrier in the H2O vapor changes with increasing the supersaturation. Fig. 4 depicts the dependence of the Gibbs free energy of the formation of (H2O)g clusters on the g number at different S values for temperature T = 220 K. One can see that, for small supersaturation values (S = 8), the values of Gibbs free energy in the transition region, predicted by the model of this work, coincide with those calculated by using the liquid-droplet approximation (formula (39)). That is why the model of the present work provides the same value of nucleation rate as that of CNT. With increasing S, the maximum value of the Gibbs free energy of cluster formation, determined in line with the liquid-droplet approximation, becomes smaller than that calculated by using the model of the present work in the transition region (see Fig. 4b). This is the main reason for the fact that, at elevated S values, CNT overestimates the magnitude of the nucleation rate predicted by the model of the present work (see Fig. 3).
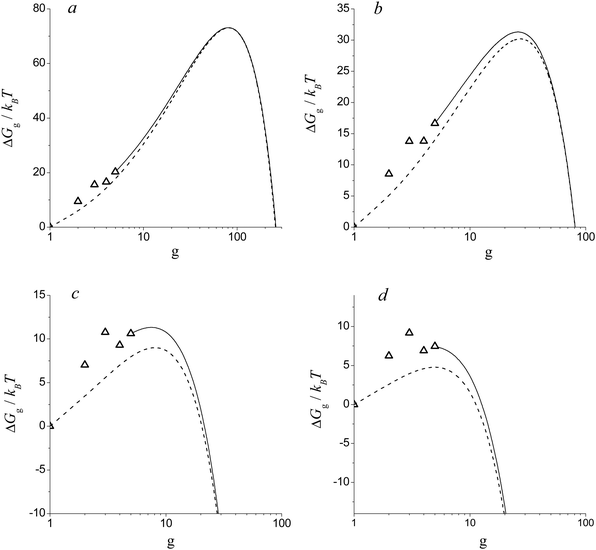 |
| | Fig. 4 Dimensionless Gibbs free energy of cluster formation ΔGg/kBT vs. g number at T =220 K for different S values: 8 (a), 20 (b), 90 (c) and 200 (d). Symbols are the values of ΔGg/kBT for the monomer and some small clusters. Solid and dashed lines depict the values of ΔGg/kBT for clusters in the transition region predicted by the model of this work and calculated on the basis of liquid-droplet approximation (formula (39)), respectively. | |
It is worth noting that, with increasing S values, another energy barrier forms in the region of small clusters. The height of this barrier, at a certain magnitude of S = Sd (Sd = 90), is comparable with the height of the potential barrier existing in the transition region (see Fig. 4c). With the further increase of supersaturation, the nucleation barrier in the transition region gradually decreases (see Fig. 4d). This means that, when supersaturation achieves the value of S = Sd, the size of the critical cluster should decrease abruptly.
4. Nucleation of Al vapor
Let us apply now the developed model for the calculation of the nucleation rate of aluminum vapor. According to the diffraction studies in the aluminum melt,65 the coordination number Z for liquid aluminum is equal to 8 at the temperature of 1573 K, and, therefore, because we consider the nucleation at T > 1500 K, the value of gc, determining the right-hand boundary of the region of small clusters, was chosen equal to 9. It is worth noting that the coordination number depends on temperature. For example, at T = 973 K, in line with ref. 65 and 66, the value of Z is equal to 10. Therefore, at low temperatures, the gc value must be greater.
Standard chemical potentials of Alg clusters were determined, as for the (H2O)g clusters, through the Gibbs free energy of cluster formation. The values of this energy, averaged over the ensemble of different isomers of Alg clusters, were tabulated in ref. 22. In that work, the Gibbs free energies of formation of small Alg clusters were calculated through the configuration integral using the Monte-Carlo approach (Monte-Carlo Configuration Integral (MCCI) method). In doing so, some model potential was used. Certainly, today, the TP of small Alg (g = 2–9) clusters can be calculated by using quantum chemical methods (density functional theory or ab initio) (see, for example, ref. 38) with higher accuracy. Nevertheless, it should be emphasized that quantum chemical calculations of thermodynamic properties of small Alg clusters demonstrated the same tendency that was obtained with the usage of the MCCI method. However, the comparative analysis of the accuracy of different methods for the calculation of Gibbs free energy for Alg small clusters is outside the scope of the present work. Fig. 5 shows the standard chemical potentials μ0g of Alg clusters applied for the calculation of the nucleation rate. One can see that, at high temperatures (T = 2500 K), dependence of the potential μ0g on the g number for small clusters is close to a linear one (Fig. 5a). With decreasing temperature, this dependence becomes less regular (see Fig. 5b and c) that can be explained by the increasing contribution of Alg clusters with “magic numbers” to the TP of the ensemble of the isomers with minimal energy upon the temperature decrease.
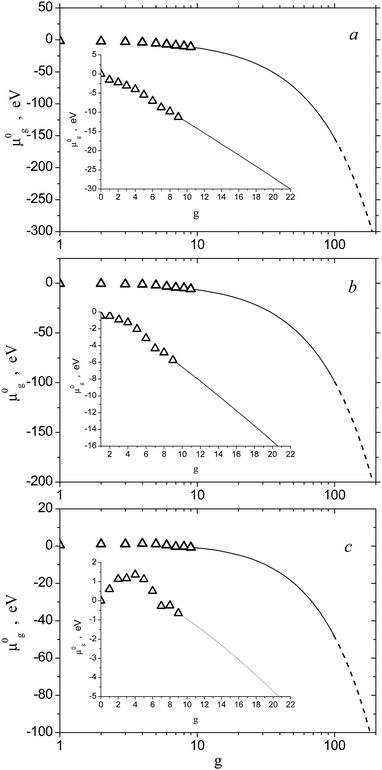 |
| | Fig. 5 Standard chemical potential μ0g of Alg clusters vs. g number at T = 2500 K (a), 2000 K (b) and 1500 K (c). Symbols are the standard chemical potentials of the monomer and small clusters with g = 2–9. Solid and dashed lines depict the values of the potential of clusters in the transition and liquid droplet regions, respectively. The insets of scaled fragments show potentials μ0g for clusters with g = 1–20. | |
The pressure of saturated aluminum vapor was calculated by using the formula P∞/P0 = exp(−(μ01 − μ0l)/kBT). In doing so, the standard chemical potential μ0l of the aluminum atom in the liquid phase was taken from the database.62 Note that the comparison of P∞ values, calculated by using this formula, with those tabulated in ref. 67 showed that the relative error of our calculations did not exceed a few percents at high temperatures. The density of the molten aluminum and its surface tension were determined on the basis of experimental data.68
Fig. 6 shows the dependence of the nucleation rate for aluminum vapor on the S value predicted by different CNT-based models including the model developed recently by Girshick et al.,32 which, as well as the model of the present work, treats the TP of small clusters. Depicted here is also the number of monomers g* in the critical cluster as a function of S predicted by CNT. It is seen that, at high supersaturation values, CNT overestimates the nucleation rate by few orders of magnitude. The model of Girshick et al.32 and the model, of the present work, at very high supersaturation values (S > 35), give practically identical I values. This is explained by the fact that both these models utilize the same chemical potentials for the Alg clusters with g = 2–8. However, with the decrease of supersaturation, the model of Girshick et al.32 predicts very rapid decline of the nucleation rate, so that, at S = 5, the difference between the predictions of CNT with the correction factor, given by formula (36), and the model of Girshick et al.32 mounts to 30 orders of magnitude. This clearly indicates the principal disadvantage of the model proposed in ref. 32. At the same time, the model of the present work ensures, at small supersaturation values, practically the same values of the nucleation rate that are predicted by CNT taking into account the correction factor. Note that the CNT-based model with Courtney correction (it assumes that the factor exp(σF1/kBT) in formula (36) is equal to unity), at high supersaturation values, underestimates notably the nucleation rate compared with the traditional CNT model.
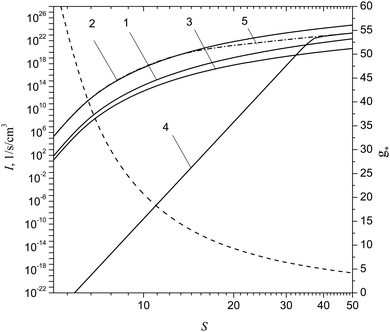 |
| | Fig. 6 Nucleation rate of aluminum vapor I and the number of monomers g* in a critical cluster as a function of S value predicted by CNT (formula (16)), CNT with the correction factor (formula (36)), CNT with the correction of Courtney (factor exp(σF1/kBT) is equal to unity in formula (36)), as well as by the model developed in ref. 32 and by the model of the present work (formula (24)) (curves 1–5) at T = 2000 K. Dashed curve depicts the number of monomers g* in a critical cluster predicted by CNT. | |
Shown in Fig. 7 are the values of Gibbs free energy of Alg cluster formation calculated by using formula (38) for different S values at temperature T = 2500 K. As in the case of the nucleation of H2O vapor, the dependence of ΔGg on the g number for Alg clusters has a pronounced bimodal behavior (see Fig. 7a–c). One can see that, at the supersaturation S = Sd (Sd = 7.15), the double energy barrier forms (Fig. 7c). At higher supersaturation values (S > Sd), the second maximum (second barrier) in the dependence of ΔGg on g disappears (Fig. 7d). With the further increase of the S value, the first maximum (first barrier) in this dependence moves towards the region of small clusters. At a certain value of supersaturation (S = 150), the smallest cluster, a dimer, becomes the nucleation embryo (see Fig. 7e). Upon further supersaturation (S > 258), the nucleation barrier becomes equal to zero (see Fig. 7f), and the system reaches a state in which the nucleation barrier does not exist.
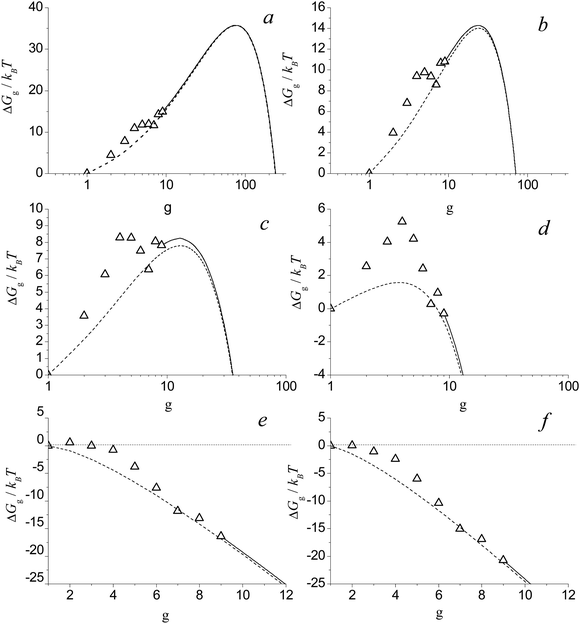 |
| | Fig. 7 Dimensionless free Gibbs energy of cluster formation ΔGg/kBT for Alg clusters vs. g number at T = 2500 K for S = 3 (a), 9 (b), 7.25 (c), 20 (d), 150 (e) and 258 (f). Symbols are the values of ΔGg/kBT for the monomer and small clusters with g = 2–9. Solid and dotted lines depict the values of ΔGg/kBT for clusters in the transition region and calculated on the basis of liquid-droplet approximation, respectively. | |
Let us estimate now the values of boundary pressure Pb that can be achieved upon the isothermal compression of aluminum vapor and the corresponding value of supersaturation Sb. This pressure is determined by the relationship (42) and corresponds to the disappearance of the potential barrier for dimer formation. Evidently, at S > Sb, the metastable state of vapor cannot be achieved. At such high supersaturation values, the nucleation concept loses its meaning, since any collision of monomers inevitably leads to the formation of particles of the condensed phase, and the process of condensation develops spontaneously (without nucleation barrier). Table 1 lists the values of boundary supersaturation Sb for aluminum vapor and the corresponding values of boundary pressure Pb as well as the supersaturation Sd and the equilibrium vapor pressure P∞ at different temperatures.
Table 1 The values of boundary supersaturation Sb and boundary pressure Pb for aluminum vapors as well as the values of Sd and the equilibrium vapor pressure P∞ at different temperatures
|
T, K |
S
b
|
Pb, MPa |
P
∞, Pa |
S
d
|
| 1500 |
49![[thin space (1/6-em)]](https://www.rsc.org/images/entities/char_2009.gif) 500 500 |
0.065 |
1.31 |
39.5 |
| 2000 |
1750 |
1.05 |
597 |
13.5 |
| 2500 |
258 |
5.6 |
21![[thin space (1/6-em)]](https://www.rsc.org/images/entities/char_2009.gif) 723 723 |
7.15 |
It is evident that the pressure Pb is achieved in the point of intercrossing of the isotherm for the vapor with the spinodal line. Therefore, it would be fruitful to check how well the expression (42) for Pb is consistent with the mean field spinodal for aluminum vapor. Because accurate data on the pressure of aluminum vapor at the spinodal was not found in the literature, we estimated the value of pressure at the spinodal using the thermodynamic theory on the basis of the three-parameter van der Waals equation:69
| | | (P + a/Vn)(V − b) = RT, | (45) |
where
V is the volume of a unit mole of the aluminum vapor and
R is the gas constant. Parameters
a,
b and
n are defined through the critical pressure
Pc, temperature
Tc and density
ρc of aluminum vapor.
69
It is worth noting that, nowadays, there exists a significant difference in the available data on critical parameters Pc, Tc and ρc of aluminum vapor.69–73 In order to estimate the possible scattering in the values of pressure at the spinodal, obtained on the basis of thermodynamic calculations, we used different experimental data on Pc, Tc and ρc from the ref. 69–73. In doing so, the spinodal point was determined by using the equation (∂P/∂V)T = 0. The data on critical parameters, reported elsewhere69–73 and used for the thermodynamic calculations of the pressure value at spinodal, are listed in Table 2.
Table 2 The values of critical parameters of aluminum vapor reported elsewhere69–73
|
P
c, GPa |
T
c, K |
ρ
c, g cm−3 |
Ref. |
| 0.121 |
6547 |
0.387 |
69
|
| 0.5094 |
8472 |
0.785 |
70
|
| 0.197 |
6250 |
0.703 |
71
|
| 0.4674 |
7917 |
0.6599 |
72
|
| 0.35 |
7963 |
0.44 |
73
|
Shown in Fig. 8 is the comparison of Pb values, predicted by formula (42) and obtained on the basis of thermodynamic calculations, with different critical parameters in the temperature range T = 1500–3500 K. One can see that there exists a substantial dispersion in the results of thermodynamic calculations of Pb values. Nevertheless, one can conclude that, in the temperature range T = 2000–3500 K, the Pb values, calculated by using formula (42), are consistent rather reasonably with the thermodynamic estimates of the pressure at spinodal. At low temperatures (T = 1500 K), there exists a notable distinction between the results of thermodynamic calculations and boundary pressure Pb predicted by formula (42). The observed difference can be caused by some inaccuracy in the calculated TP of aluminum clusters (particularly, TP of the dimer). The estimates showed that, at T = 1500 K, rather small scattering in the TP of the dimer could lead to the distinction in the Pb value that can be equal to a factor of 10.
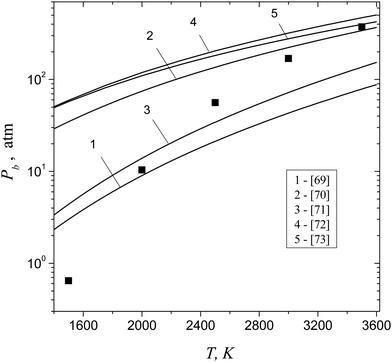 |
| | Fig. 8 The values of boundary pressure Pb, predicted by formula (42) (symbols), and pressures at spinodal, calculated on the basis of the three-parameter van der Waals equation with critical parameters reported in ref. 69–73 (lines 1–5), as a function of temperature. | |
An important issue is the estimation of the size of the nucleation embryo. Fig. 9 shows the dependence of g* on the S value predicted by the model of the present work and calculated in line with the relationship treated by CNT (g* = (r*/rl)3). One can see that, at the supersaturation value corresponding to the formation of the double potential barrier (Sd = 7.15), the model of the present work predicts a sharp decrease in the number of monomers inherent to the critical cluster. This is due to the appearance of two maxima in the dependence of ΔGg on the g number that provides the fast change in the number of monomers in a critical cluster upon hopping from the second maximum to the first one. From the plots shown in Fig. 9, it is also seen that CNT overestimates the value of g* in the range of supersaturation 7.15 < S < 20 and, conversely, underestimates the magnitude of g* notably at greater supersaturation values, which, however, are smaller than Sb (at T = 2500 K, we have Sb = 258). It is remarkable that, even in the range Sd < S < Sb, the model of the present work provides a reasonable value of g*.
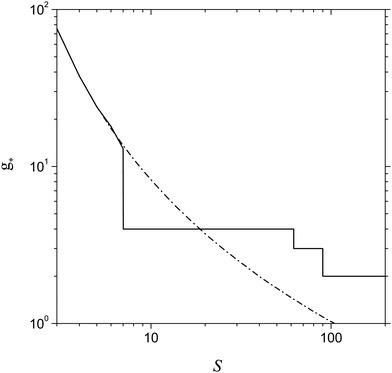 |
| | Fig. 9 Number of Al monomers in a critical cluster g* as a function of S predicted by the model of the present work and by CNT (solid and dash-dotted lines respectively) at T = 2500 K. | |
Because the size of the nucleation embryo depends strongly on the supersaturation of aluminum vapor, it follows that in order to produce nanoparticles with a narrow size distribution, it is necessary to ensure the operation conditions with nearly constant supersaturation during the cycle of nanoparticle fabrication and also to provide the stationary process of the formation of a condensation nucleus. This can be achieved if the duration of the nanoparticle production cycle is much longer than the characteristic time of formation of steady-state distribution of subcritical clusters (nucleation delay time τs). The magnitude of τs can be estimated by solving the system of eqn (3) with boundary conditions (4) and following the initial conditions:
| | | fg(t = 0) = 0, g = 2 − L. | (46) |
In doing so, in order to obtain exactly the same value of the nucleation rate, which is predicted by formula (24), it is needed to express the rate constants of the processes of cluster evaporation αg through the rate constants of cluster growth βg−1 in line with the equation αg = βg−1P0/Ke,gkBT.
Shown in Fig. 10 and 11 are the predicted temporal profiles of subcritical cluster number densities and the rates of formation of these clusters, respectively, at T = 1500 K and S = 20 (at such values of T and S, the magnitude of g* is equal to 27). One can see that, for such conditions, we have τs ∼ 1 ms. During this time, the rates of subcritical cluster growth Ig (g = 2–27) are equalized (see Fig. 11). It also follows that there exist some features in the behavior of Ig(t) dependence. Due to the existence of a double potential barrier, the process of establishing the steady state for subcritical clusters has three different stages. Initially, a stationary distribution of subcritical clusters with g = 2 − g*′, where g*′ is the number of monomers in the cluster corresponding to a maximum in the dependence of ΔGg on the g number in the cluster region (at conditions considered, we have g*′ = 6), is realized. At the second stage, the steady state is achieved for the ensemble of clusters with g = (g*′ + 1) − g*, and, at the third stage, the final distribution of subcritical clusters is established: at the end of this stage, the values of Ig for all subcritical clusters become identical (see Fig. 11).
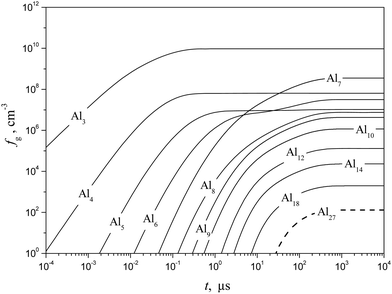 |
| | Fig. 10 Temporal evolution of the number density fg of some subcritical Alg (g = 1–18) and critical (g* = 27) clusters (solid and dashed curves, respectively) calculated using the model of the present work at T = 1500 K and S = 20. | |
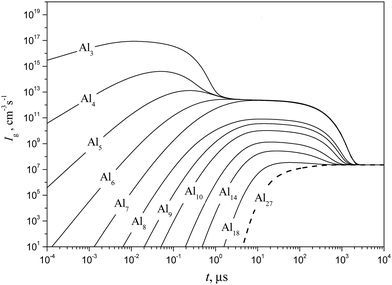 |
| | Fig. 11 Temporal evolution of the formation rate Ig of some subcritical Alg (g = 1–18) and critical (g* = 27) clusters (solid and dashed curves, respectively) calculated using the model of the present work at T = 1500 K and S = 20. | |
It is interesting to compare the obtained temporal profiles of fg and Ig with those predicted by the model of liquid-droplet approximation. The profiles of fg and Ig, calculated by using a liquid-droplet model, are depicted in Fig. 12 and 13. When comparing the plots, shown in Fig. 11 and 13, one can conclude that the time histories of the rates of subcritical cluster formation predicted by a non-stationary model of the present work and the model of liquid-droplet approximation differ substantially. The liquid-droplet model underestimates notably (by more than an order of magnitude) the value of τs for the conditions considered. It is worth noting that the relationship between the values of nucleation delay time, predicted by the non-stationary model of the present work (τs) and the liquid-droplet model (further this time is denoted as τls), depends on the temperature of aluminum vapor and supersaturation.
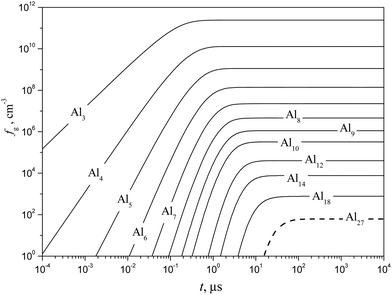 |
| | Fig. 12 Temporal evolution of the number density fg of some subcritical Alg (g = 1–18) and critical (g* = 27) clusters (solid and dashed curves, respectively) calculated using the model of liquid-droplet approximation at T = 1500 K and S = 20. | |
 |
| | Fig. 13 Temporal evolution of the formation rate Ig of some subcritical Alg (g = 1–18) and critical (g* = 27) clusters (solid and dashed curves, respectively) calculated using the model of liquid-droplet approximation at T = 1500 K and S = 20. | |
Table 3 lists the τs and τls values calculated at different T and S. One can see that the nucleation delay time, predicted by the liquid-droplet model, decreases monotonically with increasing S value. The dependence of τs on supersaturation is more complex. At small supersaturation values (S ≤ Sd), the nucleation delay time, predicted by a non-stationary model of the present work, increases with the growth of S value. Such a behavior of τs(S) dependence is caused by the formation of a double potential barrier at S ≤ Sd. When we have S > Sd, the time τs decreases with increasing supersaturation, analogously to the behavior of τls(S) dependence. It is also seen that, at fairly low temperatures (T = 1500 K), the τs values are substantially greater compared with the τls ones in the whole range of considered supersaturation values (S = 9–90). However, at higher temperatures (T ≥ 2000 K), such a tendency is not observed: at small S values, the magnitudes of τs and τls are comparable, and, at high supersaturation values, the nucleation delay time, calculated by using the liquid-droplet model, can be even longer than that predicted by the non-stationary model of the present work (for example, at T = 2000 K and S = 35, we have τls/τs = 4.2).
Table 3 The values of nucleation delay time (in μs) predicted by a non-stationary model of the present work (τs) and the model of liquid-droplet approximation (τls) at different T and S values
|
T = 1500 K |
|
S
|
9 |
10 |
20 |
30 |
39.5 |
50 |
60 |
70 |
80 |
90 |
|
τ
s
|
1080 |
658 |
1100 |
1900 |
2480 |
940 |
500 |
230 |
110 |
41 |
|
τ
ls
|
741 |
464 |
145 |
66 |
52 |
48 |
41 |
31 |
23 |
22 |
|
|
|
T = 2000 K |
|
S
|
6 |
8 |
10 |
12 |
13.5 |
15 |
20 |
25 |
30 |
35 |
|
τ
s
|
2.57 |
2.07 |
2.67 |
3.82 |
4.1 |
2.67 |
0.56 |
0.27 |
0.076 |
0.041 |
|
τ
ls
|
2.64 |
1.4 |
0.78 |
0.71 |
0.56 |
0.36 |
0.27 |
0.2 |
0.19 |
0.17 |
|
|
|
T = 2500 K |
|
S
|
3 |
4 |
5 |
6 |
7.25 |
8 |
9 |
10 |
12 |
14 |
|
τ
s
|
0.285 |
0.239 |
0.078 |
0.11 |
0.12 |
0.10 |
0.045 |
0.034 |
0.011 |
0.010 |
|
τ
ls
|
0.313 |
0.188 |
0.078 |
0.049 |
0.034 |
0.025 |
0.021 |
0.018 |
0.013 |
0.012 |
5. Conclusions
The model of stationary nucleation, based on treating the thermodynamic functions of small clusters, was built. This model can predict the values of nucleation rate at high supersaturations with the accuracy much better than the traditional classical nucleation model. The developed model was carefully validated against the experimental data on the nucleation rate for water vapor obtained in a broad range of supersaturations (S = 10–120). At small supersaturation values, the nucleation rate, predicted by the model of the present work, gradually approaches the predictions of classical nucleation theory with the correction factor equal to S−1![[thin space (1/6-em)]](https://www.rsc.org/images/entities/char_2009.gif) exp(σF1/kBT).
exp(σF1/kBT).
On the basis of the developed stationary and non-stationary models, a comprehensive analysis of Al vapor nucleation was conducted. It was shown that, at some value of supersaturation (S = Sd), the double potential nucleation barrier forms. The magnitude of Sd depends on temperature. Moreover, at very high supersaturation values (Sb > 250 at T = 2500 K), the potential nucleation barrier becomes equal to zero, and, at S > Sb, the metastable state of Al vapor cannot be achieved. The computations also demonstrated that the classical nucleation theory, based on the liquid-droplet approximation of the critical cluster, could not predict these features. It was revealed that the existence of a double potential barrier delayed establishing the stationary distribution of subcritical clusters. The simulation of the clustering process showed that the nucleation delay time, predicted by the liquid-droplet model (τls), decreased monotonically with increasing S value. The dependence of nucleation delay time, predicted by a non-stationary model of the present work τs, on supersaturation is more complex. At small supersaturations (S ≤ Sd), the value of τs, increases with the growth of supersaturation. Such a behavior of τs(S) dependence, at S ≤ Sd, is caused by the formation of a double potential barrier. At higher supersaturation values (S > Sd), the time τs decreases with increasing S value.
Acknowledgements
This work was supported by the Russian Foundation for Basic Research (grant no. 14-01-00464). The part concerning the comprehensive analysis of Al vapor nucleation on the basis of the developed stationary and non-stationary nucleation models was supported by the grant of Russian Science Foundation (project no.14-19-01128).
References
- R. Becker and W. Dőring, Ann. Phys., 1935, 24, 719–752 CrossRef CAS.
- J. B. Zel'dovich, J. Exp. Theor. Phys., 1942, 12, 525–538 Search PubMed.
-
J. Frenkel, Kinetic Theory of Liquids, Oxford University, 1947, p. 488 Search PubMed.
- J. L. Schmitt, G. W. Adams and R. A. Zalabsky, J. Chem. Phys., 1982, 77, 2089–2097 CrossRef CAS.
- C. H. Hung, M. J. Krasnopoler and J. L. Katz, J. Chem. Phys., 1989, 90, 1856–1865 CrossRef CAS.
- J. Martens, H. Uchtmann and F. Hensel, J. Phys. Chem., 1987, 91, 2489–2492 CrossRef CAS.
- J. Wölk and R. Strey, J. Phys. Chem. B, 2001, 105, 11683–11701 CrossRef.
- D. Brus, V. Ždimal and J. Smolik, J. Chem. Phys., 2008, 129, 174501 CrossRef PubMed.
- A. Fladerer and R. Strey, J. Chem. Phys., 2006, 124, 164710 CrossRef PubMed.
- K. Iland, J. Wedekind, J. Wölk and R. Strey, J. Chem. Phys., 2009, 130, 114508 CrossRef PubMed.
- W. Courtney, J. Chem. Phys., 1961, 35, 2249–2250 CrossRef CAS.
- J. Lothe and G. M. Pound, J. Chem. Phys., 1962, 36, 2080–2085 CrossRef CAS.
- F. Abraham and G. M. Pound, J. Chem. Phys., 1968, 48, 732–740 CrossRef CAS.
- S. L. Girshick and C. P. Chiu, J. Chem. Phys., 1990, 93, 1273–1277 CrossRef CAS.
- J. Merikanto, E. Zapadinsky, A. Lauri and H. Vehkamaki, Phys. Rev. Lett., 2007, 98, 145702 CrossRef PubMed.
- S. V. Vosel, A. A. Onischuk and P. A. Purtov, J. Chem. Phys., 2009, 131, 204508 CrossRef CAS PubMed.
- K. K. Tanaka, J. Diemand, R. Angélil and H. Tanaka, J. Chem. Phys., 2014, 140, 194310 CrossRef PubMed.
- S. L. Girshick, J. Chem. Phys., 2014, 141, 024307 CrossRef PubMed.
- M. A. Fransen, J. Hrubý, D. M. Smeulders and M. E. van Dongen, J. Chem. Phys., 2015, 142, 164307 CrossRef CAS PubMed.
- A. G. Sutugin and N. A. Fuchs, J. Colloid Interface Sci., 1968, 27, 216–222 CrossRef CAS.
- K. D. Froyd and E. R. Lovejoy, J. Phys. Chem. A, 2003, 107, 9812–9824 CrossRef CAS.
- Z. H. Li, D. Bhatt, N. E. Schultz, J. I. Siepmann and D. G. Truhlar, J. Phys. Chem. C, 2007, 111, 16227–16242 CAS.
- H. Häkkinen, Chem. Soc. Rev., 2008, 37, 1847–1859 RSC.
- F. Dong, S. Heinbuch, Y. Xie, J. J. Rocca and E. R. Bernstein, Phys. Chem. Chem. Phys., 2010, 12, 2569–2581 RSC.
- A. B. Rahane, M. D. Deshpande and V. Kumar, J. Phys. Chem. C, 2011, 115, 18111–18121 CAS.
- A. M. Starik, A. S. Sharipov, B. I. Loukhovitski and A. M. Savel'ev, Phys. Scr., 2016, 91, 013004 CrossRef.
- H. Vehkamäki and I. J. Ford, J. Chem. Phys., 2000, 112, 4193–4202 CrossRef.
- J. Merikanto, H. Vehkamäki and E. Zapadinsky, J. Chem. Phys., 2004, 121, 914–924 CrossRef CAS PubMed.
- S. M. Kathmann, G. K. Schenter, B. C. Garrett, B. Chen and J. I. Siepmann, J.
Phys. Chem. C, 2009, 113, 10354–10370 CAS.
- C. R. A. Catlow, S. T. Bromley, S. Hamad, M. Mora-Fonz, A. A. Sokol and S. M. Woodley, Phys. Chem. Chem. Phys., 2010, 12, 786–811 RSC.
- E. R. Lovejoy, J. Curtius and K. D. Froyd, J. Geophys. Res., 2004, 109, D08204 CrossRef.
- S. L. Girshick, P. Agarwal and D. G. Truhlar, J. Chem. Phys., 2009, 131, 134305 CrossRef PubMed.
- R. Jansen, I. Wysong, S. Gimelshein, M. Zeifman and U. Buck, J. Chem. Phys., 2010, 132, 244105 CrossRef PubMed.
- A. Borner, Z. Li and D. A. Levin, J. Chem. Phys., 2013, 138, 064302 CrossRef PubMed.
- R. S. Berry and B. M. Smirnov, Phys.-Usp., 2009, 52, 137–164 CrossRef CAS.
- K. D. Ball and R. S. Berry, J. Chem. Phys., 1999, 111, 2060–2070 CrossRef CAS.
- D. S. Corti, P. G. Debenedetti, S. Sastry and F. H. Stillinger, Phys. Rev. E: Stat. Phys., Plasmas, Fluids, Relat. Interdiscip. Top., 1997, 55, 5522–5534 CrossRef CAS.
- B. I. Loukhovitski, A. S. Sharipov and A. M. Starik, J. Phys. Chem. A, 2015, 119, 1369–1380 CrossRef CAS PubMed.
- A. Lauri, J. Merikanto, E. Zapadinsky and H. Vehkamaki, Atmos. Res., 2006, 82, 489–502 CrossRef CAS.
- I. T. Yakubov, A. G. Khrapak, V. V. Pogosov and S. A. Trigger, Phys. Status Solidi B, 1988, 145, 455–466 CrossRef CAS.
- D. I. Zhukhovitskii, J. Chem. Phys., 1994, 101, 5076–5080 CrossRef CAS.
- F. Yu, J. Chem. Phys., 2007, 127, 054301 CrossRef PubMed.
- A. A. Lushnikov and A. G. Sutugin, Russ. Chem. Rev., 1976, 45, 197–212 CrossRef.
-
D. Kashchiev, Nucleation: Basic Theory with Applications, Butterworth-Heinemann, Oxford, 2000, p. 529 Search PubMed.
- M. Blander and J. L. Katz, J. Stat. Phys., 1972, 4, 55–59 CrossRef.
- B. N. Hale, Metall. Mater. Trans. A, 1992, 23, 1863–1868 CrossRef.
- G. Wilemski, J. Chem. Phys., 1995, 103, 1119–1126 CrossRef CAS.
-
D. I. Zhukhovitskii, in Progress in Physics of Clusters, ed. G. N. Chuev, V. D. Lakhno and A. P. Nefedov, World Scientific Publ., Singapore, 1998, pp. 71–98 Search PubMed.
- P. R. ten Wolde, D. W. Oxtoby and D. Frenkel, J. Chem. Phys., 1999, 111, 4762–4773 CrossRef CAS.
- B. N. Hale and M. Thomason, Phys. Rev. Lett., 2010, 105, 046101 CrossRef PubMed.
- V. I. Kalikmanov, J. Chem. Phys., 2006, 124, 124505 CrossRef CAS PubMed.
-
V. I. Kalikmanov, Nucleation Theory, Lecture Notes in Physics, Springer, Dordrecht, 2013, vol. 860, p. 316 Search PubMed.
- J. Merikanto, J. Duplissy, A. Määttänen, H. Henschel, N. M. Donahue, D. Brus, S. Schobesberger, M. Kulmala and H. Vehkamäki, J. Geophys. Res.: Atmos., 2016, 121, 1736–1751 CAS.
- J. Wölk, R. Strey, C. H. Heath and B. E. Wyslouzil, J. Chem. Phys., 2002, 117, 4954–4960 CrossRef.
-
J. Teixeira and A. Luzar, in Hydration Processes in Biology: Theoretical and Experimental Approaches, ed. M.-C. Bellissent-Funel, IOS Press, Amsterdam, 1999, pp. 35–68 Search PubMed.
- S. S. Xantheas, C. J. Burnham and R. J. Harrison, J. Chem. Phys., 2002, 116, 1493–1504 CrossRef CAS.
- M. E. Dunn, E. K. Pokon and G. C. Shields, J. Am. Chem. Soc., 2004, 126, 2647–2653 CrossRef CAS PubMed.
- K. H. Lemke and T. M. Seward, J. Geophys. Res., 2008, 113, D19304 CrossRef.
- R. M. Shields, B. Temelso, K. A. Archer, T. E. Morrell and G. C. Shields, J. Phys. Chem. A, 2010, 114, 11725–11737 CrossRef CAS PubMed.
- P. Miró and C. J. Cramer, Phys. Chem. Chem. Phys., 2013, 15, 1837–1843 RSC.
- K. E. Otto, Z. Xue, P. Zielke and M. A. Suhm, Phys. Chem. Chem. Phys., 2014, 16, 9849–9858 RSC.
-
A. Burcat and B. Ruscic, Third millenium ideal gas and condensed phase thermochemical database for combustion with update from active thermochemical tables, Tech. Rep., Argonne National Laboratory, 2005, p. 30 Search PubMed.
- V. Holten, D. G. Labetski and M. E. van Dongen, J. Chem. Phys., 2005, 123, 104505 CrossRef CAS PubMed.
- B. N. Hale, J. Chem. Phys., 2005, 122, 204509 CrossRef PubMed.
-
N. A. Vatolin and E. A. Pastuhov, Diffraction investigation of the structure of high temperature melts, Science Publisher, Moscow, (in Russian), 1980, p. 188 Search PubMed.
-
Handbook of Aluminum. Vol. 1: Physical Metallurgy and Processes, ed. G. E. Totten and D. S. Mackenzie, Marcel Dekker Inc., 2003, p. 1296 Search PubMed.
-
CRC Handbook of Chemistry and Physics, ed. D. R. Lide, CRC Press, 90th edn, 2009, p. 2804 Search PubMed.
- V. Sarou-Kanian, F. Millot and J. C. Rifflet, Int. J. Thermophys., 2003, 24, 277–286 CrossRef CAS.
- M. M. Martynyuk, Russ. J. Phys. Chem., 1998, 72, 13–16 Search PubMed.
- J. K. Singh, J. Adhikari and S. K. Kwak, Fluid Phase Equilib., 2006, 248, 1–6 CrossRef CAS.
- I. V. Lomonosov, Laser Part. Beams, 2007, 25, 567–584 CrossRef CAS.
- D. G. Gordeev, L. F. Gudarenko, M. V. Zhernokletov, V. G. Kudel'kin and M. A. Mochalov, Combust., Explos. Shock Waves, 2008, 44, 177–189 CrossRef.
- G. Faussurier, C. Blancard and P. L. Silvestrelli, Phys. Rev. B: Condens. Matter Mater. Phys., 2009, 79, 134202 CrossRef.
|
| This journal is © the Owner Societies 2017 |
Click here to see how this site uses Cookies. View our privacy policy here. 


![[thin space (1/6-em)]](https://www.rsc.org/images/entities/char_2009.gif) exp(−ΔGg/kBT).
exp(−ΔGg/kBT).![[thin space (1/6-em)]](https://www.rsc.org/images/entities/char_2009.gif) ln(P1/P∞) + σFg,
ln(P1/P∞) + σFg,


![[thin space (1/6-em)]](https://www.rsc.org/images/entities/char_2009.gif) ln
ln![[thin space (1/6-em)]](https://www.rsc.org/images/entities/char_2009.gif) S.
S.

![[thin space (1/6-em)]](https://www.rsc.org/images/entities/char_2009.gif) Ng − ln
Ng − ln![[thin space (1/6-em)]](https://www.rsc.org/images/entities/char_2009.gif) Qg),
Qg),


![[thin space (1/6-em)]](https://www.rsc.org/images/entities/char_2009.gif) ln(P∞/P0) are valid, for the equilibrium constant Ke,g one can write
ln(P∞/P0) are valid, for the equilibrium constant Ke,g one can write


 . So, for the droplets comprising 100 monomers, this inaccuracy does not exceed 1%. It should be emphasized that the similar approach for the estimation of potential μ0g was applied earlier in a few studies addressing the development of nucleation models (see, for example, ref. 46 and 47). In those works, the authors upon the calculation of the sum
  used the Euler–Maclaurin formula, when leaving only one or two terms in the expansion after the integral
  . Our estimation is based on neglecting these terms.


![[thin space (1/6-em)]](https://www.rsc.org/images/entities/char_2009.gif) exp(σF1/kBT)IFZ,
exp(σF1/kBT)IFZ,
![[thin space (1/6-em)]](https://www.rsc.org/images/entities/char_2009.gif) ln(P1/P0).
ln(P1/P0).![[thin space (1/6-em)]](https://www.rsc.org/images/entities/char_2009.gif) ln(P∞/P0) + σ(Fg − F1).
ln(P∞/P0) + σ(Fg − F1).![[thin space (1/6-em)]](https://www.rsc.org/images/entities/char_2009.gif) exp(−27.56 + 6500/T),
exp(−27.56 + 6500/T),


![[thin space (1/6-em)]](https://www.rsc.org/images/entities/char_2009.gif) 500
500![[thin space (1/6-em)]](https://www.rsc.org/images/entities/char_2009.gif) 723
723

![[thin space (1/6-em)]](https://www.rsc.org/images/entities/char_2009.gif) exp(σF1/kBT).
exp(σF1/kBT).


