Mechanism for the enhanced oxygen reduction reaction of La0.6Sr0.4Co0.2Fe0.8O3−δ by strontium carbonate†
Mei
Li‡
a,
Zhongti
Sun‡
a,
Wenqiang
Yang
a,
Tao
Hong
a,
Zhesheng
Zhu
a,
Yanxiang
Zhang
b,
Xiaojun
Wu
*ac and
Changrong
Xia
*a
aKey Laboratory of Materials for Energy Conversion, Chinese Academy of Sciences, Department of Materials Science and Engineering & Collaborative Innovation Center of Suzhou Nano Science and Technology, University of Science and Technology of China, No. 96 Jinzhai Road, Hefei, Anhui Province 230026, P. R. China. E-mail: xiacr@ustc.edu.cn
bSchool of Materials Science and Engineering, Harbin Institute of Technology, Harbin, Heilongjiang 150001, China
cHefei National Laboratory of Physical Sciences at the Microscale, Synergetic Innovation of Quantum Information & Quantum Technology, University of Science and Technology of China, No. 96 Jinzhai Road, Hefei, Anhui Province 230026, P. R. China
First published on 7th November 2016
Abstract
Strontium doped lanthanum cobalt ferrite (LSCF) is a widely applied electrocatalyst for the oxygen reduction reaction (ORR) in solid-oxide fuel cells (SOFCs) operated at intermediate temperatures. Sr surface segregation in long-term operation has been reported to have contradicting effects that either degrade or improve the reaction. Thus, it is critical to understand the mechanism of surface Sr compounds on ORR kinetics. This work aims to verify the effect and propose the mechanism by decorating SrCO3 nanoparticles using the infiltration method. Electrochemical conductivity relaxation measurements show that SrCO3 particles improve the chemical oxygen surface exchange coefficient by up to a factor of 100. The electrochemical performance is significantly improved by the infiltration of SrCO3, which is comparable to those obtained by typical electrocatalysts including precious metals such as Pd and Rh. Distribution of relaxation time (DRT) analysis shows that the performance enhancement is strongly related to the improved kinetics of charge transfer and oxygen incorporation processes. Density functional theory calculations show that the surface SrCO3 reduces the O2 dissociation energy barrier from 1.01 eV to 0.33 eV, thus enhancing the ORR kinetics, possibly through changing the charge density distribution at the LSCF–SrCO3 interface.
Introduction
Solid oxide fuel cells (SOFCs) convert chemical energy from the fuel and oxygen molecules directly into electricity, and have advantages such as high efficiency and modularity, and excellent fuel flexibility.1,2 The oxygen molecules are electrochemically reduced to oxygen ions on electrocatalysts, the cathode material in SOFCs. Strontium doped lanthanum cobalt ferrite, typically in the form of La0.6Sr0.4Co0.2Fe0.8O3−δ (LSCF), is one of the most extensively investigated electrocatalysts of the past few decades due to its decent catalytic activity for the oxygen reduction reaction (ORR), its outstanding mixed ionic and electronic conductivities, and its excellent thermal expansion match with electrolyte materials in the intermediate-temperature range for SOFC operation. When LSCF is exposed to SOFC operation environments, Sr surface segregation is observed, forming secondary phases on the surface. This Sr surface segregation phenomenon is considered to be a critical challenge for LSCF application in SOFCs.Sr surface segregation is generally considered to be responsible for performance degradation, as the formation of an Sr–O compound can block active surface sites and thus deactive the surface for ORR.3–5 For example, the performance of an anode-supported single cell, which consists of a Ni/YSZ (yttria stabilized zirconia) anode, a YSZ/SDC (samaria doped ceria) electrolyte and a LSCF cathode, decreased rapidly with testing time, showing a degradation of 13% for the first 50 h.4 Meanwhile, the cathode interfacial polarization resistance noticeably increased with testing time. The formation of SrO and SrCO3 and changes (physical or chemical) at or close to the cathode–electrolyte interface are presumed to be the reasons for the performance degradation. In contrast, as described by Baumann et al.,6 cathodic polarization leads to surface Sr enrichment, which promotes electrochemical activation from changes in the surface composition and the non-equilibrium state of the electrode surface. For example, the interfacial polarization resistance is 8.5 Ω cm2, which decreases to 0.18 Ω cm2 by the application of cathodic activation with −2.5 V for 10 min at 750 °C. XPS results show that the cathodic activation is accompanied by significant cation surface concentration changes, leading to an increased Sr content.
Contradicting effects have been reported for Sr surface segregation. The negative effect is that it causes performance degradation by reducing the active reaction ORR sites. The positive effect is that it improves the catalytic activity for ORR. These effects are caused by surface Sr–O compounds, i.e., SrO, Sr(OH)2, SrCO3, and other Sr-rich phases. It is noted that SrO and Sr(OH)2 are not thermodynamically stable but SrCO3 is stable in the SOFC operation conditions, i.e., at intermediate temperatures from 600 to 750 °C and in the cathode atmosphere, which is typically air that contains CO2 and H2O.7 Therefore, this work intends to investigate the functional mechanism of SrCO3 decoration on the ORR activity of LSCF. The SrCO3 particles are deposited via an infiltration technique. We find that SrCO3 can improve the ORR kinetics and thus reduce the interfacial polarization resistance. The improvement is mainly due to the fact that the existence of SrCO3 can alter the charge distribution, which facilitates the oxygen dissociation process as verified by density functional theory calculations.
Experimental
Cell fabrication
Symmetrical cells consisting of La0.6Sr0.4Co0.2Fe0.8O3−δ (LSCF) electrodes and Sm0.2Ce0.8O1.9 (SDC) electrolytes were fabricated to evaluate the catalytic activity. The SDC powder was uniaxially pressed into disk-shaped pellets at 250 MPa, using a 13 mm diameter stainless steel die, and then heated at 1400 °C for 5 h in air to form dense SDC electrolytes with a diameter of about 10.0 mm and a thickness of about 0.5 mm. To prepare the electrode layers, LSCF slurry, which was fabricated by mechanically mixing LSCF powders well with α-terpineol and ethyl cellulose, was symmetrically deposited onto both sides of the electrolytes using a screen-printing technique. After drying under an infrared lamp, the freshly sandwiched bodies were heated at 1000 °C for 2 h to form symmetrical cells consisting of dense SDC electrolytes and porous LSCF electrodes.Sr(Ac)2 (99.0%) was dissolved in distilled water to form the infiltration solution with a metal ion concentration of 0.1 mol L−1. The solution was dropped onto the porous LSCF layer of the symmetrical cells using a milliliter syringe. Each infiltration step was followed by heating at 750 °C for 2 h to form the SrCO3 nanoparticles. The mass of the samples was measured before and after each infiltration cycle to estimate the infiltration loading, which was expressed as the mass ratio of SrCO3 to the LSCF backbones.
ECR measurement
The SrCO3 effect on the chemical oxygen surface exchange coefficient (Kchem) was determined using electrical conductivity relaxation (ECR) methods8–10 with LSCF bar specimens that were approximately 31.50 × 5.40 × 0.92 mm3 in size. LSCF powder was isostatically pressed into a rectangular bar at 300 MPa, and was then heated at 1400 °C for 5 h in air. The bar samples had a relative density greater than 96% as determined using the Archimedes method. The bars were then coated with the Sr(Ac)2 solution, dried, and heated at 750 °C for 2 h. The loading was about 0.25 mg cm−2. The Kchem values were determined when the oxygen partial pressure changed from 0.21 to 1.0 atm. The specific process used to conduct the ECR measurements and its fundamental basis have been described in previous work.11 A digital multimeter (Keithley, 2001-785D) was used to record the resistance of the bars using the four-probe method.Characterization
The phase structures were investigated using X-ray diffraction (XRD, Rigaku TTR-III diffractometer) with a Cu-Kα radiation source. The XRD patterns were obtained in the range of 20–80° using a 0.02° step size and a scan speed of 10° min−1 at 40 kV and 200 mA. A TG Analyzer (NETZSCH STA 449F3) was used for thermogravimetry analysis to determine the decomposition behavior of Sr(Ac)2 in air. The test temperature ranged from room temperature to 1400 °C with a ramp rate of 10 °C min−1. The morphologies were characterized using scanning electron microscopy (SEM, JSM-6700F), high resolution transmission electron microscopy (HRTEM) and selected area electron diffraction (SAED) (JEM-2010, 200 kV). The interfacial polarization resistance was determined using AC impedance spectroscopy with a Solartron 1260 Frequency Response Analyzer combined with a Solartron 1287 potentiostat. The measurement was conducted in ambient air with a frequency range of 0.01 Hz to 1 MHz and a bias voltage of 10 mV. All symmetric cell impedances were divided by two to account for there being two identical electrodes. Silver wires were attached to both sides of the symmetrical cell with silver paste (SRISR DAD-87) for current collection. All measurements were conducted in a two-electrode setup, and no reference electrode was used.Results and discussion
Formation of SrCO3 decoration
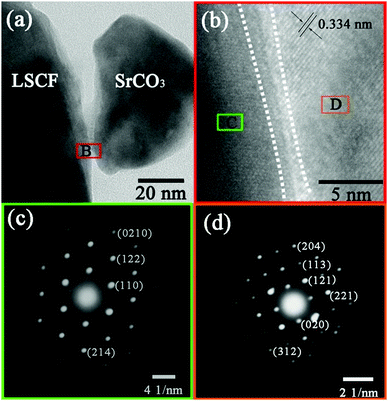
The infiltration–calcination process resulted in SrCO3 particles as shown in the TG analysis, Fig. S1 (ESI†). At 525 °C, Sr(Ac)2 is completely changed into SrCO3, and it is thermally stable in air at the temperature range of 550 to 800 °C. Therefore, the SrCO3 formed when the infiltrated Sr(Ac)2 is calcinated at 750 °C for 2 h. The compatibility of SrCO3 with LSCF and SDC was investigated using XRD analysis, Fig. S2 (ESI†). When Sr(Ac)2 was heated at 750 °C for 5 h, it completely decomposed into SrCO3, which is thermally stable at 750 °C since no peaks for SrO were observed, Fig. S2c (ESI†). The chemical compatibility between SrCO3 and LSCF was investigated by comparing the XRD patterns of the LSCF–SrCO3 composite and the single phases. All of the peaks in Fig. S2b could be attributed to either SrCO3 (Fig. S2c, ESI†) or LSCF (Fig. S2a, ESI†) and the peak positions were not shifted, suggesting SrCO3 was compatible with LSCF in the experimental conditions, i.e. co-heating the LSCF–Sr(AC)2 mixture from room temperature to 750 °C, at which temperature it was kept for 5 h. Similarly, no detectable chemical reactions were seen between SDC and SrCO3, Fig. S2c and d (ESI†). Thus, SrCO3 is compatible with the LSCF electrode and SDC electrolyte in the conditions of electrode fabrication and at the intermediate operation temperatures for SOFCs.HRTEM micrographs and SAED patterns were used to verify a possible interfacial reaction such as the formation of a Ruddlesden–Popper structure at the SrCO3–LSCF interface (Fig. 1). The micrographs show good connection as well as the distinct boundary between the LSCF and SrCO3 particles. The partial enlargement of the interfacial region B in Fig. 1b indicates that there are no reactions between the two phases. The distance between the lattice fringes is measured to be about 0.334 nm, which corresponds to the (021) plane of orthorhombically structured SrCO3. Fig. 1c and d show the SAED patterns of region C and region D, which correspond to the electron diffraction patterns of the LSCF and SrCO3 phase, respectively. The SAED patterns also illustrate that both of the phases keep their original structure after the heat treatment, suggesting that the performance change should not be caused by any new phases formed between SrCO3 and LSCF. Therefore, SrCO3 formed when the infiltrated Sr(Ac)2 is calcinated under the experimental conditions. The fabrication process does not cause any solid-state reactions between SrCO3 and LSCF. Furthermore, no new phases such as Ruddlesden–Popper structure oxides were formed at the two-phase interface.
SrCO3 effect on oxygen surface exchange kinetics
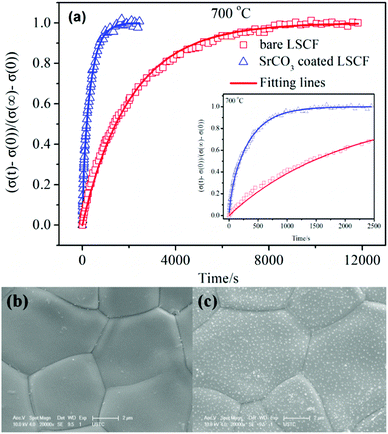
Fig. 2a shows the typical normalized conductivity relaxation profiles and their fitting curves. The fitting results matched the experimental data well. At 700 °C, the re-equilibrium time was about 10![[thin space (1/6-em)]](https://www.rsc.org/images/entities/char_2009.gif) 000 s for the bare LSCF bar, and was fully dense (Fig. 2b). When the LSCF surface was coated with SrCO3 nanoparticles, which were distributed uniformly on the dense LSCF surface and had a size of about 60 nm (Fig. 2c) the re-equilibrium time decreased to about 2000 s. The reduced re-equilibrium time demonstrated enhanced surface reaction kinetics since the bulk transport properties should not be changed by the surface particles. The surface reaction kinetics are usually quantitatively represented by Kchem, the chemical oxygen surface exchange coefficient, which can be obtained from the fitting results shown in Fig. 2a. Kchem was 2.2 × 10⁻⁵ cm s−1 at 700 °C for the bare LSCF, which was fabricated using the combustion derived powders at 1400 °C. This value is consistent with reported values of 1.0–2.6 ×10⁻⁵ cm s−1 for LSCF prepared using the solid-state reaction method, which noted that Kchem could be affected by the fabrication process as well as the oxygen partial pressure.12,13 When SrCO3 particles were deposited, Kchem at 700 °C increased by about two orders of magnitude, from 2.2 × 10⁻⁵ to 2.4 × 10⁻³ cm s−1, demonstrating a significant enhancement of the surface reaction kinetics. Table 1 lists the values of Kchem for LSCF determined using the ECR method at different temperatures. The mechanism for the enhanced kinetics reaction by strontium carbonate is worth exploring.
000 s for the bare LSCF bar, and was fully dense (Fig. 2b). When the LSCF surface was coated with SrCO3 nanoparticles, which were distributed uniformly on the dense LSCF surface and had a size of about 60 nm (Fig. 2c) the re-equilibrium time decreased to about 2000 s. The reduced re-equilibrium time demonstrated enhanced surface reaction kinetics since the bulk transport properties should not be changed by the surface particles. The surface reaction kinetics are usually quantitatively represented by Kchem, the chemical oxygen surface exchange coefficient, which can be obtained from the fitting results shown in Fig. 2a. Kchem was 2.2 × 10⁻⁵ cm s−1 at 700 °C for the bare LSCF, which was fabricated using the combustion derived powders at 1400 °C. This value is consistent with reported values of 1.0–2.6 ×10⁻⁵ cm s−1 for LSCF prepared using the solid-state reaction method, which noted that Kchem could be affected by the fabrication process as well as the oxygen partial pressure.12,13 When SrCO3 particles were deposited, Kchem at 700 °C increased by about two orders of magnitude, from 2.2 × 10⁻⁵ to 2.4 × 10⁻³ cm s−1, demonstrating a significant enhancement of the surface reaction kinetics. Table 1 lists the values of Kchem for LSCF determined using the ECR method at different temperatures. The mechanism for the enhanced kinetics reaction by strontium carbonate is worth exploring.
| Preparation process | K chem | P 1 | P 2 | T | Ref. | |
|---|---|---|---|---|---|---|
| Bare LSCF | Solid state reaction, 1200 °C | 1.0 × 10⁻⁵ | 0.12 | 0.36 | 700 | 12 |
| 1.8 × 10⁻⁵ | 750 | |||||
| Solid state reaction, 1500 °C | 2.6 × 10⁻⁵ | 0.01 | 0.1 | 700 | 13 | |
| Combustion, 1400 °C | 2.2 × 10⁻⁵ | 0.21 | 1 | 700 | This work | |
| 4 × 10⁻⁵ | 750 | |||||
| Coated-LSCF | Combustion, 1400 °C | 2.4 × 10⁻³ | 0.21 | 1 | 700 | This work |
| 4.7 × 10⁻³ | 750 | |||||
The surface step for ORR on LSCF can be written as:14
The reaction is strongly related to the concentration of oxygen vacancy and electrons, which are not available for SrCO3 since it is not a conductor. So, SrCO3 is not a catalyst for ORR. Recently, Mutoro et al.15 have suggested the formation of a hetero-interface of Ruddlesden–Popper structured La2−xSrxCoO4 between La1−xSrxCoO3 and Sr-compounds (SrO/Sr(OH)2/SrCO3) decorated on the surface. The hetero-interface increases the oxygen reduction kinetics of the La1−xSrxCoO3 film. However, no hetero-interfaces are shown from the HRTEM and SAED investigation, demonstrating the enhancement is not caused by new phase formation between SrCO3 and LSCF. From a physical perspective, the increased Kchem, i.e. the increased reaction rate, should have been caused by the enhanced ORR at the interface of LSCF–SrCO3. Therefore, we assume SrCO3 may affect the charge density distribution of Fe and Co, which will be discussed later with density functional theory (DFT) calculations.
Interfacial polarization resistance reduced with SrCO3
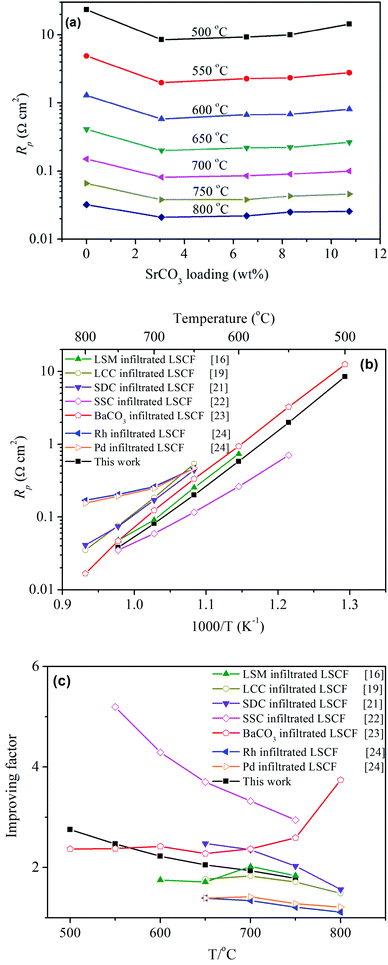
To evaluate the effect of SrCO3 on the oxygen reduction properties, electrochemical impedance spectroscopy (EIS) was conducted in an ambient environment with the symmetrical cells consisting of LSCF electrodes and SDC electrolytes. The structure of the LSCF electrodes is shown in Fig. S3 (ESI†). Fig. 3a presents the interfacial polarization resistance (Rp) for LSCF electrodes infiltrated with different amounts of SrCO3. Rp was noticeably reduced with increasing SrCO3. For example, Rp at 600 °C was 1.29 Ω cm2 for the bare LSCF electrode. The resistance agrees well with values reported for LSCF electrodes on doped ceria electrolytes: 1.27 Ω cm2 from Liu et al.16 and 1.2 Ω cm2 from Leng et al.17 It was reduced to 0.58 Ω cm2 at the same temperature when 3.06 wt% SrCO3 was deposited. The resulting resistances were even lower than those for the typical composite electrodes with doped ceria as the second phase. For instance, at 700 °C, Rp was 0.081 Ω cm2, which is about 1/3 of 0.306 Ω cm2 for the LSCF–SDC (5![[thin space (1/6-em)]](https://www.rsc.org/images/entities/char_2009.gif) :
:![[thin space (1/6-em)]](https://www.rsc.org/images/entities/char_2009.gif) 5) composite electrode.18 In addition, it is about 1/2 of 0.184 Ω cm2 for a LSCF electrode infiltrated with the oxygen ion conductor La0.4875Ca0.0125Ce0.5O2−δ (LCC).19
5) composite electrode.18 In addition, it is about 1/2 of 0.184 Ω cm2 for a LSCF electrode infiltrated with the oxygen ion conductor La0.4875Ca0.0125Ce0.5O2−δ (LCC).19
Fig. 3b compares Rp for LSCF electrodes infiltrated with various materials including typical oxygen ion conductors such as SDC, LCC and ORR catalysts of LSM (La0.8Sr0.2MnO3−δ), SSC (Sm0.5Sr0.5CoO3), Rh and Pd. The figure clearly demonstrates that LSCF infiltrated with SrCO3 exhibits a lower Rp than most of the investigated materials except for SSC, which has high catalytic activity for ORR but a much higher thermal expansion coefficient than the electrolyte. It is noted that Rp depends not only on the catalytic activity of the electrode material but also on the microstructures of the electrode and the electrolyte. So, the direct comparison of Rp does not fully show the infiltration effect of different materials since their microstructures could be different as a result of the different preparation routes. The infiltration effect could be directly compared using a performance improving factor, which was proposed by Jiang20 to describe the enhancement on the catalytic activity. Fig. 3c shows that the improving factor for SrCO3 was higher than that of Pd and Rh, the precious metal electrocatalysts, comparable to that of LSM, the conventional electrocatalyst for SOFCs, but lower than those of SDC, SSC and BaCO3.21–24 The factor for SrCO3 was also comparable to that of SDC and LCC, the oxygen ion conductors. In addition, single cells of LSCF, with and without SrCO3, were also investigated. The peak power density increased from 1.08 to 1.25 W cm−2 at 750 °C, which illustrates that the SrCO3 nanoparticles accelerated the activity for ORR of LSCF (see ESI† for more details). Noting that SrCO3 is not a catalyst for ORR or an oxygen-ion conductor that could extend the reaction sites, the mechanism for the enhanced ORR is not clear and thus is worth studying.
It is noted that there is a big gap in the extent of the improvements in Kchem and Rp. Kchem is the direct evidence while Rp may be the indirect one for the improvement of ORR, since Rp includes many elementary steps like gas diffusion in the porous electrode, oxygen diffusion into the electrolyte etc., which may be influenced by the structure of the porous LSCF cathode as well as the ionic conductivities of the electrode and electrolyte materials.25
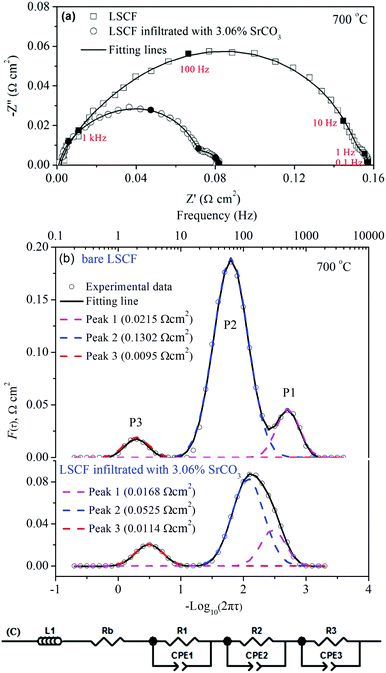
Fig. 4a shows the EIS for the symmetrical cells measured at 700 °C. The impedance spectrum was analyzed using the distribution of relaxation time (DRT) method.26–29Fig. 4b shows the F(τ) distribution of the logarithm for the relaxation time τ, which is defined as a function of the frequency f, i.e. τ = 1/2πf, F(τ) = τG(τ)ln![[thin space (1/6-em)]](https://www.rsc.org/images/entities/char_2009.gif) 10 in which G(τ) is the DRT of impedance.28,30 Each peak in the DRT profile is an indication of a sub-process in the oxygen reduction reaction. The area under the peak is the polarization resistance corresponding to the sub-process. The DRT curves are well fitted with three peaks, i.e. P1, P2 and P3, Fig. 4b. Consequently, the impedance should be fitted with the equivalent circuit (LRb(RiCPEi)) as shown in Fig. 4c. The fitting lines are also shown in Fig. 4a, demonstrating that the fitting results matched well with the EIS data. As shown in the ESI,† the sub-processes for P1 and P2 are charge transfer and oxygen incorporation processes, respectively, while the sub-process for P3 is the oxygen gas diffusion within the electrode. When SrCO3 is infiltrated, the area for P1 is reduced from 0.022 to 0.017 Ω cm2 and for P2 from 0.13 to 0.053 Ω cm2. The significant reduction in P2 demonstrates that the oxygen incorporation process is highly accelerated by SrCO3. The decreased resistance in P1 and P2 also suggests that the charge density distribution of LSCF is affected by SrCO3, which was further explored using DFT calculations. It should be noted that the area for P3 is slightly increased from 0.0095 to 0.012 Ω cm2. The increased resistance for the oxygen gas diffusion process is possibly caused by the decreased pore size and porosity associated with SrCO3 deposition, Fig. S3 (ESI†).
10 in which G(τ) is the DRT of impedance.28,30 Each peak in the DRT profile is an indication of a sub-process in the oxygen reduction reaction. The area under the peak is the polarization resistance corresponding to the sub-process. The DRT curves are well fitted with three peaks, i.e. P1, P2 and P3, Fig. 4b. Consequently, the impedance should be fitted with the equivalent circuit (LRb(RiCPEi)) as shown in Fig. 4c. The fitting lines are also shown in Fig. 4a, demonstrating that the fitting results matched well with the EIS data. As shown in the ESI,† the sub-processes for P1 and P2 are charge transfer and oxygen incorporation processes, respectively, while the sub-process for P3 is the oxygen gas diffusion within the electrode. When SrCO3 is infiltrated, the area for P1 is reduced from 0.022 to 0.017 Ω cm2 and for P2 from 0.13 to 0.053 Ω cm2. The significant reduction in P2 demonstrates that the oxygen incorporation process is highly accelerated by SrCO3. The decreased resistance in P1 and P2 also suggests that the charge density distribution of LSCF is affected by SrCO3, which was further explored using DFT calculations. It should be noted that the area for P3 is slightly increased from 0.0095 to 0.012 Ω cm2. The increased resistance for the oxygen gas diffusion process is possibly caused by the decreased pore size and porosity associated with SrCO3 deposition, Fig. S3 (ESI†).
Density functional theory calculation
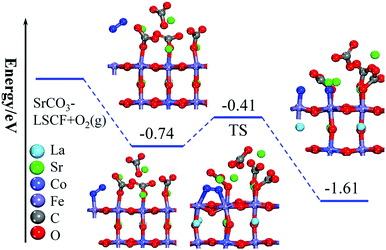
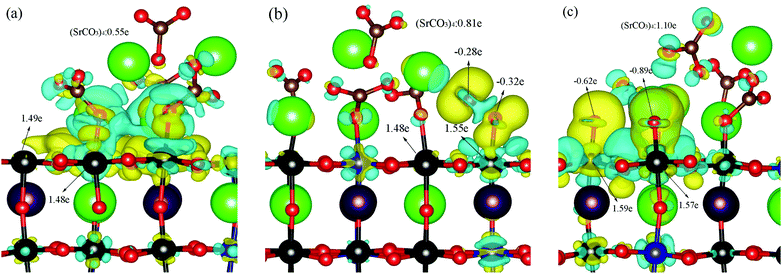
DFT-based first-principles calculations were performed to understand the enhanced ORR capability of LSCF modified with SrCO3 (see ESI† for more details). A SrCO3 cluster containing four SrCO3 formula units was used to decorate an LSCF(100) surface, illustrated in Fig. S6–S8 (ESI†). Furthermore, the adsorption and dissociation behaviors of O2 on bare and SrCO3 decorated LSCF surfaces were investigated. The optimized structures are displayed in Fig. S9 and S10 (ESI†), and the calculated adsorption energies are summarized in Tables S2 and S3 (ESI†). The calculated adsorption energy of the O2 molecule on the SrCO3 decorated LSCF surface is −0.74 eV, which is stronger than that of the bare LSCF surface (−0.32 eV).31 Therefore, the existence of SrCO3 on the LSCF surface significantly enhanced the adsorption behavior of the O2 molecule. In addition, the dissociation energy barrier of the O2 molecule on the SrCO3-decorated LSCF surface was calculated, as shown in Fig. 5. Our previous study showed that the dissociation energy barrier of O2 on bare LSCF(100) surfaces is 1.01 eV and the whole reaction is exothermic with a reaction energy of −0.02 eV.31 Interestingly, on the SrCO3 modified LSCF(100) surface, the dissociation energy barrier of the O2 molecule reduces to 0.33 eV and the whole reaction is exothermic with a decreased reaction energy of −1.61 eV, implying an enhanced adsorption and dissociation of O2 on SrCO3 modified LSCF, which is consistent with the experimental results.To reveal the mechanism for the enhanced performance of SrCO3-modified LSCF, the differential charge density and the atomic charges of the involved atoms were investigated using the Bader charge analysis method. As shown in Fig. 6a, a strong interaction between the (SrCO3)4 cluster and the LSCF support can be observed, with electrons transferred from the (SrCO3)4 cluster to the LSCF surface, resulting in a positive (SrCO3)4 cluster on the LSCF surface with total charge of 0.55 e. With the adsorption of O2 on the LSCF surface, more charges (0.81 e) were transferred from the (SrCO3)4 cluster to the LSCF(100) surface and the adsorbed O2 has a negative charge of 0.6 e. The value is higher than that (0.41 e) on the bare LSCF(100) surface,31 implying that the adsorption of O2 on SrCO3-modified LSCF is enhanced. In addition, the O–O bond was elongated from 1.234 to 1.299 Å due to electrons being injected into the anti-bonding orbital on the oxygen molecule on the LSCF surface. Furthermore, the dissociated oxygen molecule possessed a charge of 1.51 e, which is larger than that of the bare LSCF(100) surface (0.92 e).31 All of the calculated values of the charge and bond lengths are summarized in Table 2. The increased atomic charges of oxygen on SrCO3-modified LSCF were confirmed by XPS results, as shown in Fig. S11 and Table S4 (ESI†). The calculated differential charge density and atomic charge analysis indicated that the charge transfer from SrCO3 to the LSCF surface mainly contributed to the enhanced adsorption and dissociation of the oxygen molecule on the SrCO3-modified LSCF(100) surface.
| Species | E ads/eV | R O–O/Å | Atomic charge/e | Ref. | |||
|---|---|---|---|---|---|---|---|
| O1 | O2 | Osum | (SrCO3)4 | ||||
| Fe1-super | −0.32 | 1.258 | −0.17 | −0.02 | −0.19 | — | 28 |
| Fe1–Co-diss | −0.02 | — | −0.48 | −0.44 | −0.92 | — | |
| Fe-5 | −0.74 | 1.299 | −0.32 | −0.28 | −0.60 | 0.81 | This work |
| Fe–Fe-diss | −1.61 | — | −0.89 | −0.62 | −1.51 | 1.10 | |
Conclusions
Sr surface segregation results in secondary phases (SrO/Sr(OH)2/SrCO3) on an LSCF surface. It is reported that the secondary phases can either improve or reduce the ORR activity of LSCF. To verify the contradicting effects, an LSCF surface was decorated with SrCO3, which is thermodynamically stable in the operation conditions for intermediate-temperature SOFCs. The infiltration derived SrCO3 nanoparticles were chemically compatible with LSCF and no hetero-interface structures were formed between SrCO3 and LSCF. The SrCO3 nanoparticles improved the oxygen chemical surface exchange coefficient by up to a factor of 100 at 700 °C, demonstrating that SrCO3 can substantially enhance the ORR kinetics and thus show synergistic catalytic activity for the electrochemical reduction reaction. As a result, the SrCO3 nanoparticles reduce the interfacial polarization resistance of the LSCF electrodes on the SDC electrolytes, from 0.157 to 0.081 Ω cm2 at 700 °C, with an improving factor of 1.94. This is comparable to that of LSM and is higher than that of Pd and Rh. Meanwhile, the SrCO3 nanoparticles improve the single cell performance, the peak power density increases from 1.08 to 1.25 W cm−2 at 750 °C. The reduced polarization resistance is associated with the charge transfer and oxygen incorporation processes. The synergistic catalytic activity should be attributed to the increased number of electrons from the adsorbed/dissociated oxygen species at the LSCF–SrCO3 interface, where the charge density distribution is affected by SrCO3. The results clearly demonstrate that SrCO3 has a positive effect on ORR and is thus a potential cost-effective alternative to enhance the catalytic activity of LSCF.Acknowledgements
We gratefully acknowledge the financial support of Anhui Estone Materials Technology Co., Ltd. (2016340022003195) and the National Nature Science Foundation of China (51372239).References
- R. M. Ormerod, Chem. Soc. Rev., 2003, 32, 17–28 RSC.
- B. C. H. Steele, J. Mater. Sci., 2001, 36, 1053–1068 CrossRef CAS.
- M. Y. Oh, A. Unemoto, K. Amezawa and T. Kawada, J. Electrochem. Soc., 2012, 159, F659–F664 CrossRef CAS.
- S. P. Simner, M. D. Anderson, M. H. Engelhard and J. W. Stevenson, Electrochem. Solid-State Lett., 2006, 9, A478–A481 CrossRef CAS.
- D. Oh, D. Gostovic and E. D. Wachsman, J. Mater. Res., 2012, 27, 1992–1999 CrossRef CAS.
- F. S. Baumann, J. R. Fleig, M. Konuma, U. Starke, H.-U. Habermeier and J. Maier, J. Electrochem. Soc., 2005, 152, A2074 CrossRef CAS.
- S. Y. Lai, D. Ding, M. Liu, M. Liu and F. M. Alamgir, ChemSusChem, 2014, 7, 3078–3087 CrossRef CAS PubMed.
- H. J. M. Bouwmeester, M. W. Otter and B. A. Boukamp, J. Solid State Electrochem., 2004, 8, 599–605 CrossRef CAS.
- Y. Wang, L. Zhang and C. R. Xia, Int. J. Hydrogen Energy, 2012, 37, 2182–2186 CrossRef CAS.
- Y. Wang, Y. Wang and C. Xia, J. Electrochem. Soc., 2012, 159, F570–F576 CrossRef CAS.
- M. Li, Y. Wang, Y. Wang, F. Chen and C. Xia, ACS Appl. Mater. Interfaces, 2014, 6, 11286–11294 Search PubMed.
- H. J. M. Bouwmeester, M. W. Otter and B. A. Boukamp, J. Solid State Electrochem., 2004, 8, 599–605 CrossRef CAS.
- B. Hu, Y. Wang and C. Xia, J. Electrochem. Soc., 2014, 162, F33–F39 CrossRef.
- J. A. Lane and S. J. Benson, Solid State Ionics, 1999, 121, 201–208 CrossRef CAS.
- E. Mutoro, E. J. Crumlin, M. D. Biegalski, H. M. Christen and Y. Shao-Horn, Energy Environ. Sci., 2011, 4, 3689 Search PubMed.
- Z. Liu, M. Liu, L. Yang and M. Liu, J. Energy Chem., 2013, 22, 555–559 CrossRef CAS.
- Y. Leng, S. Chan and Q. Liu, Int. J. Hydrogen Energy, 2008, 33, 3808–3817 CrossRef CAS.
- C. Fu, K. Sun, N. Zhang, X. Chen and D. Zhou, Electrochim. Acta, 2007, 52, 4589–4594 CrossRef CAS.
- M. Liu, D. Ding, K. Blinn, X. Li, L. Nie and M. Liu, Int. J. Hydrogen Energy, 2012, 37, 8613–8620 CrossRef CAS.
- S. P. Jiang, Int. J. Hydrogen Energy, 2012, 37, 449–470 CrossRef CAS.
- L. Nie, M. Liu, Y. Zhang and M. Liu, J. Power Sources, 2010, 195, 4704–4708 CrossRef CAS.
- X. Lou, S. Wang, Z. Liu, L. Yang and M. Liu, Solid State Ionics, 2009, 180, 1285–1289 CrossRef CAS.
- C. Xia, T. Hong and K. Brinkman, ChemElectroChem, 2016, 3, 805–813 CrossRef.
- J. M. Serra and H.-P. Buchkremer, J. Power Sources, 2007, 172, 768–774 CrossRef CAS.
- Y. Wang, L. Zhang, F. Chen and C. Xia, Int. J. Hydrogen Energy, 2012, 37, 8582–8591 CrossRef CAS.
- J. Hayd and E. Ivers-Tiffèe, J. Electrochem. Soc., 2013, 160, F1197–F1206 CrossRef CAS.
- Y. Zhang, Y. Chen and F. Chen, J. Power Sources, 2015, 277, 277–285 CrossRef CAS.
- Y. Zhang, Y. Chen, M. Yan and F. Chen, J. Power Sources, 2015, 283, 464–477 CrossRef CAS.
- H. Sumi, T. Yamaguchi, K. Hamamoto, T. Suzuki and Y. Fujishiro, J. Power Sources, 2013, 226, 354–358 CrossRef CAS.
- M. Li, Y. Ren, Z. Zhu, S. Zhu, F. Chen, Y. Zhang and C. Xia, Electrochim. Acta, 2016, 191, 651–660 CrossRef CAS.
- W. Yang, Z. Wang, Z. Wang, Z. Yang, C. Xia, R. Peng, X. Wu and Y. Lu, ACS Appl. Mater. Interfaces, 2014, 6, 21051–21059 Search PubMed.
Footnotes |
| † Electronic supplementary information (ESI) available. See DOI: 10.1039/c6cp06204k |
| ‡ The first author. |
| This journal is © the Owner Societies 2017 |

