Local environment inside a novel aromatic micelle investigated by steady-state and femtosecond fluorescence spectroscopy of an encapsulated solvatochromic probe†
Matthew M.
Sartin
a,
Kei
Kondo
b,
Michito
Yoshizawa
b,
Satoshi
Takeuchi
ac and
Tahei
Tahara
*ac
aMolecular Spectroscopy Laboratory, RIKEN, 2-1 Hirosawa, Wako, Saitama 351-0198, Japan. E-mail: tahei@riken.jp; Tel: +81-48-467-4592
bLaboratory for Chemistry and Life Science, Institute of Innovative Research, Tokyo Institute of Technology, 4259 Nagatsuta, Midori-ku, Yokohama 226-8503, Japan
cUltrafast Spectroscopy Research Team, RIKEN Center for Advanced Photonics (RAP), 2-1 Hirosawa, Wako, Saitama 351-0198, Japan
First published on 8th December 2016
Abstract
The local environment within a recently developed anthracene-shelled micelle (ASM), which is a micelle-like nanocapsule composed of anthracene-embedded amphiphiles, was investigated by steady-state and time-resolved spectroscopy of an encapsulated solvatochromic fluorescent probe molecule, coumarin 153 (C153). The absorption maximum of encapsulated C153 (452 nm) is more red-shifted than that of free C153 in water, indicating a highly polar environment inside the micelle. Despite this, the fluorescence Stokes shift of encapsulated C153 (∼3700 cm−1) is substantially smaller than that of free C153 in water. Femtosecond time-resolved broadband fluorescence measurements further showed that the dynamic Stokes shift is completed within 1 ps, revealing that the reorganization of the micelle interior following photoexcitation of the C153 probe is characterized by a sub-picosecond, limited-amplitude response. The femtosecond fluorescence anisotropy data showed that the orientational diffusion of the host–guest complex is slower (860 ps) than that of the empty micelle (510 ps), suggesting that the micelle structure is flexible enough to expand when the guest molecule is accommodated and that the micelle rotates with the encapsulated guest molecule. This softness of the micelles further allows some of them to simultaneously encapsulate two C153 molecules, as evidenced by the appearance of blue-shifted, H-dimer-like absorption and fluorescence bands. Based on these steady-state and femtosecond time-resolved spectroscopic data, we discuss the electronic state of C153 and micelle structure as well as the host–guest interaction in this novel flexible synthetic nanocapsule.
1. Introduction
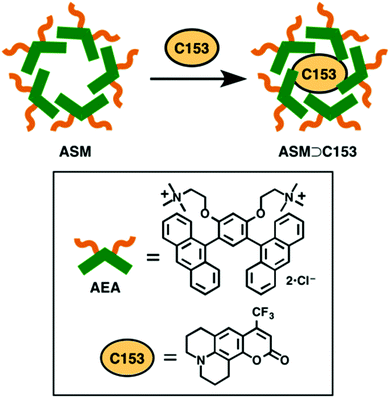
There has long been interest in molecular tubes and capsules, due to their potential value as nano-size containers and reactors. For such systems, the local environment within the host container is of fundamental and practical importance, since it can differ from that of the bulk medium. Such difference in the inner environment enables the host container to significantly influence the spectral properties1 and reaction dynamics2–4 of the guest molecules when they are encapsulated. For this reason, many studies have been devoted for understanding the local environment within various molecular containers, such as cyclodextrins,5,6 reverse micelles,7,8 cucurbiturils,9 synthetic nanocapsules,10 and supramolecular assemblies.11 In particular, the synthetic nanocapsules have received considerable attention3,12–17 because they provide unique local environments that can be designed and flexibly tuned by synthetic modifications. Spectroscopic studies of prototypical synthetic nanocapsules have revealed their static properties and the dynamics of host–guest interactions, which are indispensable for molecular-level understanding of the effect of encapsulation.10,18–21A recently-developed, new class of synthetic nanocapsule has been described as an aromatic micelle,22 because it is assembled from polyaromatic constituents, such as anthracene-embedded amphiphiles (AEA). As shown in Fig. 1, multiple (typically 4–6) AEA molecules self-assemble in water to form an anthracene-shelled micelle (ASM), with a hydrophobic interior and a hydrophilic exterior. This spontaneous enclosure creates a nano-sized space in which various hydrophobic molecules can be incorporated.23–25 The ASM nanocapsule is unique in that it has a flexible structure, due to the self-assembly of the AEA units, in contrast with other covalent and coordination nanocapsules. It is also noteworthy that the ASM nanocapsule is free from transition metal ions, which are often used as structural hinges in synthetic nanocapsules. These features make the ASM nanocapsule distinctly different from ordinary synthetic nanocapsules, and are expected to affect the electronic state, structure, and reactivity of the encapsulated guest molecules in a different way. The novelty of this aromatic enclosure and its ability to easily encapsulate a fluorescent probe molecule prompted us to examine the local environment within the ASM nanocapsule.
In this study, we encapsulate a prototypical fluorescent probe molecule, coumarin 153 (C153), into the ASM nanocapsule (ASM⊃C153), and investigate the inner environment through spectroscopic measurements on the C153 probe. Since C153 is a solvatochromic dye, the spectral shift of the absorption and fluorescence can be used to evaluate the local polarity experienced by the encapsulated guest molecules. In addition, time-resolved fluorescence measurements of ASM⊃C153 can reveal the excited-state dynamics and orientational motions of the encapsulated C153 probe. On the basis of the spectroscopic data obtained, we discuss the local environment inside ASM and the host–guest interaction in this new class of synthetic nanocapsule.
2. Experimental
Absorption spectra were collected on a uv-visible spectrophotometer (U3310, Hitachi). Fluorescence spectra were recorded using a commercial spectrofluorimeter (Fluorolog 3, Horiba Jobin Yvon). The spectral sensitivity of the spectrometer was corrected by measuring the emission of standard compounds, i.e., coumarin 110, C153, and DCM (4-(dicyanomethylene)-2-methyl-6-(4-dimethylaminostyryl)-4H-pyran). The fluorescence quantum yield of the ASM⊃C153 sample was measured with 435 nm excitation by using the fluorescence intensity of C153 in ethanol as a reference (ϕ = 0.55). All chemicals were purchased from Tokyo Chemical Industries, Wako Pure Chemical Industries, and Aldrich. AEA was synthesized as described previously.22The method for preparation of the host–guest complex was similar to the procedure used in the previous report.22 In brief, AEA (8.9 mg, 13 μmol) was dissolved in 5 mL water by stirring for 1 minute, resulting in self-assembly of AEA into the micelle (ASM). Then, hydrophobic C153 (3.0 mg, 9.7 μmol) was added to this micelle solution, and the mixture solution was stirred at 1400 rpm for 15 minutes to generate the host–guest complex, which we refer to as ASM⊃C153/15 min. We also prepared another solution of the host–guest complex, for which the same amounts of AEA and C153 were used but the mixture solution was stirred for 4 hours (ASM⊃C153/4 h), giving rise to a higher C153-to-ASM ratio than that of the host–guest complex prepared with the 15 min stirring. Finally, unencapsulated hydrophobic C153 was removed from the resultant aqueous solutions by centrifugation at 10![[thin space (1/6-em)]](https://www.rsc.org/images/entities/char_2009.gif) 000 rpm and subsequent filtration of the remaining solid from the supernatant.
000 rpm and subsequent filtration of the remaining solid from the supernatant.
Femtosecond time-resolved fluorescence data were measured using a broadband fluorescence up-conversion method.26 The light source used for this experiment was a Ti:sapphire regenerative amplifier system (800 nm, 80 fs, 8 mJ, 1 kHz; Legend Elite Duo-F, Coherent). A portion of the amplifier output (4 W) was used to pump an optical parametric amplifier (TOPAS-C, Light Conversion), and its idler output was frequency-quadrupled to generate the excitation pulse at 435 nm. The excitation pulse, after attenuation to 0.25 μJ, was focused onto a fused-silica flow cell (1 mm path length) in which the sample solution was circulated using a syringe pump. The emitted fluorescence was collimated and then refocused onto a Type-II BBO mixing crystal (200 μm thickness) using a pair of parabolic mirrors. A color filter was placed between the second parabolic mirror and the crystal to remove scattered excitation light. Another portion (1 W) of the amplifier output was attenuated and used as a gate pulse (25 μJ). The gate pulse was variably delayed by a mechanical stage and then focused onto the mixing crystal for the up-conversion process. The generated sum-frequency signal was separated from the other lights by an iris, a prism-based spectral filter, and a band-pass filter. Then, it was spectrally dispersed by a spectrograph (HR-320, Jobin Yvon) and detected by a liquid nitrogen-cooled CCD camera (PyLoN, Princeton Instruments). Continuous rotation of the mixing crystal during the accumulation time (5 minutes) allowed phase-matching for every wavelength component of the fluorescence and thus simultaneous collection of the entire time-resolved fluorescence spectrum at each delay time.26 The fluorescence was detected under the magic angle condition by rotating the excitation polarization with respect to the gate polarization (and the axis of the mixing crystal). The wavelength-dependent time-zero of the time-resolved fluorescence data was corrected by measuring the rapid onset of the fluorescence of β-carotene.27 The time-resolution of this up-conversion measurement was determined to be 250 fs from the up-converted Raman signal of the solvent.
Fluorescence dynamics in later time regions were measured using a streak camera (C4334, Hamamatsu). The light source of this measurement was a Ti:sapphire regenerative amplifier system (796 nm, 140 fs, 1 mJ, 1 kHz; Spitfire, Spectra-Physics), and the second harmonic of the amplifier output was used as the excitation pulse at 398 nm. In the experiments with excitation at 435 nm, the amplifier output was converted to 1740 nm by an optical parametric amplifier (TOPAS, Light Conversion), and the near infrared pulse was frequency-quadrupled. The excitation pulse was attenuated to 1 nJ in energy and passed through a polarizer before being focused on the sample cell (1 mm path length). The fluorescence from the sample was passed through an analyzing polarizer and focused onto the entrance slit of a spectrograph (C5094, Hamamatsu), where it was dispersed and detected using the streak camera. The time-resolution of this measurement was about 30 ps.
3. Results and discussion
3.1 Steady-state absorption and fluorescence of encapsulated C153
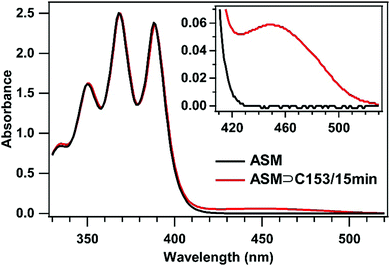
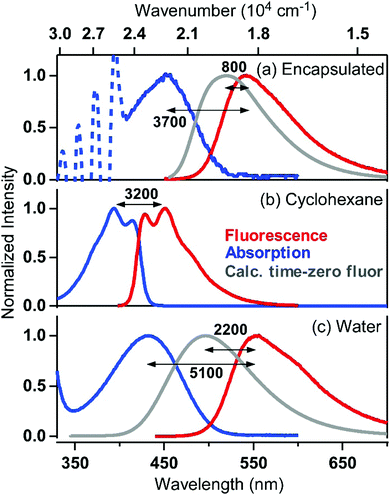
To examine the environment inside the ASM, we used C153 as a probe and carried out steady-state absorption and fluorescence spectroscopy for the ASM⊃C153/15 min sample. First, we compare the absorption spectra of the ASM and ASM⊃C153/15 min sample solutions prepared with the same AEA concentration (2.6 mM). As shown in Fig. 2, the absorption spectrum of ASM (black curve) exhibits a structured band in the 330–400 nm region with an onset at around 430 nm which is attributable to the anthracene moiety. The ASM⊃C153/15 min spectrum (red curve) exhibits an additional band on the red side of the ASM band. Since ASM itself does not show any absorption at wavelengths longer than 430 nm, the additional visible band observed for ASM⊃C153/15 min originates from C153. We note that free C153 dissolved in water does not contribute significantly to the spectrum shown in Fig. 2, because C153 is a relatively hydrophobic compound, and even a saturated aqueous solution of free C153 shows a peak absorbance that is only 4% of that of the visible band observed for ASM⊃C153/15 min. Therefore, the visible band of ASM⊃C153/15 min is almost solely attributable to C153 encapsulated in the ASM.28 The absorption spectrum of encapsulated C153 can be extracted by subtracting the ASM spectrum from the ASM⊃C153/15 min spectrum, as shown in Fig. 3a (blue curve). The structured features of the ASM and ASM⊃C153/15 min absorption look almost overlapping in Fig. 2, but they are not perfectly subtracted in Fig. 3a due to a slight spectral change upon encapsulation. This slight spectral change may indicate weak electronic coupling between the ASM and the C153 probe.In Fig. 3, the absorption spectrum of encapsulated C153 is compared with those of C153 dissolved in two solvents of different polarities: cyclohexane and water. The absorption spectrum of C153 in cyclohexane is centered at around 394 nm, whereas that of C153 in water exhibits a solvatochromic shift to 433 nm, due to the higher polarity of water. Since the interior of ASM consists of polyaromatic molecules, we expected that it provides a less polar environment than water for the guest molecule. Surprisingly, however, the absorption band of encapsulated C153 shows a maximum at 452 nm and is shifted more to the red compared with that of C153 in water. This indicates that the local polarity experienced by C153 in the ASM is greater than the polarity it experiences in water.
Steady-state fluorescence spectra of C153 in cyclohexane and in water, as well as that of encapsulated C153 in water, are also shown in Fig. 3 (red curves). The fluorescence Stokes shift observed in each medium varies, reflecting the difference in the reorganization energy of the medium in response to a sudden change in the dipole moment of C153 from 6.55 D29 to 14.2 D,30 following the S1 ← S0 photoexcitation. The Stokes shift is ∼3200 cm−1 in cyclohexane, due to negligible solvent reorganization in the nonpolar solvent, whereas in water, the high solvent polarity allows greater stabilization of the excited state dipole, resulting in a Stokes shift as large as ∼5100 cm−1. It was found that the Stokes shift observed for ASM⊃C153/15 min is ∼3700 cm−1, which is larger than that observed in cyclohexane, suggesting that the ASM interior responds and stabilizes the photoexcited C153 probe to a certain extent. The stabilization energy by the ASM interior can be quantified by comparing the fluorescence spectrum of ASM⊃C153/15 min and the “time-zero” spectrum expected immediately after photoexcitation (grey curve, Fig. 3a), which was calculated using Maroncelli's method.31 The energy spacing between the two spectra (∼800 cm−1) gives a measure of how much the excited-state guest is stabilized by reorganization of the ASM interior, which corresponds to the dynamic Stokes shift. The Stokes shift and dynamic Stokes shift observed for ASM⊃C153/15 min are significantly smaller than the corresponding shifts in water (5100 cm−1 and 2200 cm−1, Fig. 3c), although the absorption spectrum of encapsulated C153 indicates that the local polarity inside the ASM is larger than in water. Thus, the reorganization energy of the ASM interior surrounding the C153 probe is smaller than would be expected for solvents of the same polarity. The limited magnitude of the reorganization and the high polarity are the characteristic features of the inner environment formed by self-assembly of AEAs. This feature is distinctly different from that given by ordinary solvent molecules.
We note that π-stacking effect between the polyaromatic micelle and encapsulated C153 is one of the possible interactions that might contribute to the spectral red-shift in absorption and fluorescence to some extent. However, the rather flexible nature of the ASM cavity due to self-assembly of the AEAs, and the small aromatic surfaces of C153, are not expected to allow efficient formation of a rigid π-stacked complex. In fact, the encapsulation ratio for ASM⊃C153 is estimated to be relatively low (ca. 6%28). Therefore, we consider that the encapsulation of C153 in the ASM cavity is mainly driven by the hydrophobic interaction between the ASM interior and C153 rather than the π-stacking effect.
3.2 Time-resolved fluorescence of ASM⊃C153/15 min
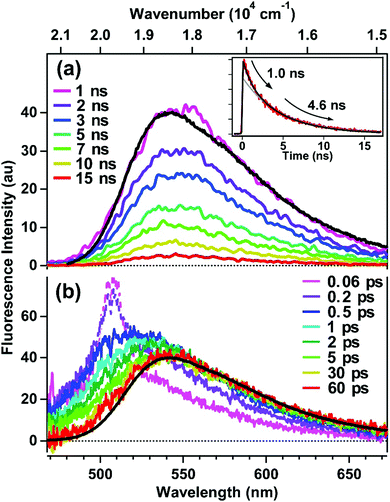
Time-resolved fluorescence of encapsulated C153 was measured to investigate the reorganization dynamics of the ASM interior upon photoexcitation of the guest molecules. Fig. 4a shows picosecond time-resolved fluorescence spectra of ASM⊃C153/15 min, which were measured by a streak camera with selective excitation of encapsulated C153 at 435 nm. On the nanosecond time-scale, time-resolved fluorescence spectra are almost identical to the steady-state spectrum (black curve), indicating that the reorganization dynamics is already completed. As shown in the inset, the decay of the fluorescence intensity deviates from single exponential behavior, and it can be well fit by a bi-exponential function with time constants and relative amplitudes of 1.0 ns (30%) and 4.6 ns (70%). The longer lifetime (4.6 ns) is similar to the fluorescence lifetime observed in solution.32 Since C153 usually shows a single-exponential fluorescence decay in solution, the presence of the faster decay component (1.0 ns) for ASM⊃C153/15 min is a result of encapsulation. As depicted in Fig. 1, the ASM is composed of several AEAs that self-assemble in water, so that, although the micelle consists of rigid, polyaromatic components, the nano-space inside is highly likely flexible. Thus, we consider that the ASM host with certain conformations may affect the electronic and/or structural properties of the C153 guest, which facilitates the nonradiative quenching of the excited state and gives rise to the shorter fluorescence lifetime. We note that the two decay components obtained from the fitting do not necessarily imply that the ASM only has two distinct conformations. Rather, we think that many possible conformations give rise to a range of fluorescence lifetimes shorter than the intrinsic lifetime, and that the mean value of this lifetime distribution is observed as the 1.0 ns component.Since reorganization time-scales are typically much shorter than those accessible by the streak camera, we examined the fluorescence dynamic Stokes shift associated with micelle reorganization using the broadband up-conversion method with 250 fs time resolution. Fig. 4b shows the femtosecond time-resolved fluorescence spectra of ASM⊃C153/15 min measured with excitation at 435 nm, along with the corresponding steady-state fluorescence spectrum. Immediately after photoexcitation (0.06 ps), the time-resolved fluorescence spectrum shows a maximum in the 500–520 nm region (although the peak region is disturbed by Raman scattering of the solvent), and it nearly coincides with the calculated “time-zero” spectrum (grey curve in Fig. 3a). Then, the transient spectrum rapidly red-shifts until ∼1 ps, corresponding to the dynamic Stokes shift (∼800 cm−1). The femtosecond fluorescence data show that the red side of the transient spectrum almost overlaps with the steady-state spectrum after 1 ps, indicating that the reorganization of the ASM interior is complete by this time. In other words, for ASM⊃C153/15 min, there are no clearly discernible reorganization dynamics slower than a picosecond. Thus, the response of the ASM interior is characterized by sub-picosecond, limited-amplitude motions that stabilize the excited state of the C153 guest. It should be mentioned that the fluorescence decay observed on the blue side of the spectra contains a contribution from doubly-occupied micelles, which will be discussed later.
3.3 Time-resolved fluorescence anisotropy measurements for ASM and encapsulated C153
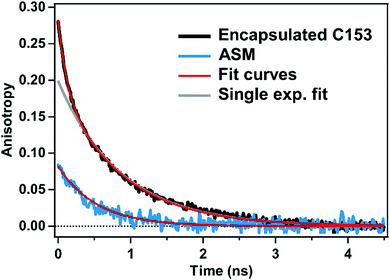
To characterize the rotational motions of the ASM and encapsulated C153, we carried out time-resolved fluorescence anisotropy measurements for ASM⊃C153/15 min, and compared the orientational diffusion times of the ASM and C153 probe. In this experiment, the time-resolved fluorescence was measured under the parallel and perpendicular polarization conditions. Then, time-resolved fluorescence was spectrally integrated in the 600–700 nm region, and the obtained intensities for the two polarization conditions were used to evaluate the anisotropy value at each delay.The fluorescence anisotropy decay of the empty ASM measured with 400 nm excitation is shown with the blue curve in Fig. 5. The observed anisotropy decay is well reproduced by a single exponential function with an initial amplitude of 0.08 and a decay time constant of 510 ps. This time constant (510 ps) is ascribed to the tumbling of the ASM in water. The initial amplitude (0.08) is much lower than the theoretical value of 0.4 expected for the case where the absorption and emission transition dipole moments are parallel with each other. This low initial anisotropy is attributable to the efficient energy migration among the π-stacked anthracene moieties of ASM, resulting in rapid depolarization within the time resolution of this measurement (30 ps).
Excitation of the ASM moiety of ASM⊃C153/15 min at 400 nm results in rapid energy transfer from ASM to the encapsulated C153, which hampers measurement of the orientational diffusion time of the ASM itself. Therefore, we measured the fluorescence anisotropy decay of encapsulated C153 instead, to obtain information about the rotation of ASM⊃C153/15 min. The fluorescence anisotropy of C153 in ASM⊃C153/15 min was measured with selective excitation of encapsulated C153 at 435 nm. Since the excitation energy of the ASM moiety is larger than that of C153, the excitation of C153 is not efficiently transferred to ASM, which enables us to measure the intrinsic orientational diffusion time of encapsulated C153. The time-resolved fluorescence signal in the 600–700 nm region was spectrally integrated to evaluate the anisotropy value. As shown in Fig. 5 (black curve), the observed anisotropy decay cannot be fit by a single exponential function but can be well-reproduced by a bi-exponential function with time constants of 110 ps and 860 ps. The existence of the two components suggests that the orientational diffusion of encapsulated C153 can be described as a sum of two motions. Since the larger time constant (860 ps) is similar to the time constant of the empty ASM (510 ps), it is attributable to the motion of C153 rotating together with the ASM. The smaller time constant (110 ps) is assignable to the faster motion of C153 in the nano-cavity of the ASM. This motion can be called a restricted motion of the C153 within the ASM, which is reminiscent of the segmental motion of a fluorophore bound to a biopolymer.33 Consequently, the 860 ps component corresponds to the orientational diffusion of the ASM⊃C153 complex as a whole, while the 110 ps component is associated with the restricted motion of the C153 guest, perturbed by that of the ASM.
It should be noted that the orientational diffusion of ASM⊃C153 (860 ps) is significantly slower than that observed for the empty ASM (510 ps). This difference in the orientational diffusion time can be rationalized by considering that ASM⊃C153 is larger than ASM, i.e. spatial expansion of the micelle upon encapsulation. The size of the micelle can be estimated from the orientational diffusion time using the Stokes–Einstein equation, which yields a diameter of 1.6 nm for the empty ASM and 1.9 nm for ASM⊃C153. The estimated diameter of the empty ASM (1.6 nm) is in fair agreement with the value (2.3 ± 1.0 nm) obtained by atomic force microscopy and also with the average diameter (∼2 nm) of the ASM structure (four AEA molecules) predicted by molecular modeling.22 The increase in the micelle size from 1.6 nm to 1.9 nm upon encapsulation is a distinct feature of the ASM, which provides a flexible enclosure that can be fit to and optimized for each guest molecule. Although the multiple fluorescence lifetimes observed for encapsulated C153 (Fig. 4a, inset) suggest a conformational distribution of ASM⊃C153, it can be considered that every micelle has a similar size, based on the observation of a single time constant for the orientational motion as a whole (860 ps). Interestingly, the initial anisotropy value observed for ASM⊃C153 (0.28) is also smaller than the theoretical value of 0.4, implying that ultrafast depolarization occurs for excited-state C153 in ASM⊃C153 following the 435 nm excitation. The reason for this observation is not clear at present, but it may be caused by weak coupling between the electronic states of encapsulated C153 and ASM, which leads to partial delocalization of the C153 excitation over the micelle. It is consistent with the small change of the absorption band of ASM recognized with encapsulation of C153 (Fig. 3a).
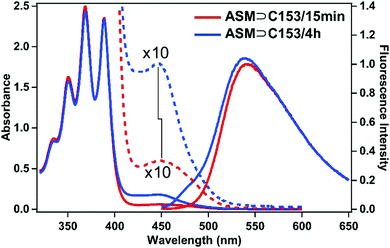
3.4 Spectroscopic properties and dynamics of the doubly-occupied micelle
As described in the previous section, the time-resolved anisotropy measurements suggest that ASM adjusts its size depending on the guest. This also implies that ASM may be able to encapsulate more than one guest molecule. As described in the experimental section, we also prepared a sample solution with a longer stirring time of 4 h (ASM⊃C153/4 h), which increases the chance of encapsulating more C153 molecules into each ASM. The absorption spectrum of ASM⊃C153/4 h is shown in Fig. 6 (blue) and is compared with that of ASM⊃C153/15 min (red). For ASM⊃C153/4 h, the C153-to-ASM absorbance ratio is larger than for ASM⊃C153/15 min, and the absorption peak appears at a shorter wavelength. This spectral difference suggests that some ASM can encapsulate two C153 probes simultaneously, and that the relative amount of the doubly-occupied ASM becomes larger with increasing stirring time. The observed increase in the absorption intensity of the C153 band and the spectral blue shift can be explained by considering the formation of an H-type dimer of C15334–37 inside the doubly-occupied ASM. In the H-type dimer, the excitonic coupling between the electronic states of the two monomers splits the S1 state into two, and generates a higher-energy, optically-allowed transition with a low-energy, optically-forbidden transition, which leads to a blue shift of the absorption band compared with the monomer absorption. Since merely increasing the number of singly-occupied ASM does not induce any blue shift, double-occupation and formation of the H-type dimer best rationalize our observation.We quantitatively evaluate the relative contributions of the singly- and doubly-occupied ASM to the absorption spectrum using fluorescence and fluorescence excitation spectra. Fig. 6 depicts the fluorescence spectra of ASM⊃C153/15 min and ASM⊃C153/4 h obtained with excitation of the C153 guest at 435 nm. The two fluorescence spectra overlap perfectly on the long wavelength side when normalized, indicating that the long-wavelength part of both spectra is dominated by the singly-occupied ASM. In contrast, a clear spectral difference is seen on the short wavelength side, particularly a shoulder at around 485 nm for ASM⊃C153/4 h. This suggests that the doubly-occupied ASM contributes to the blue side of the fluorescence spectrum. More specifically, we can consider that the fluorescence at around 485 nm mainly arises from the doubly-occupied ASM while the fluorescence at around 600 nm almost solely originates from the singly-occupied ASM.
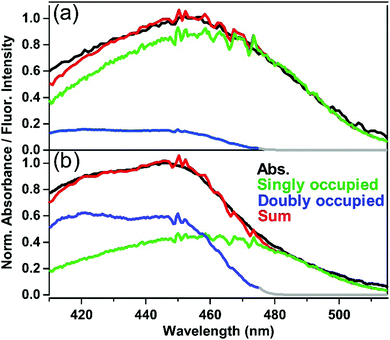
Based on the above argument about fluorescence spectra, the contribution of the singly-occupied and doubly-occupied ASMs to the absorption was evaluated by utilizing a fluorescence excitation spectrum, and the results for ASM⊃C153/15 min and ASM⊃C153/4 h are shown in Fig. 7(a) and (b), respectively. The green curve in Fig. 7(a) depicts the fluorescence excitation spectrum of ASM⊃C153/15 min obtained with monitoring the fluorescence at 600 nm. Since the contribution from doubly-occupied ASM is negligible at around 600 nm, this fluorescence excitation spectrum can be considered to represent the absorption spectrum of singly-occupied ASM. On the other hand, the blue curve in Fig. 7(b) depicts the excitation spectrum of ASM⊃C153/4 h that was obtained with monitoring 485 nm fluorescence. Since the fluorescence in the 485 nm region is almost solely due to doubly-occupied ASM, it is considered that this excitation spectrum represents the absorption spectrum of the doubly-occupied ASM. Using the “absorption spectra” of the singly- and doubly-occupied ASM obtained as fluorescence excitation spectra, we decomposed the absorption spectra of ASM⊃C153/15 min and ASM⊃C153/4 h into the two components. In this procedure, first, the spectrum of the singly-occupied ASM was scaled to match the absorption spectrum on the long wavelength side. Then, the spectrum of the doubly-occupied ASM was scaled so that the sum of the spectra of singly-occupied and doubly-occupied ASM matches the absorption spectrum. As shown in Fig. 7(a) and (b), the sum of the two components (red curve) successfully reproduces the absorption spectra of ASM⊃C153/15 min and ASM⊃C153/4 h. Based on this spectral decomposition, we estimate that the singly- and doubly-occupied ASM are excited with a population ratio of 80![[thin space (1/6-em)]](https://www.rsc.org/images/entities/char_2009.gif) :
:![[thin space (1/6-em)]](https://www.rsc.org/images/entities/char_2009.gif) 20 when ASM⊃C153/15 min is photoexcited at 435 nm, while this ratio becomes 40
20 when ASM⊃C153/15 min is photoexcited at 435 nm, while this ratio becomes 40![[thin space (1/6-em)]](https://www.rsc.org/images/entities/char_2009.gif) :
:![[thin space (1/6-em)]](https://www.rsc.org/images/entities/char_2009.gif) 60 for photoexcitation of ASM⊃C153/4 h.
60 for photoexcitation of ASM⊃C153/4 h.
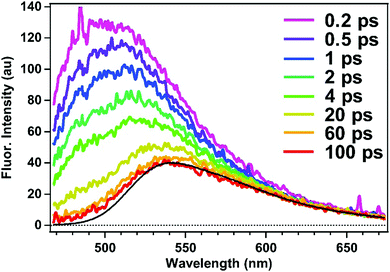
The excited-state dynamics of the doubly-occupied ASM can be examined by time-resolved fluorescence measurements of ASM⊃C153/4 h with excitation at 435 nm. As shown in Fig. 8, the obtained time-resolved spectrum exhibits a fluorescence band at 500 nm immediately after photoexcitation, and the 500 nm band decays within 100 ps, leaving a weaker band at 540 nm. The spectral shape and dynamics of the fluorescence observed after 100 ps are essentially the same as those depicted in Fig. 4a, so that the fluorescence signal observed at later times is attributable to the singly-occupied ASM that is contained in the ASM⊃C153/4 h sample.
The 500 nm band can be extracted by subtracting the spectrum at 100 ps from each time-resolved spectrum at earlier decays. These difference spectra exhibit the same shape at each delay (ESI,† Fig. S1), suggesting that the 500 nm band originates from one species. Moreover, when we compare the time-resolved fluorescence spectra of ASM⊃C153/15 min (Fig. 4b) and ASM⊃C153/4 h (Fig. 8), the amplitude of the 500 nm band becomes much larger as the initial population ratio of the photoexcited doubly-occupied ASM increases from 20% in ASM⊃C153/15 min to 60% in ASM⊃C153/4 h (vide supra). Therefore, we can safely attribute the short-lived 500 nm band to the doubly-occupied ASM. The short-lived fluorescence from the doubly-occupied ASM corresponds to the short-wavelength shoulder of the steady-state fluorescence spectrum of ASM⊃C153/4 h (Fig. 6).
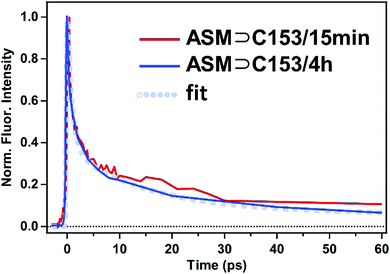
The fluorescence lifetime of the doubly-occupied ASM was obtained by integrating the time-resolved spectra in Fig. 8 from 470 nm to 500 nm, where the doubly-occupied ASM predominantly contributes to the signal. As shown in Fig. 9 (blue curve), the temporal profile consists of a 0.9 ps (64%) component and a 14 ps (30%) component, followed by a long-lived (6%) component. The long-lived component is attributed to fluorescence from the singly-occupied ASM based on its spectral shape. Since the spectral shapes corresponding to the 0.9 ps and 14 ps components are the same, both of the picosecond components are attributed to fluorescence from the doubly-occupied ASM. As shown in Fig. 9 (red curve), similar temporal behavior is obtained when we integrate the time-resolved fluorescence signal of ASM⊃C153/15 min (Fig. 4b) in the 470–500 nm region, indicating that the short-lived, short-wavelength component of the ASM⊃C153/15 min sample also originates from the doubly-occupied ASM. Given the apparent flexibility of the micelle structure, the doubly-occupied ASM likely exists in a variety of conformations/environments, which likely gives rise to the multiple lifetimes. The short-lived, short-wavelength fluorescence of the C153 guest in the doubly-occupied ASM is consistent with the formation of an H-type dimer inside the micelle, because the S1–S0 transition of C153 is split into the low-energy optically forbidden transition and the high-energy optically allowed transition. In fact, photoexcitation to the high-energy allowed state is expected to be followed by a rapid internal conversion to the low-energy dark state, which leads to the fast fluorescence quenching, as observed especially for ASM⊃C153/4 h. Finally, we note that our picture is further supported by fluorescence quantum yields of the two ASM⊃C153 samples. Our measurements showed that the fluorescence quantum yields of ASM⊃C153/15 min and ASM⊃C153/4 h obtained with 435 nm excitation are 0.19 and 0.08, respectively, and this difference in the fluorescence quantum yield is in accordance with the change in the initial population ratio of the photoexcited singly-occupied ASM from 80% in ASM⊃C153/15 min to 40% in ASM⊃C153/4 h. This consistency indicates that the steady-state fluorescence intensity is dominated by the singly-occupied ASM, and it strengthens our argument that the doubly-occupied ASM exhibits short-lived fluorescence, contributing little to the steady-state fluorescence intensity.
4. Conclusion
The inner local environment of a novel aromatic micelle, which is formed by self-assembly of several anthracene embedded amphiphiles (AEAs) in water, was examined by steady-state absorption, and steady-state and femto/picosecond time-resolved fluorescence spectroscopy on an encapsulated solvatochromic probe molecule, coumarin 153 (C153). This anthracene shelled micelle (ASM) predominantly contains a single C153 probe when it is prepared by stirring the AEA aqueous solution with C153 for a short period of time (15 min). The absorption spectrum of the encapsulated C153 exhibits a larger solvatochromic shift than that in water, indicating a highly polar environment inside the ASM nanocapsule although the C153 probe is surrounded by hydrophobic anthracene moieties. The fluorescence Stokes shift of the encapsulated C153 is smaller than that in water, and the time-resolved measurements for the dynamic Stokes shift revealed that the photoinduced dipole in C153 is stabilized by a sub-picosecond, limited-amplitude response of the micelle interior. It was found that the ASM nanocapsule is intrinsically flexible enough to allow spatial expansion to accommodate the guest molecule, as evidenced by the increase in the orientational diffusion time upon encapsulation. This unique capability of the aromatic micelle further allows simultaneous encapsulation of two C153 probes, particularly when it is prepared with a longer stirring time (4 h). The doubly-occupied micelle shows blue shifted absorption and fluorescence spectra compared to the singly-occupied micelle, suggesting the formation of an H-type dimer of C153 inside the ASM nanocapsule. The C153 fluorescence lifetime of the doubly-occupied micelle in the picosecond range as well as that of the singly-occupied micelle in the nanosecond range shows multiple components, reflecting a conformational distribution of the host–guest complex. These steady-state and time-resolved data characterize the softness and dynamic encapsulation of this new type of synthetic nanocapsules.Acknowledgements
M. M. S. thanks the RIKEN FPR fellowship for their support of this research and K. K. thanks the JSPS for a Research Fellowship for Young Scientists. This work was partly supported by JSPS KAKENHI Grant Numbers JP16H04102 to S. T., JP25104011 to M. Y. and JP25104005 to T. T.References
- R. N. Dsouza, U. Pischel and W. M. Nau, Chem. Rev., 2011, 111, 7941 CrossRef CAS PubMed.
- T. Dwars, E. Paetzold and G. Oehme, Angew. Chem., Int. Ed., 2005, 44, 7174 CrossRef CAS PubMed.
- D. M. Vriezema, M. Comellas Aragonès, J. A. A. W. Elemans, J. J. L. M. Cornelissen, A. E. Rowan and R. J. M. Nolte, Chem. Rev., 2005, 105, 1445 CrossRef CAS PubMed.
- M. Yoshizawa, J. K. Klosterman and M. Fujita, Angew. Chem., Int. Ed., 2009, 48, 3418 CrossRef CAS.
- S. Vajda, R. Jimenez, S. J. Rosenthal, V. Fidler, G. R. Fleming and E. W. Castner, Chem. Soc., Faraday Trans., 1995, 91, 867 RSC.
- A. Douhal, Chem. Rev., 2004, 104, 1955 CrossRef CAS PubMed.
- N. E. Levinger and L. A. Swafford, Annu. Rev. Phys. Chem., 2009, 60, 385 CrossRef CAS PubMed.
- J. P. Wang, J. S. Chen and G. J. Zhao, J. Colloid Interface Sci., 2014, 423, 1 CrossRef CAS PubMed.
- M. Gupta, D. K. Maity, M. K. Singh, S. K. Nayak and A. K. Ray, J. Phys. Chem. B, 2012, 116, 5551 CrossRef CAS PubMed.
- M. Porel, C.-H. Chuang, C. Burda and V. Ramamurthy, J. Am. Chem. Soc., 2012, 134, 14718 CrossRef CAS PubMed.
- J. P. Wang, Y. Pan, P. Li and G. J. Zhao, J. Alloys Compd., 2016, 686, 656 CrossRef CAS.
- L. R. MacGillivray and J. L. Atwood, Nature, 1997, 389, 469 CrossRef CAS.
- C. L. D. Gibb and B. C. Gibb, J. Am. Chem. Soc., 2004, 126, 11408 CrossRef CAS PubMed.
- T. Omagari, A. Suzuki, M. Akita and M. Yoshizawa, J. Am. Chem. Soc., 2016, 138, 499 CrossRef CAS PubMed.
- M. Yoshizawa, M. Tamura and M. Fujita, Science, 2006, 312, 251 CrossRef CAS PubMed.
- J. Kang and J. Rebek, Nature, 1997, 385, 50 CrossRef CAS PubMed.
- P. Mal, B. Breiner, K. Rissanen and J. R. Nitschke, Science, 2009, 324, 1697 CrossRef CAS PubMed.
- M. Sliwa, P. Naumov, H.-J. Choi, Q.-T. Nguyen, B. Debus, S. Delbaere and C. Ruckebusch, ChemPhysChem, 2011, 12, 1669 CrossRef CAS PubMed.
- J. K. Klosterman, M. Iwamura, T. Tahara and M. Fujita, J. Am. Chem. Soc., 2009, 131, 9478 CrossRef CAS PubMed.
- H. Hosoi, S. Yamaguchi and T. Tahara, Chem. Lett., 2005, 34, 618 CrossRef CAS.
- M. Yamashina, M. M. Sartin, Y. Sei, M. Akita, S. Takeuchi, T. Tahara and M. Yoshizawa, J. Am. Chem. Soc., 2015, 137, 9266 CrossRef CAS PubMed.
- K. Kondo, A. Suzuki, M. Akita and M. Yoshizawa, Angew. Chem., Int. Ed., 2013, 52, 2308 CrossRef CAS PubMed.
- Y. Okazawa, K. Kondo, M. Akita and M. Yoshizawa, J. Am. Chem. Soc., 2015, 137, 98 CrossRef CAS PubMed.
- K. Kondo, M. Akita and M. Yoshizawa, Chem. – Eur. J., 2016, 22, 1937 CrossRef CAS PubMed.
- K. Kondo, M. Akita, T. Nakagawa, Y. Matsuo and M. Yoshizawa, Chem. – Eur. J., 2015, 21, 12741 CrossRef CAS PubMed.
- A. Cannizzo, O. Bräm, G. Zgrablic, A. Tortschanoff, A. A. Oskouei, F. van Mourik and M. Chergui, Opt. Lett., 2007, 32, 3555 CrossRef CAS PubMed.
- B. Schmidt, S. Laimgruber, W. Zinth and P. Gilch, Appl. Phys. B: Lasers Opt., 2003, 76, 809 CrossRef CAS.
- Assuming that the extinction coefficient of C153 in ASM is close to the value in methanol (17
![[thin space (1/6-em)]](https://www.rsc.org/images/entities/char_2009.gif) 900 M−1 cm−1), the concentration of encapsulated C153 in the sample solution is 0.033 mM. If every ASM capsule consists of 5 AEA molecules, we estimate that about 6% of all ASM are occupied by C153.
900 M−1 cm−1), the concentration of encapsulated C153 in the sample solution is 0.033 mM. If every ASM capsule consists of 5 AEA molecules, we estimate that about 6% of all ASM are occupied by C153. - C. R. Moylan, J. Phys. Chem., 1994, 98, 13513 CrossRef CAS.
- W. Baumann and Z. Nagy, Pure Appl. Chem., 1993, 65, 1729 CrossRef.
- M. L. Horng, J. A. Gardecki, A. Papazyan and M. Maroncelli, J. Phys. Chem., 1995, 99, 17311 CrossRef CAS.
- G. Jones, W. R. Jackson, C. Y. Choi and W. R. Bergmark, J. Phys. Chem., 1985, 89, 294 CrossRef CAS.
- J. R. Lakowicz, Principles of Fluorescence Spectroscopy, Springer, New York, 3rd edn, 2006 Search PubMed.
- P. Verma and H. Pal, J. Phys. Chem. A, 2014, 118, 6950 CrossRef CAS PubMed.
- P. Verma and H. Pal, J. Phys. Chem. A, 2012, 116, 4473 CrossRef CAS PubMed.
- P. Verma and H. Pal, J. Phys. Chem. A, 2013, 117, 12409 CrossRef CAS PubMed.
- M. Cigáň, J. Donovalová, V. Szöcs, J. Gašpar, K. Jakusová and A. Gáplovský, J. Phys. Chem. A, 2013, 117, 4870 CrossRef.
Footnote |
| † Electronic supplementary information (ESI) available. See DOI: 10.1039/c6cp06174e |
| This journal is © the Owner Societies 2017 |

