
Hydrogen-bond dynamics at the bio–water interface in hydrated proteins: a molecular-dynamics study†
Prithwish K.
Nandi
a,
Niall J.
English
a,
Zdenek
Futera
a and
Antonio
Benedetto
*bc
aSchool of Chemical and Bioprocess Engineering, University College Dublin, Belfield, Dublin 4, Ireland. E-mail: prithwish.nandi@ucd.ie; niall.english@ucd.ie
bSchool of Physics, University College Dublin, Belfield, Dublin 4, Ireland. E-mail: antonio.benedetto@ucd.ie
cNeutron-Scattering and Imaging Laboratory, Paul Scherrer Institute, Villigen, Switzerland
First published on 1st December 2016
Abstract
Water is fundamental to the biochemistry of enzymes. It is well known that without a minimum amount of water, enzymes are not biologically active. Bare minimal solvation for biological function corresponds to about a single layer of water covering enzymes' surfaces. Many contradictory studies on protein–hydration-water-coupled dynamics have been published in recent decades. Following prevailing wisdom, a dynamical crossover in hydration water (at around 220 K for hydrated lysozymes) can trigger larger-amplitude motions of the protein, activating, in turn, biological functions. Here, we present a molecular-dynamics-simulation study on a solvated model protein (hen egg-white lysozyme), in which we determine, inter alia, the relaxation dynamics of the hydrogen-bond network between the protein and its hydration water molecules on a residue-per-residue basis. Hydrogen-bond breakage/formation kinetics is rather heterogeneous in temperature dependence (due to the heterogeneity of the free-energy surface), and is driven by the magnitude of thermal motions of various different protein residues which provide enough thermal energy to overcome energy barriers to rupture their respective hydrogen bonds with water. In particular, arginine residues exhibit the highest number of such hydrogen bonds at low temperatures, losing almost completely such bonding above 230 K. This suggests that hydration water's dynamical crossover, observed experimentally for hydrated lysozymes at ∼220 K, lies not at the origin of the protein residues' larger-amplitude motions, but rather arises as a consequence thereof. This highlights the need for new experimental investigations, and new interpretations to link protein dynamics to functions, in the context of key interrelationships with the solvation layer.
Introduction
In hydrated proteins, water molecules directly in contact with, or close to, the protein surface have properties quite different than in a bulk-water environment. These water molecules, for example, are not able to crystallize and form ice, and usually are still in the liquid state below the melting point of water, moving then in a sort of glassy amorphous state. Usually in the literature we call these water molecules protein “hydration water”. The role of hydration water in proteins is of enormous importance since it induces a full panoply of biological activities in proteins,1 otherwise absent in its completely anhydrous variant. The temperature range at which such biochemical activities are observed2–6 overlaps with the temperature at which dynamical crossovers are seen in both proteins7 and their hydration-water layers,8 thus establishing a possible correlation between these observed dynamical crossovers and biological activities. Indeed, in ref. 7, for instance, the atomic mean square displacement of a model protein (myoglobin) hydrated in water exhibits a sudden increase at around TPDT = 220 K, which is absent when dehydrated. This sudden increase of the atomic displacements has been generalised as a universal behaviour, having been reported for several hydrated proteins8–10 and also in different solvation environments like water solutions of disaccharides;11 it is known as “protein dynamical transition” (PDT), and is considered the microscopic signature of biological activity of enzymes. On the other hand, in ref. 8, it was found that the relaxation time of the hydration-shell water itself also has a dynamical crossover at around the same temperature of the PDT. More specifically, the authors have shown that by increasing the temperature the relaxation time of the water hydrating the model protein lysozyme changes from an Arrhenius to a super-Arrhenius behaviour at TFSC = 220 K; due to this kind of change in the behaviour of the relaxation time, they call this “fragile-to-strong dynamical crossover” (FSC), in analogy with the terminology used to define strong and fragile molecular glasses.12 Naturally, this has led to extensive debates over the precise role of hydration water in driving, or at least influencing, such PDT.8,9,13 Extensive experimental as well as computational studies abound in the literature over recent decades, seeking to elucidate how the hydration layer may induce the onset of dynamic transitions in proteins.14–27 This topic is debated rather hotly, and even the existence of the PDT and the dynamical crossover of its hydration water has been questioned.28–33 The by-and-large accepted scenario13 posits that the transition in the dynamics of the hydration-water layer(s) triggers the protein dynamics, and thus its function.Water molecules present in the hydration layer can be considered to be spatially confined and are subject to the direct influence of the protein.34–36 In addition to being involved in water–water hydrogen bonding, these water molecules also take part in building a hydrogen-bond network with the protein, and thus their movement in the hydration layer is expected to be significantly different from that of the bulk water. It is quite well established that the structure and dynamics of water molecules present in the hydration layer are heterogeneous in nature, since water behaves in a very much different way near the hydrophobic and hydrophilic pockets and clefts of a protein's surface.34–36 Owing to the thinness of the hydration layer around protein, and due to heterogeneous water molecular properties in this shell, it is quite challenging to probe their structure and dynamics experimentally. Computer-simulation studies featuring atomistic details often serve as a potential alternative to study the structure, dynamics and existing interactions between protein and its hydration-layer water. By measuring the survival correlation time34,35 and orientational time correlation function,37 it has been shown that water molecules in the hydration layer are almost 2–7 times slower vis-à-vis bulk water. The translational motion of the hydration water is also shown to be sub-diffusive.38 Moreover, in ref. 36, the authors adapt their analytic jump reorientation model of water39,40 to describe the behaviour of hydration water in lysozymes under ambient conditions; they describe the effect of the protein on the dynamics of water by considering two main effects: a topological effect and a chemistry-mediated effect. In the latter case as in all the cases mentioned above, one can argue that such characteristically different dynamical properties observed in the hydration water might result from the existing protein–water hydrogen bond network, and, in turn, can be probed “indirectly” by studying the behaviour of the hydrogen bond network at the protein–water interface. Motivated by this open question, in the present study, we have quantified and characterised this protein–water hydrogen bond network for wildtype hen egg-white lysozymes using classical molecular-dynamics (MD) simulations. The temperature dependence of such a hydrogen-bond network has also been scrutinised to establish the possible influence of this hydrogen-bond network on the protein dynamical transition and on the dynamical crossover of its hydration water and, in turn, its potential implication in protein function. The computed MD trajectories allow us to study the hydrogen-bond relaxation dynamics of each protein residue and its associated hydration water molecule(s). As a result, a clear picture of heterogeneous behaviour of kinetics, featuring three existential categories of temperature dependence (faster with, slower with and independent of increasing temperature), emerges. This heterogeneous scenario is clearly due to the heterogeneity of the protein surface itself (composed of different residues), in contrast to the more homogeneous nature of the solvent, i.e., water molecules, suggesting the idea that the hydrogen-bond dynamics between the protein and the hydration water is governed by the protein. Whereas breaking and/or formation of one of these hydrogen bonds can only locally affect the protein dynamics, with almost negligible effects on its global relaxation; it can drastically affect the dynamics of the hydrogen-bonded water molecule that, for example, after the breaking of the hydrogen bond, will be less confined and can perhaps diffuse (by roto-translational motion) far from the original binding site.
Methodology
All MD simulations were performed using the GROMACS41 MD-simulation package with the OPLS42,43 and SPC/E44 potential models for HEWL and water, respectively. HEWL is a small globular protein with a molecular mass of 14![[thin space (1/6-em)]](https://www.rsc.org/images/entities/char_2009.gif) 320 Da and triclinic wild-type, namely the 2LZT crystal structure.45 Formal charges were chosen appropriate to pH 7, resulting in a total charge of +8e for this protein. A corresponding number of Cl counterions were placed throughout the solvent such that the overall system was electroneutral. The protein was placed at the centre of a cubic periodic box of size ∼70 Å, in the laboratory Cartesian frame of the original structure, with 10813 molecules of SPC/E water surrounding the protein structure. This was done in order to mimic biologically relevant situations closer to in vivo reality of solvated proteins; the goal is not to replicate directly low-moisture situations in neutron-scattering experiments where few enveloping solvation layers are present. Each simulation run was carried out at constant temperature and constant pressure. Temperature control was imposed using a velocity rescaling approach with a stochastic term that ensures a proper canonical ensemble46 with a time-constant of 0.1 ps and a pressure of 1 atm was maintained throughout the entire simulation using the Parrinello–Rahman method47 with a time-constant of 2 ps. We also applied long-range dispersion corrections for energy and pressure in these simulations. Holonomic constraints were handled by the LINCS method.48 The smooth particle-mesh Ewald (SPME) method49 was used to handle long-range electrostatic interactions. A systematic study was done for 26 different temperatures varying from 190 to 390 K. The integration timestep was taken as 2 fs. For each simulation, the system was equilibrated for a total time of 20 ns and, once the system is thermally stabilised, a production run of at least 20 ns was performed for each temperature, where trajectories were sampled every 2 ps for analysis.
320 Da and triclinic wild-type, namely the 2LZT crystal structure.45 Formal charges were chosen appropriate to pH 7, resulting in a total charge of +8e for this protein. A corresponding number of Cl counterions were placed throughout the solvent such that the overall system was electroneutral. The protein was placed at the centre of a cubic periodic box of size ∼70 Å, in the laboratory Cartesian frame of the original structure, with 10813 molecules of SPC/E water surrounding the protein structure. This was done in order to mimic biologically relevant situations closer to in vivo reality of solvated proteins; the goal is not to replicate directly low-moisture situations in neutron-scattering experiments where few enveloping solvation layers are present. Each simulation run was carried out at constant temperature and constant pressure. Temperature control was imposed using a velocity rescaling approach with a stochastic term that ensures a proper canonical ensemble46 with a time-constant of 0.1 ps and a pressure of 1 atm was maintained throughout the entire simulation using the Parrinello–Rahman method47 with a time-constant of 2 ps. We also applied long-range dispersion corrections for energy and pressure in these simulations. Holonomic constraints were handled by the LINCS method.48 The smooth particle-mesh Ewald (SPME) method49 was used to handle long-range electrostatic interactions. A systematic study was done for 26 different temperatures varying from 190 to 390 K. The integration timestep was taken as 2 fs. For each simulation, the system was equilibrated for a total time of 20 ns and, once the system is thermally stabilised, a production run of at least 20 ns was performed for each temperature, where trajectories were sampled every 2 ps for analysis.
To identify hydrogen bonds between the protein atoms and the water molecules at each snapshot, the geometric criteria as described by Durrant et al.50 were adopted. Only oxygen, nitrogen, fluorine or sulphur atoms were considered as the heavy-atom participants in forming hydrogen bonds. The distance between the donor and the acceptor heavy atoms must be less than 3.5 Å, and the angle between the hydrogen atom, the donor heavy atom and the acceptor heavy atom must be less than 30 degrees. Our hydrogen bond detection code tags each hydrogen bond by a ‘unique bond-identification number’ (UBIN) generated from the unique identities of the acceptor and the donor. Thus, whenever we refer to a hydrogen bond in this work, it implies a unique bond between a specific acceptor–donor pair. For each such unique hydrogen bond, characterized by its UBIN, we set a counter to count the percentage of time it is detected over the entire simulation time (20 ns). We call this quantity here as hydrogen bond occupation time.
During its entire occupation time, a hydrogen bond can disappear and re-appear again which we describe as ‘breakage’ and ‘formation’ of a bond respectively. The time of existence between such a subsequent ‘formation’ and ‘breakage’ event is defined as the lifetime of a bond.51 For each lifetime, we have associated two unique quantities, namely the distribution of lifetimes and partial lifetime contribution. The distribution of lifetimes is defined as the number of its occurrences over the entire simulation time (in percentage terms), whereas the partial lifetime contribution defines the proportion of time it contributes to the occupation time of that particular hydrogen bond (in percentage terms). To compare the relative mobility of each individual residue of the protein, we computed the root-mean-square fluctuations (RMSFs) of atomic positions for each of these residues in the trajectory after fitting to a reference frame which is taken as the average protein structure after equilibration.
Results and discussion
The protein–hydration water shell
Water molecules surrounding a protein fall into three broadly distinct categories:8 those confined in deep clefts of the folded protein known as ‘bound water’, those interacting directly with the exposed-surface protein atoms constituting the hydration layer – also known as ‘surface water’. The third category is ‘bulk water’ – in this case, water molecules are not directly in contact with the protein surface, but exchange continuously with the surface water. Estimating the thickness of a hydration shell is a well-debated subject, and has been studied extensively over the past few years. Both experimental techniques like dielectric relaxations, followed by more recent Terahertz-spectroscopy methods,52 as well as computer simulation, have been employed to estimate the hydration shell's thickness. Although most studies of rotational friction provide an estimate of 3–4 Å, more recent studies show that depending on the size of a protein, it can influence water molecules residing within a thickness of perhaps even more than 10 Å.34 In this study, to identify the hydration layer around HEWL, we computed the density distribution (Fig. 1) of the water molecules' centres of masses from the protein surface. Proteins, of course, do not have a regular shape. Normalising the density distribution requires an accurate estimation of the hydration shells' complex-shaped volumes around the protein. Using state-of-the-art ‘Voronoi-cell’ analysis,53 we computed the Voronoi volumes associated with each molecule in the hydration layer, thus estimating the hydration shell's total volume.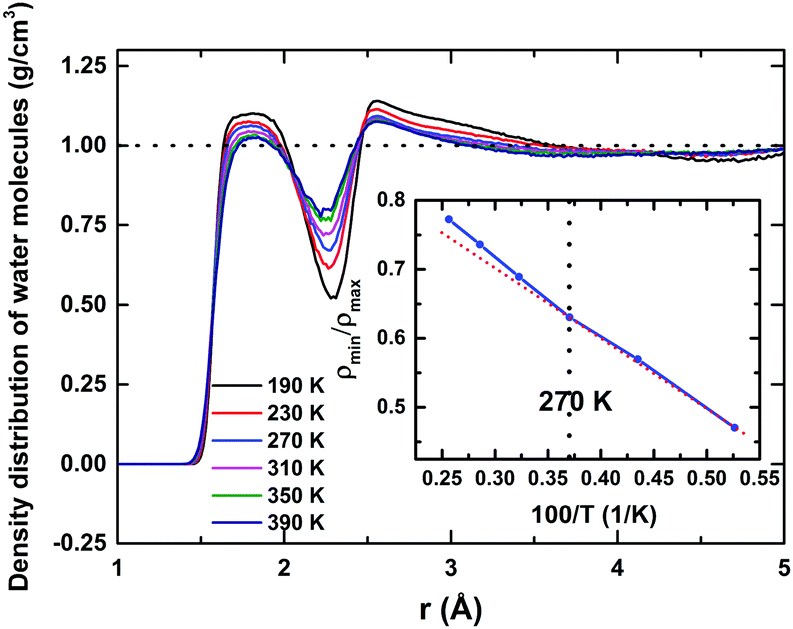 | ||
| Fig. 1 Density distribution of water molecules in the surroundings of the HEWL surface for a wide range of temperatures varying from 190 K to 390 K. Two distinct hydration layers are evident as the two maxima in the density distribution around 2 and 3 Å. As temperature increases, the spatial extent and the peak density of the first hydration layer decrease. In addition, the height of the first minimum increases and the height of the second maximum also decreases with temperature, indicating a de-packing of both the first and the second hydration layers. In the inset, the ratio of the first minimum to the first peak value of the density profile plotted against the inverse of temperature. The red dotted line serves as a guide for the eye to emphasize the deviation from the linearity. | ||
The resultant density distribution is shown in Fig. 1, for 190 to 390 K. Two distinct water layers around the protein surface are very much evident, being identified by the two maxima in the density distribution. At 190 K, the first monolayer extends up to a distance of ∼2.3 Å and the second one up to ∼4.6 Å, whilst the average density of the surrounding water approaches the normalised bulk-density value of 1 g cm−3 at a distance of ∼9 Å, indicating a far-reaching influence of the protein on the solvation–water structure. As temperature increases: (i) the spatial extent and the height of the first hydration layer decrease, (ii) the height of the first minimum increases, and (iii) the height of the second hydration layer also decreases; these indicate a “de-packing” of water molecules in the first and the second hydration layers (i.e., a lower local density in the environments of the protein surface). To probe the accompanying structural relaxation of the hydration layer about the protein's surface with temperature, manifested by this de-packing of water molecules of the first hydration layer, we calculated the ratio of the first non-zero minimum to the first peak value of the density distribution (ρmin/ρmax), as shown in the inset of Fig. 1. The ratio registers a linear increase with temperature from 190 to 270 K, indicating a swapping of water molecules between the first maximum and the first minimum regions. Above 270 K, a mild deviation and a relatively rapid increase up to 390 K occur, indicating that the reduction in the density of the first hydration layer is only marginally affected by that of the second layer even at higher temperatures, i.e., now few water molecules from the second peak region swap with the ones in the first minimum region, although the integrity of the first hydration layer is conserved. Water molecules interact with the polar ionic groups at the protein surface; the nature of such interaction is Coulombic. This charge–dipole interaction falls off as r−4:54 in the second solvation layer, this interaction is weakened substantially and water–water interactions dominate here. Thus, second-layer water molecules – no longer in direct contact with the protein surface – have higher mobility relative to those in the first one, with properties approaching those of bulk water. This indicates that, in practice, the first monolayer, in which a large proportion of residing water molecules remains coordinated or spatially restricted to the protein, can be regarded as the de facto hydration shell of the protein.
The protein dynamical transition and the fragile-to-strong dynamical crossover of its hydration water from the MD trajectories
To check that our MD simulations reproduce the typical features observed experimentally,7–11i.e. the PDT and the FSC, we have calculated the MSD of (i) the heavy atoms of the protein (black) and (ii) the hydration water (red), as a function of temperature (Fig. 2). For computing the MSD of the hydration layer using a multiple-time origin method, a rigorous filtration process was followed throughout independent subsections of the entire trajectories.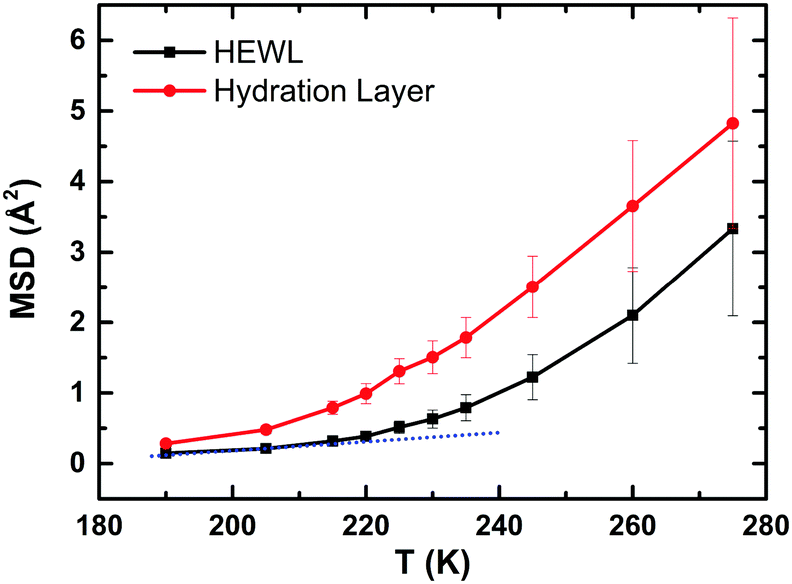 | ||
| Fig. 2 The mean square displacement of the heavy atoms of the protein (in black) and the hydration water (in red) versus temperature both showing the kink-like behaviour observed experimentally around 220 K. The blue dotted line is a guide for the eye. | ||
The centres of mass of water molecules were tracked, and those water molecules that remained in the first hydration layer for at least 90% of each subsection of 0.2 ns in duration were utilized to calculate the MSD of the hydration layer. For the protein also the 0.2 ns sampling length of each interval is used to compute the MSD. The two MSDs show the typical experimental trends, i.e. a kink-like behaviour around 220 K, proving, in turn, that our MD trajectories are fully consistent with the experiments. Based on this successful check, in the next sections we will focus on the hydrogen bond dynamics at the protein–water interface with the aim of studying if its behaviour shows any crossover around 220 K. We will see that this is not the case in a general “global” sense, but locally some residues of the protein show a drastic reduction in the number of hydrogen bonds with water molecules around 220 K. We will then propose a new explicative hypothesis.
Protein–hydration-water hydrogen-bonds: the general picture
The local molecular arrangement of water molecules in a hydration shell is expected to be perturbed by the presence of the protein molecule, in contrast to the bulk water where the local structure is governed by the number and nature of the hydrogen-bond connectivity. The complex heterogeneous surface topology of a protein, which in turn induces a heterogeneous local charge distribution therein, can play a crucial role in determining the hydrogen-bond network between the protein and its hydration layer; naturally, this influences the spatial distribution and orientation of the water molecules in the hydration layer. In Fig. 3, we show distributions of interaction energy between the protein and the hydration-shell water molecules for temperatures ranging from 190 to 390 K. Interestingly, the statistical distribution of interaction energies for 190 K exhibits well-defined multi-modal distributions, indicating the presence of groups of water molecules with unique well-defined orientational arrangements. While near hydrophobic regions of a protein, water molecules direct its hydrogen bonding sites away from the surface, the reverse orientation of water molecules could be realised near the hydrophilic regions of a protein.34 As temperature is increased, the distinct arrangements of water molecules in the hydration layer become markedly diminished: at 230 K, the distinct features of the energy distribution seen for 190 K begin to collapse, and disappear completely above 270 K. Interestingly, at around 220 K, both the PDT and the FSC of hydration water take place. The role of the hydration layer in such dynamical transition of a protein, though widely studied, is well debated and still an active area of research. The onset of breaking of local arrangements of water molecules in the hydration shell at 230 K, as seen from Fig. 3, must arise as a consequence of the changes in the underlying hydrogen-bond network present between the protein and its hydration layer. For instance, we now focus on the hydrogen bonding network at the protein–water interface. Following the criteria outlined in ‘Methodology’ (vide supra), the temperature variation of the number of hydrogen bonds (in log-scale) between the two is evaluated and plotted as shown in Fig. 4. The general trend is that by increasing the temperature, the number of hydrogen bonds decreases in a non-linear way. It is difficult to conclude whether a marked transition takes place at one specific temperature or a distribution of several and closer transitions gives a smoother trend.9,16 In any event, the main change occurs between ∼220 and ∼300 K, as obtained by considering the low- and high-temperature asymptotes (cf.Fig. 4). As a result, it is not possible to conclude definitively, in a ‘global-network’ sense, whether or not a drastic reduction of protein–water hydrogen bonds occurs at the PDT and FSC temperature, i.e. 220 K.7 However, in a more local sense, this is the case. In the inset of Fig. 4, we have also shown a plot of the number of different atomic sites belonging to all of the Arg residues which are involved in hydrogen bonding with the surrounding water molecules. In this case, a drastic reduction in this number is observed above 210 K. However, as will be presented in the next section, this is not fully representative of the ‘global’ behaviour, since some of the other residues are not sensitive to temperature in forming hydrogen-bonds with the water molecules, and others increase their bonding with water when the temperature increases instead (something somewhat counter-intuitive, at first glance). As a result the global picture of the protein–water hydrogen bonding network of Fig. 4 can be interpreted as a distribution of several local relaxation processes occurring between 200 and 300 K, rather than a specific sharp relaxation occurring at 220 K, i.e. at the PDT and FSC temperature. Whereas the Arg temperature behaviour offers prima facie evidence, at least in a preliminary fashion, of this acting as a mechanistic ‘trigger’ for the experimentally observed dynamical crossover8 and/or the rotation-to-translation transition9 in hydration-shell water at ∼220 K; the local and specific character of each transition is supportive of the notion of non-existence of any transition in the dynamical behaviour of the protein at the PDT temperature (induced by the hydration water).28–32 This implies that transitions in the protein's dynamical behaviour should either be characterised as a ‘global-network’ transition, rather than a residue-specific one, or need a more global transition as a pre-requisite. In the following section, these intriguing points will be discussed in detail; here, we wish to highlight that a scenario without transitions in the protein dynamics at the PDT temperature, but featuring a dynamical crossover of the hydration water, is plausible, and it has already been proposed based on neutron-scattering experiments:29,30,55 the present MD results offer support to these conjectured scenarios.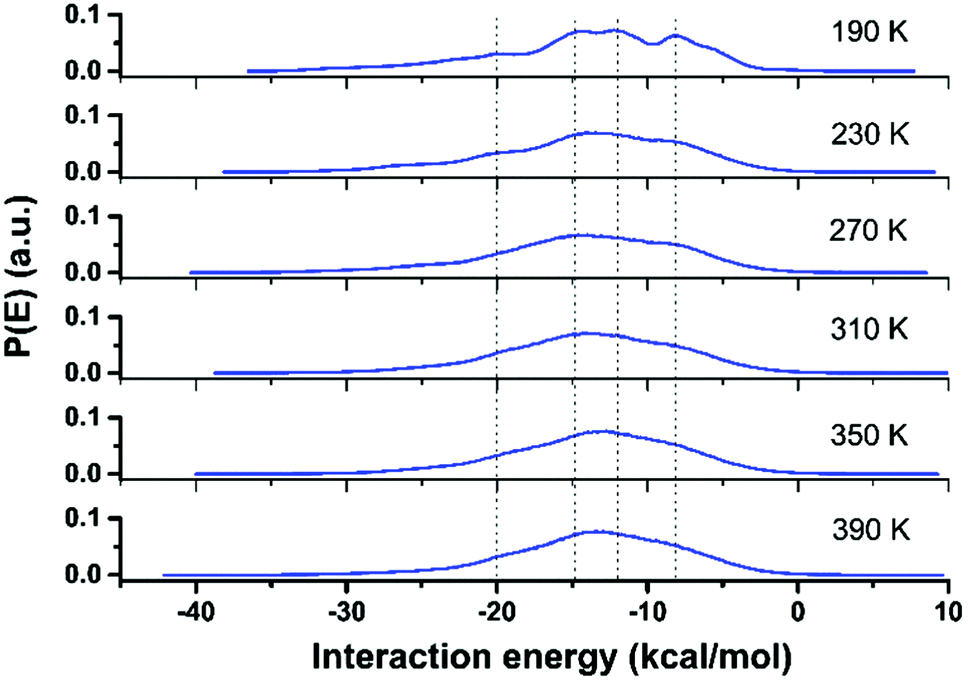 | ||
| Fig. 3 Distribution of interaction energy of water molecules present in the first hydration layer around the HEWL surface. A prominent presence of distinct features in the above distribution is seen for 190 K. As temperature increases, such features disappear gradually. | ||
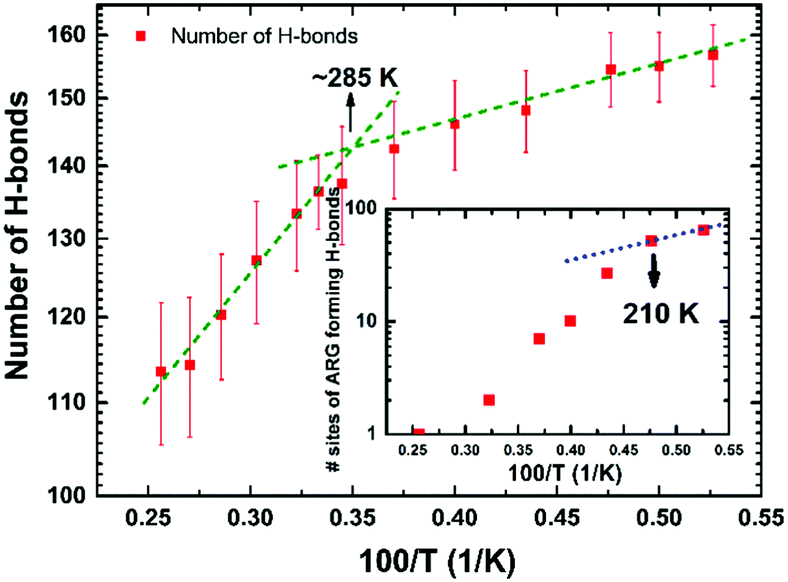 | ||
| Fig. 4 The number of protein–water hydrogen bonds as a function of 1/T. As temperature increases, a non-linear but continuous change in the pattern occurs, with a distribution of transitions between ∼220 K and ∼300 K. In the inset, the number of arginine sites involved in hydrogen bonds with water declines sharply above 210 K pointing to water–residue specific interaction as the driven general mechanism (see main text). | ||
Protein–hydration-water hydrogen bonds: a residue-per-residue study
To clarify the behaviour of hydrogen bonds as a function of temperature, we decided to study and classify these interactions between water molecules and each protein residue. Often, time correlation functions are used to quantify and understand the rate and mechanism of hydrogen-bond breaking.16,56 Using this method, one can measure the decay of hydrogen-bond lifetime correlation function which exhibits distinct characteristic time constants for water–water hydrogen-bonds in the bulk water and hydration layer, as well as for protein–water hydrogen-bonds. However, this method represents only an average estimate of hydrogen-bond dynamics, and may well conceal a rich tapestry of information of residue-specific variations of water–protein hydrogen-bond dynamics, and potential heterogeneous behaviour thereof. In the following discussion, we attempt to highlight such residue-specific behaviours in light of lifetimes, as defined in ‘Methodology’ (vide supra).The water molecules in the hydration layer, instead of being distributed uniformly over the entire protein surface, are attached by means of forming hydrogen bonds, preferably to some specific protein residues. In addition, there exists a significant temperature dependence of these residues' affinity to form hydrogen bonds with water molecules. In Table S1 (ESI†), we represent the scenario of hydrogen-bond formation for all 129 HEWL residues ranging from 190 to 390 K. Only those residues have been highlighted (cf. Table S1, ESI†) which form hydrogen bonds with an overall occupation time exceeding 20% of the entire simulation time. The number specified in the table corresponds to the number of active hydrogen-bond-forming-sites of each residue. Thus, this table serves to represent an overall picture of hydrophilicity of HEWL over a wide range of temperatures. At 190 K, there are 72 distinct residues (∼56%) that satisfy the above criterion of hydrogen-bond occupation time (cf.Fig. 5). As temperature is increased, this number reduces gradually to 34, 19, 11, 6 and 6% for 230, 270, 310, 350 and 390 K, respectively, indicating a strong thermal instability of hydrogen-bond lifetime for these residues. One can notice that at 190 K, residues like Arg (5, 7, 21, 45, 61, 68, 73), Ser (24, 72, 86, 91), Asn (19, 37, 74, 103), Trp (62, 63), Lys (1, 13, 33) and Gln41 have multiple atomic-sites which can form hydrogen-bonds with water molecules. (Here, the numbers in the parenthesis represent the serial location of these residues in the HEWL protein chain.) Although arginine appears to be a potential residue to form hydrogen bonds, except for Arg73, for the rest of the Arg residues, the ability to form such bonds decreases appreciably with increasing temperature and essentially disappears above 230 K, while residues like Phe34, Glu35, Ser36, Leu56, Gln57, Trp62, Trp63, Ser72, Arg73, Asn74, Ala90, Ser91, Asn103, Gly104, and Trp123 exhibit consistent thermal stability to maintain hydrogen-bonds with water even up to 310 K (or higher). A 3D-graphical representation of this scenario is presented in Fig. 5. Segments like Phe34–Glu35–Ser36, Leu56–Gln57, Trp62–Trp63, Ser72–Arg73–Asn74, Ala90–Ser91, Asn103–Asn104 and Trp123 exhibit enhanced thermal stability to maintain hydrogen-bonds with water in the hydration layer. From Table S1 (ESI†), by comparing the number of protein–water hydrogen bonds at 190 K with their number above 230 K we can also see that about 73% of the residues lose their hydrogen-bond-forming ability, 24% retain this ability without any particular qualitative change, and around 3% of residues get more involved in H-bond formation.
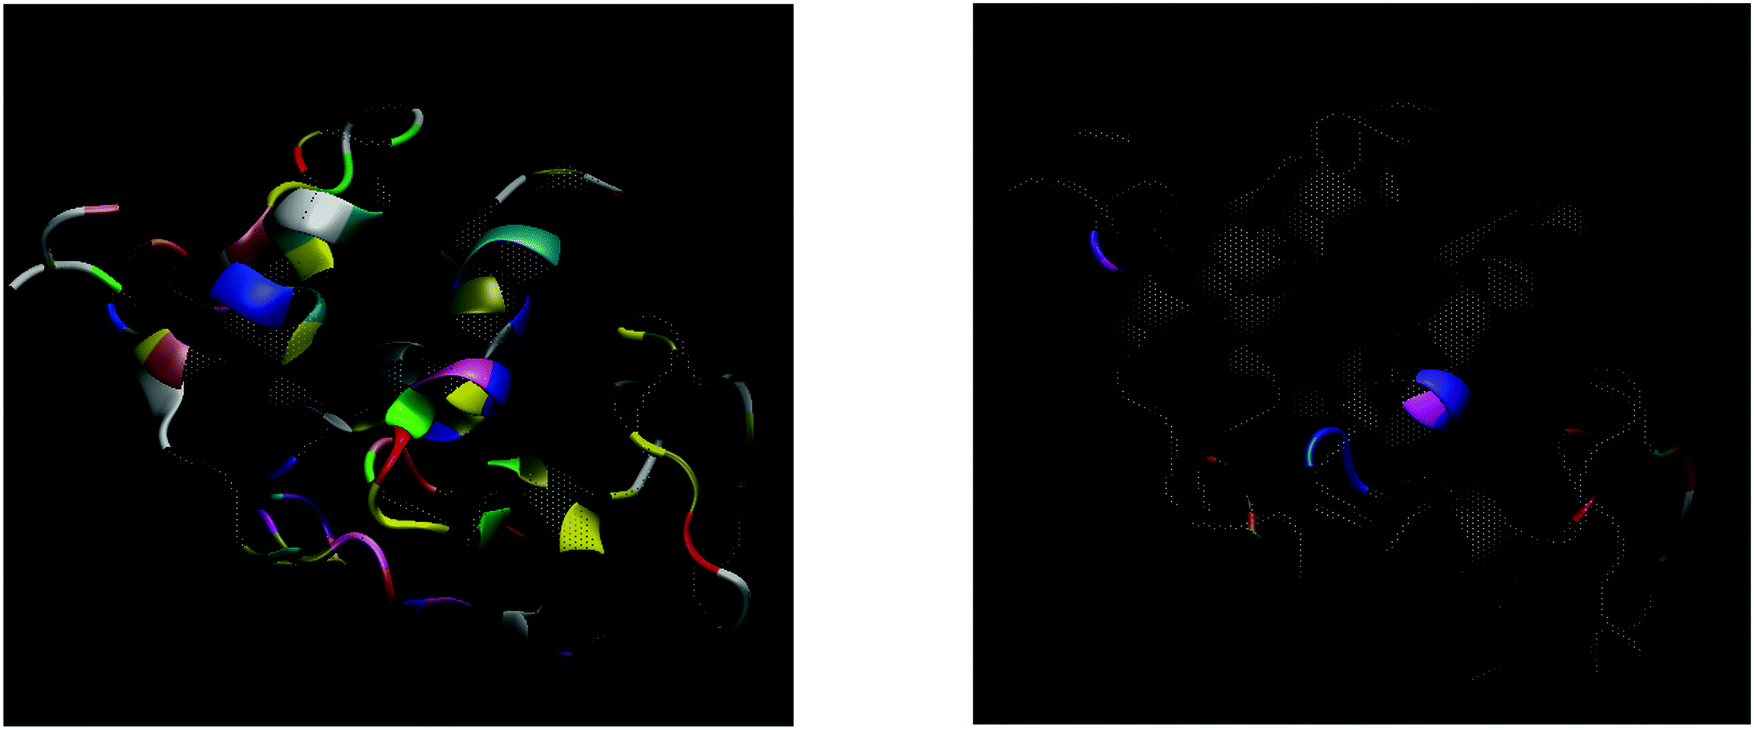 | ||
| Fig. 5 3D-graphical representation of HEWL. Left panel: Coloured residues represent those which form hydrogen bonds with water molecules in the hydration layer at 190 K. Colours are assigned based on the residue types. Right panel: As temperature is increased, the ability to form hydrogen bonds decrease dramatically, in general, although a few still continue to maintain the hydrogen-bond network with the surrounding water molecules even up to ∼350 K. Here, only those residues that show such thermal stability to maintain hydrogen bonds with water have been coloured. These are distributed around the whole protein surface, giving high-temperature hydrogen bonding an essentially global character. | ||
Two important points need to be mentioned here: (i) we should emphasize here that the above-mentioned differences among various residual sites of the protein are based on the differences in the number of hydrogen bonds with a long occupation time (4 ns or more), and not on the extent to which these sites differ in the absolute number of hydrogen bonds with any occupation time and (ii) although such long occupation time of a hydrogen bond between a protein residual site and a water molecule at high temperatures, at first glance, appears inconsistent with the picosecond reorientation times of water molecules of hydration layer of lysozymes as proposed by Laage and co-workers,36 as well as with the expected average displacement of water molecules at the surface of proteins,57 it must be borne in mind that these water molecules, particularly at high temperatures (e.g. 300 K), represent a subset of the hydration layer at any particular instant. Indeed, at ∼300 K, ∼10–15% of water typically remain in the hydration layer for more than 90% time of the 100 ps sampling window for drawing statistically meaningful MSDs of the hydration layer water molecules. By definition, these particular water molecules are more confined than the average in the instantaneous hydration layer. Therefore, the apparent discrepancy with ref. 36 and 57 relates purely to a difference in the definition of a more confined subset of the hydration layer versus an instantaneous and transient hydration layer representing more diffusive water molecules. To illustrate this confinement, we compare MSDs (cf. Fig. S2, ESI†) of the hydration layer water molecules (left panel) with the rest of the water molecules that are part of the bulk solvent (right panel), at five different temperatures. MSDs of hydration layer water molecules being almost one order less in magnitude than the bulk part, as evident from Fig. S2 (ESI†), clearly indicates the confinement effect of the hydration layer water molecules.
In the following sections, we have selected a few of the representing residues among these segments to explore the temperature dependence of their hydrogen-bond dynamics in light of lifetimes. The distribution of lifetimes for Arg73 is shown in Fig. 6(a) and (b) that corresponds, respectively, to the hydrogen- and nitrogen-site bonded together (either singly or doubly bonded) in the NH/NH2 groups of Arg73. The partial lifetime contribution, as defined in the Methodology section, is also reported in Fig. S1(a) and (b) (cf. ESI†). It is important to note that for both of these sites, hydrogen bonds with short lifetimes are dominant at 190 K. As the temperature is increased to 230 K and above, one can observe that, though not perfect, the distribution of lifetimes corresponding to shorter lifetimes decreases gradually and hydrogen bonds with longer lifetimes become more abundant. Hydrogen bonds with short lifetimes represent a ‘fast-breakage-and-formation’ paradigm of hydrogen-bond dynamics, whereas a longer lifetime indicates ‘slow dynamics’. A similar representation is made for Ser36, and Trp123 in Fig. 6(c and d). For both Ser36 and Trp123, an entirely reversed temperature dependence of hydrogen-bond dynamics vis-à-vis Arg73 is evident. In the case of Ser36, the order of maximum observed value of lifetime declines from a few hundreds to a few tens of picoseconds as the temperature is increased from 190 to 350 K, whilst for Trp123, the corresponding decrease in maximal lifetimes is quite dramatic, from tens of nanoseconds to hundreds of picoseconds. It is possible that, in the case of Trp123, the hydrogen-bonded water molecule is buried in a deep cleft at lower temperatures, not having sufficient scope to escape and thus displaying a very long lifetime, but as temperature is increased the protein starts to undergo large-amplitude conformational relaxations, providing an escape for the water molecule – enhancing more relatively rapid breakage/formation dynamics with increased temperature. In these two cases, as temperature is increased, the relatively slow dynamics of hydrogen-bond breakage/formation corresponding to longer lifetimes makes a transition towards a faster breakage/formation mechanism of hydrogen bonds, corresponding to a shorter lifetime. The third scenario is presented in Fig. 6(e) and (f), where the plot is shown for Ser91, for which the breakage and formation dynamics of hydrogen-bond is almost unaltered with temperature variation.
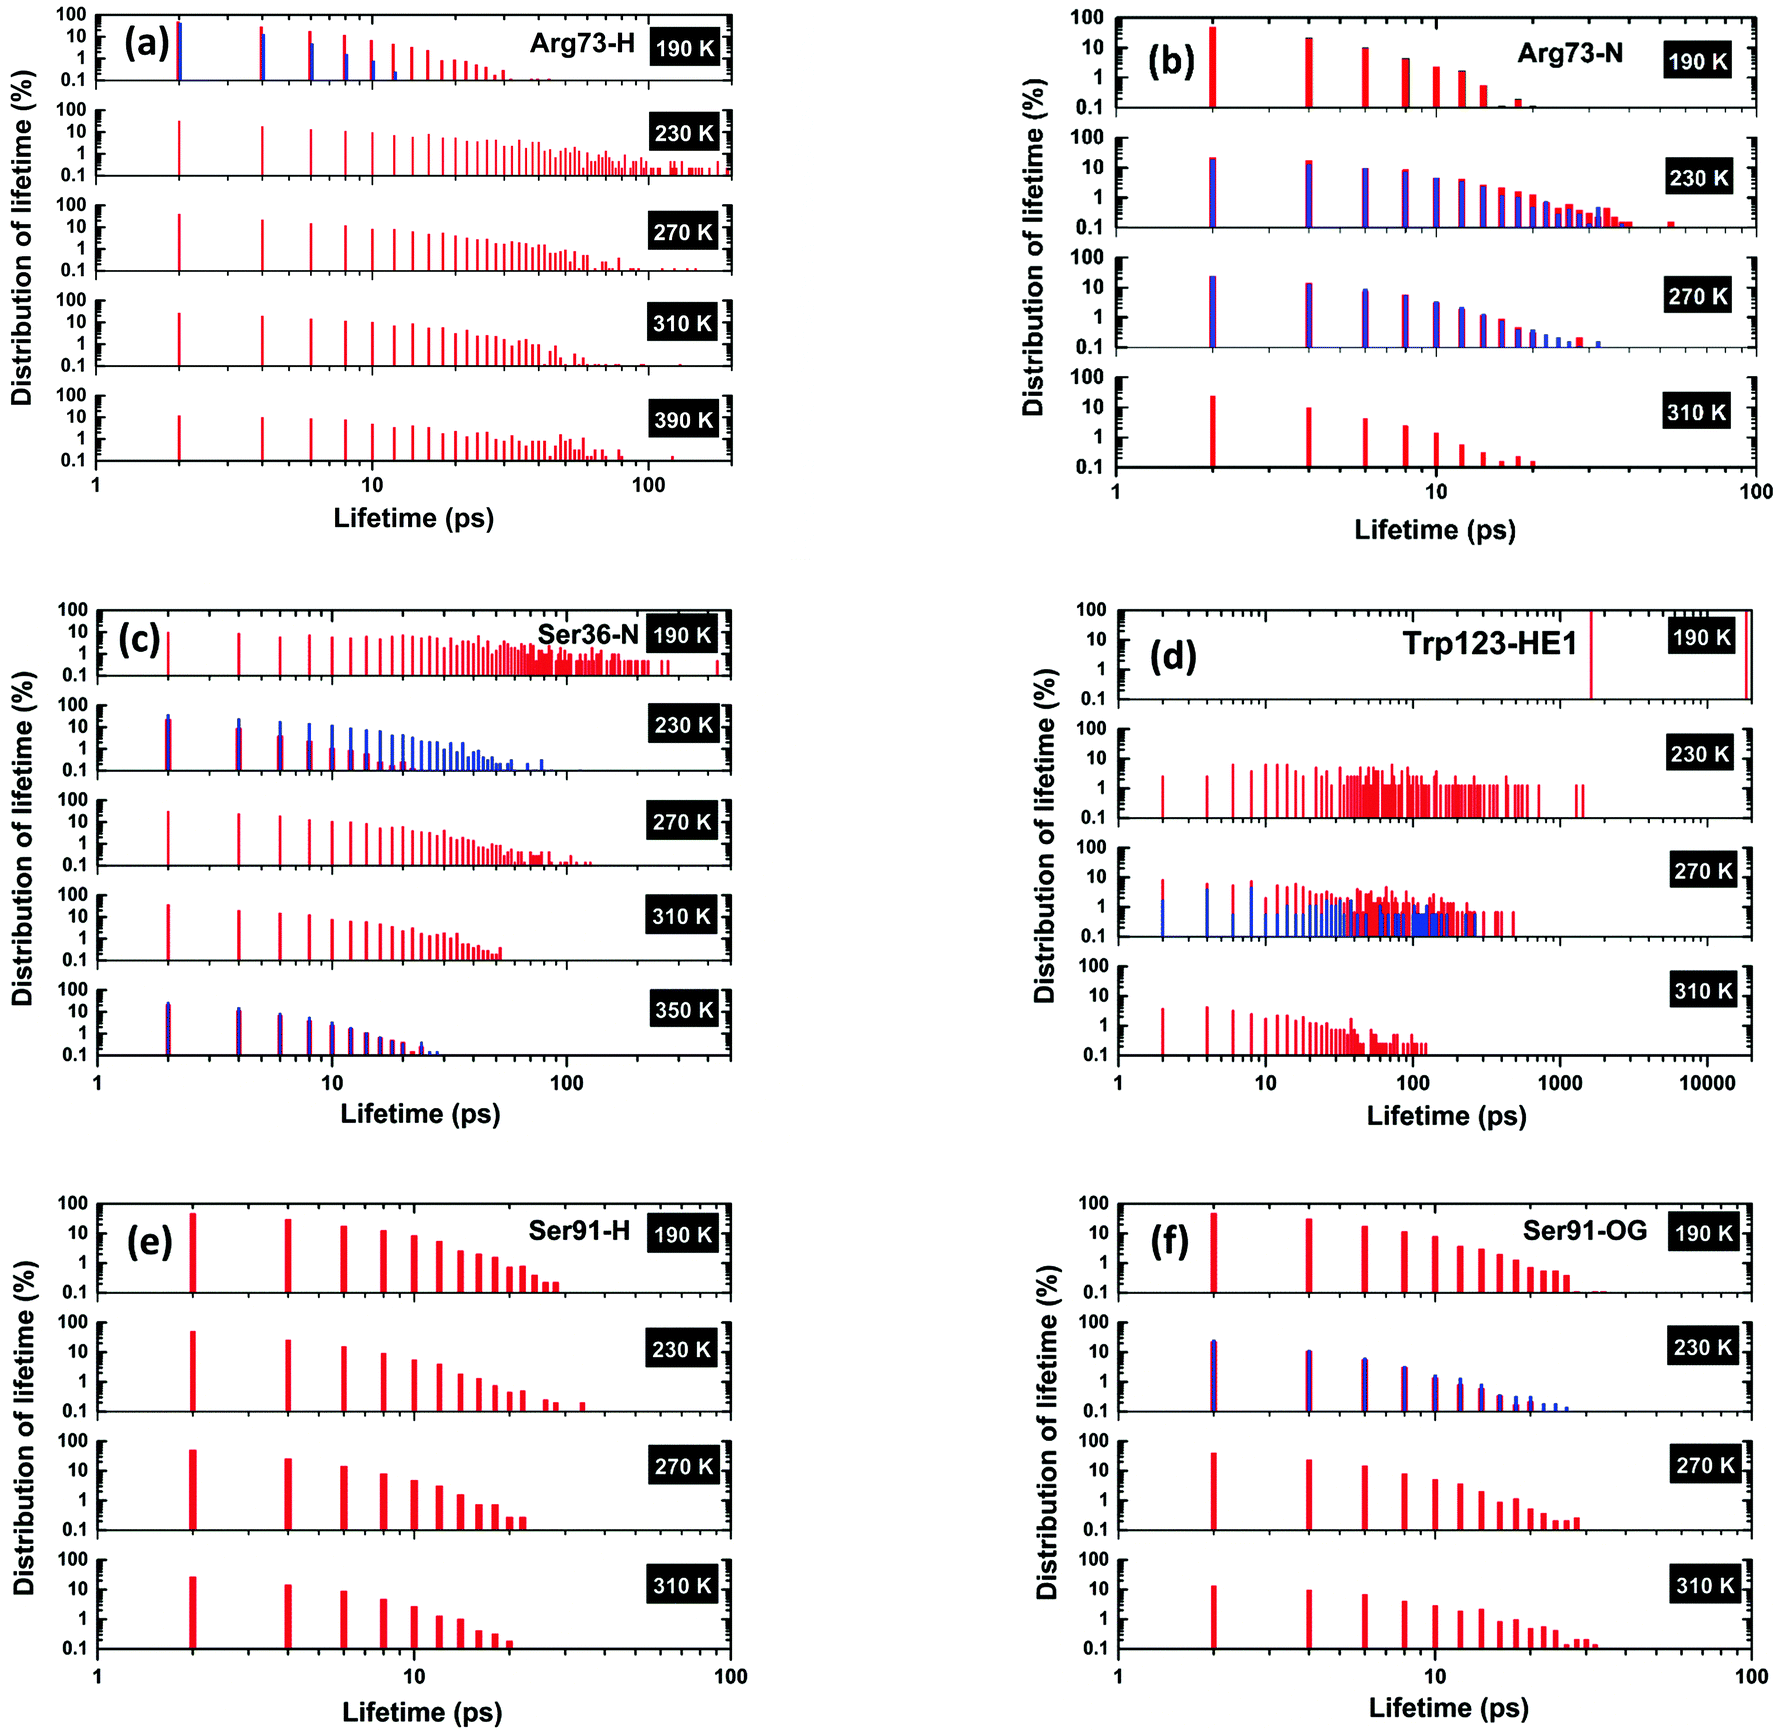 | ||
| Fig. 6 Distribution of lifetimes for (a and b) Arg73, (c) Ser36, (d) Trp123, and (e and f) Ser91. A lifetime is defined as the time for which a hydrogen bond is present continuously. The vertical axes represent the probability density for the number of appearances of a particular lifetime value. The probability density is calculated such that (details given in the ESI†) the sum over the probabilities for all of the identified lifetime values equals the occupation time expressed as a proportion (in percentage) of the total simulation time. (a) Arg73-H is based on a water oxygen atom hydrogen-bonding with an Arg73 proton, (b) Arg-N features a nitrogen atom in Arg73 bonding with a proton in a water molecule, (c) Ser36-N represents a hydrogen bond between a N-atom of Ser36 and a proton in a water molecule, (d) Trp123-HE1 features hydrogen bonding of a proton in Trp123 with a water oxygen atom, (e) Ser91-H represents a hydrogen bonding between a proton of Ser91 and an oxygen of a water molecule, and (f) Ser91-OG features a hydrogen bond between the oxygen atom of Ser91 and a proton of water. In these above bar plots, we have used two different colours (red and blue) when a particular protein residual site forms a hydrogen bond with more than one water molecule during the entire simulation: each colour represents a unique hydrogen bond between a protein residual site and a specific water molecule. | ||
Discussion: the protein governs hydrogen-bond dynamics at the protein–water interface
In view of the above observations, it is of overriding interest to address the following pertinent questions:(i) What renders some residues, like Arg, Ser, Trp, Gly, and Lys, preferable sites for hydrogen-bond formation with water?
(ii) Why is the ability of arginine for forming hydrogen bonds typically decreased with increasing temperature, and what allows serine to maintain its ability to form hydrogen bonds even at higher temperatures?
(iii) What are plausible reasons for the three broad categories (vide supra) of observed temperature dependence of hydrogen-bond formation-and-breakage dynamics of various HEWL residues?
(iv) What is the reason for the same type of residue to behave in a totally different way? For example, why does Arg73 improve its ability to hydrogen bond with water molecules while all the other arginine residues lose this ability almost completely above 230 K?
(v) Is there any consequence of such a heterogeneous scenario of protein–water hydrogen-bond dynamics on the observed (dynamical) crossovers in proteins and their hydration water?
The first major conclusion of our present study emerges somewhat directly from considering these questions: water molecules hydrating the protein exhibit different behaviour as a function of the residue with which they are hydrogen-bonded, and as a function of the residues in the surrounding environment (i.e. the residue sequence). This suggests that the hydrogen-bond dynamics at the protein–water interface is determined primarily by the protein, and not by the water molecules. As a result, the by-and-large accepted scenario (in that it is the dynamical crossover of the hydration water which determines the protein's dynamics and function13) is called into serious question, here.
Proteins are formed structurally by amino acids which are either polar or non-polar. From the current simulations, we notice that both polar (e.g., Arg, Lys) and non-polar residues (e.g., Ser, Trp, Gly) exhibit propensity for hydrogen bonds with water molecules. Key to this is that either N or H atoms in the N–H moieties present in these residues play a central role in interacting intimately with water molecules through forming strong hydrogen bonds. In the case of serine (Ser), the –COOH group also takes part in hydrogen-bond formation. The local electric field induced by the N–H dipole or the –COOH group serves to play a crucial role in hydrogen-bond formation. The thermal stability of these hydrogen bonds, as mentioned earlier, varies over different residues. Increasing temperature, in general, would be expected to induce increased mobility to different moieties of a protein. But, the degree of magnitude of such enhanced thermal mobility for these moieties varies depending on their structural flexibility governed by the strength of intramolecular bonds in a protein.
Root-mean-square-fluctuation (RMSF) is often considered to be an appropriate measure of structural flexibility of protein. In Fig. 7, we have shown the plots of RMSF versus temperature for different residues of HEWL. The left panel shows the RMSF plot for Arg5, Arg14, Arg21 and Glu35, which shows large RMSF values and the right panel shows the plot for Phe34, Ser36, Arg73, Asn74, Ala90 and Ser91, for which the RMSF values exhibit onset at ∼350 K and very interestingly, these residues are seen to maintain hydrogen bonds at higher temperatures, even up to 350 K as compared to the residues Arg5, Arg14, and Arg21 (shown in left panel) which experience larger amplitude fluctuations starting at a temperature as low as ∼230 K. The horizontal dashed line in the plot emphasizes that the magnitudes of RMSF for the residues in the left panel at ∼230 K are very much comparable to the magnitudes of RMSF at ∼350 K for the residues plotted in the right panel. Among all of the arginine residues present in HEWL, only Arg73 is seen to maintain hydrogen bonding with water for temperatures above ∼230 K which can also be explained from Fig. 7, where the RMSF for Arg73 is comparatively much lower in magnitude than other arginine residues (e.g., Arg5, Arg14, Arg21). The only exception to this trend is Glu35, which continues to form hydrogen bonds with water even up to 350 K, despite its large thermal motion (as evidenced by its RMSF plot in Fig. 7). This plot, in fact, highlights that the large amplitude protein motion influences the breaking of the protein–water hydrogen bond network, confirming our major conclusion mentioned above, i.e. the hydrogen-bond dynamics at the protein–water interface is determined primarily by the protein, and not by the water molecules.
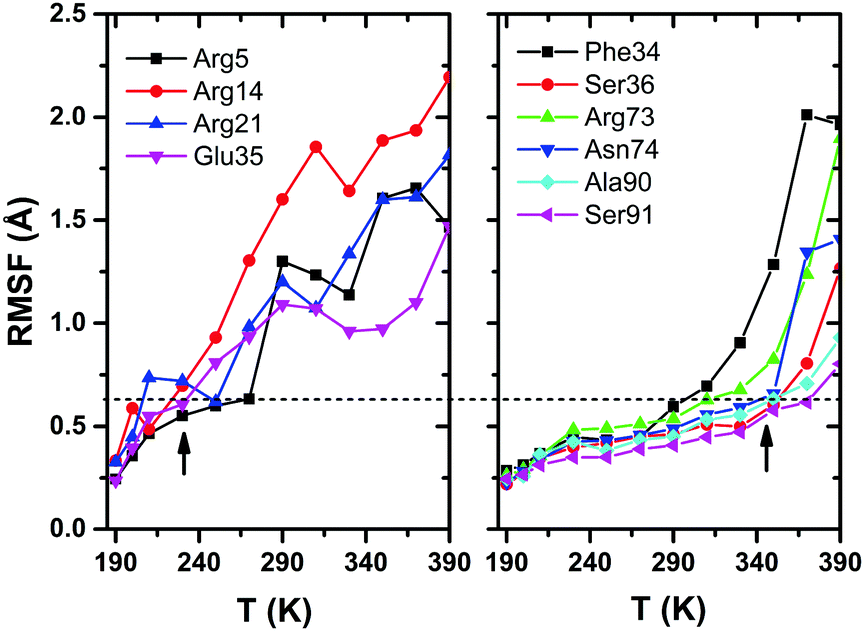 | ||
| Fig. 7 RMSF plots for different residues of HEWL. The left panel shows the residue for which the magnitude of RMSF is large, while the right panel shows the plot for residues which exhibit a relatively low RMSF values up to ∼350 K, followed by an onset. The dashed line acts as a guide for the eye to emphasize that the RMSF magnitude in the left panel at ∼230 K is comparable to the magnitude at ∼350 K in the right panel. It is also possible to find an indication of the heterogeneity nature of the water–protein hydrogen bonding, since there is a distribution of transition temperatures rather than a clear one. | ||
A more clear working hypothesis thus emerges, which serves to rationalise the observed behaviour of hydrogen-bond forming capabilities of different residues with temperature – it is the magnitude of thermal motions of different structural units (i.e., residues) of a protein that provide enough thermal energy to overcome energy barriers to break a hydrogen bond. To be more precise, all modes and all residues oscillate at the same equilibrium energy; although the amplitudes might be different, the energies are the same. The propensity to break a hydrogen bond is a property of the potential-energy surface (or, equivalently, the free-energy surface). This working hypothesis, although not perfect, is broadly consistent with the observed behaviour.
This explicative hypothesis is corroborated by an in silico experiment and neutron scattering data,8 as reported below.
To double check the validity of our working hypothesis we conduct the following in silico experiment. We have performed a new set of simulations in which the protein conformation is kept fixed (i.e. allowing only the water molecules to move around) at two different temperatures: 200 K and 300 K, i.e., above and below the relaxation of protein–water hydrogen bonds as shown in Fig. 4. In GROMACS, the protein atoms are almost immobilized by applying an infinitely heavy force constant on each of them. In this new computation we have frozen the protein heavy-atoms as well as the protein hydrogen atoms. The time-averaged number of hydrogen bonds (nHB) between the protein and the hydration layer is calculated for each of these configurations. The data are given in Table 1. One can conclude that:
| 200 K | 300 K | |
|---|---|---|
| Free protein | 155 ± 6 | 136 ± 5 |
| Fixed protein | 148 ± 5 | 140 ± 6 |
(i) For the ‘freely-moving’ protein configuration, a variation by ∼13% is observed, and the ANOVA test58 carried out on these data clearly shows that we can reject the ‘null-hypothesis’58 for this case, with a confidence exceeding 98%. In other words, the difference is statistically meaningful.
(ii) On the other hand, when the protein-conformations are fixed, the difference in nHB between 200 K and 300 K is reduced to ∼5%, and the ANOVA test58 confirms that this difference is now statistically not relevant.
The fact that the hydrogen bond networks at the protein–water interface at low and high temperatures (one above and the other below the relaxation temperatures as in Fig. 4) are almost the same when the protein is frozen is something that strongly supports our working hypostasis.
This explanatory hypothesis is also corroborated by the experimental behaviour of the relaxation time versus temperature obtained by Chen and co-workers,8 and, actually, serves in explaining it further. Below 220 K, hydration-layer water is characterised by a single relaxation process as its dynamical behaviour follows an Arrhenius trend. Above 220 K, however, its behaviour changes in a super-Arrhenius manner that is consistent with the distribution of different relaxation processes. This heterogeneous behaviour is in line with the heterogeneous nature of the protein surface made of different residues having different abilities to hydrogen-bond water molecules, and, in turn, supports empirically our hypothesis that the hydrogen-bond dynamics at the protein–water interface is determined primarily by the protein, and not by the water molecules.
As a result, the accepted scenario for this is the hydration water that determines the protein's dynamics and function13 has to be reconsidered, and new ideas have to be proposed. It seems that the long-amplitude motion of the protein determines the water dynamics above 220 K, and the still-elusive link between protein dynamics, the dynamics of its hydration water, and that of protein biological function, is still missing.
The above hypothesis leads to the second major conclusion of the present study: the dynamical crossover of the hydration water, observed experimentally at about 220 K8 and identified as the origin of PDT and bio-activity,7,9,13 lies not at the origin of the onset of protein's large-amplitude motion, but arises most probably as a consequence thereof. Whereas a breaking of one protein/hydration-water hydrogen bond can affect only locally the protein dynamics with almost negligible effects on its global relaxation, it can drastically affect the dynamics of the (now-formerly) bonded water molecule that is now free to diffuse (by roto-translational motion) potentially far from the original binding site. Indeed, this could be the microscopic origin of the rotational-to-translational transition in the dynamics of hydration water reported in ref. 9.
Finally, the heterogeneous nature of the hydration-water-to-protein hydrogen-bonding dependence on temperature, in terms of hydrogen-bonding dynamics and lifetime, is attributable to the heterogeneous ability of different residues of the protein to undergo hydrogen bonding to water molecules. Indeed, this is a ‘signature’ that the protein, ‘globally’ thinking, may/could not undergo any dynamical transition, while its hydration water does. This indirect, and perhaps not-unprovocative, conjecture is still somewhat tentative, and even though it needs further investigation, it could be considered as the first attempt of MD simulations to rule out the (almost) well-accepted PDT scenario.7,9 This is indeed the third major conclusion of the present study – albeit not without controversy and requiring further study, but already proposed and supported by (neutron) experiments.29,30,55
Conclusions
Several experiments and computer simulations have highlighted a link between the dynamics at the protein–water interface and the biological function. However this is a quite controversial topic – perhaps bordering on polemic; indeed, even the existence of popular concepts such as PDT and FSC is under serious debate. Since the interaction between the protein and the water is mediated by their ability to form hydrogen bonds at their interface, our study focuses on this aspect. As a result, using MD simulations, we have studied the temperature dependence of the protein–water hydrogen bonds in the range where bioactivity has been detected, i.e., T = 190–390 K. We have analysed the hydrogen-bond network at the protein–water interface on a residue-per-residue basis; this acts as an extension of previous similar studies done at fixed chemico-physical conditions, e.g., at ambient temperature as in ref. 36. This has allowed us to determine whether or not a “global” trend occurs at the PDT and FSC temperatures or whether the mechanisms behind these transitions have to be reconsidered as being more local in character. As a result, we can summarise our findings in the list given below:– We have identified the temperature (∼210 K) at which the number of protein–water hydrogen bonds starts dwindling and the distinct features observed in the interaction-energy distribution start to diminish and disappear, at a slightly higher temperature (∼230 K).
– We have also identified residues which take part actively in hydrogen bonds over this temperature range, and discussed their hydrogen-bond dynamics with respect to their lifetime dependence on system temperature. As a result, a picture of heterogeneous behaviour has emerged (summarised in the ESI† exhaustive table, residue-per-residue).
– The emerging behaviour does not depend only on the residue itself, but rather on the surrounding environment. This suggests that this could be of interest to (experimentally) studying (small) proteins, where the sequence of amino acids slightly differs, something that actually happens in nature after a mutation. An intriguing case could be represented by anti-freeze proteins in their native and mutant forms,59,60 as the mutants have shown lower activity.60,61
– The heterogeneous character of hydrogen-bond relaxation dynamics at the protein–water interface suggests that this dynamics is governed by the heterogeneity of the protein surface, and not by the water. As a result, the major conclusion of our paper is that the by-and-large accepted scenario, in which is the dynamical crossover of the hydration water determines the protein's dynamics and function, is called into serious question.
– New ideas about the connection between protein dynamics, the dynamics of its hydration water, and the biological function thereof, need to be proposed and experimentally tested.
– Neutron scattering is confirmed as an important tool to unravel the link between protein function and dynamics, since the hydrogen-bond network at the protein–water interface seems to be a good “indirect” physical observable to probe it. However, we believe that new methods and approaches (within the family of neutron-based techniques), more focused on these key “scientific questions” still outstanding, have to be considered in the future, e.g., ref. 55.
Acknowledgements
The authors thank the Irish Centre for High-End Computing for the provision of High-Performance Computing facilities and Prof. Pietro Ballone for fruitful discussions. NE, ZF and PKN thank Science Foundation Ireland (Grant 15/ERC/I3142). AB acknowledges support from the European Community under the Marie Curie Fellowship Grants HYDRA (No. 301463) and PSI-FELLOW (No. 290605), with additional support provided by the School of Physics, University College Dublin, Ireland.Notes and references
- J. A. Rupley and G. Careri, in Advances in Protein Chemistry, ed. C. B. Anfinsen, J. T. Edsall, F. M. Richards and D. S. Eisenberg, Academic Press, Cambridge, 1991, vol. 41, pp. 37–172 Search PubMed.
- B. F. Rasmussen, A. M. Stock, D. Ringe and G. A. Petsko, Crystalline ribonuclease A loses function below the dynamical transition at 220 K, Nature, 1992, 357, 423–424 Search PubMed.
- A. Lee and W. A. Joshua, Microscopic origins of entropy, heat capacity and the glass transition in proteins, Nature, 2001, 411, 501–504 Search PubMed.
- P. W. Fenimore, H. Frauenfelder, B. H. McMahon and R. D. Young, Bulk-solvent and hydration-shell fluctuations, similar to α- and β-fluctuations in glasses, control protein motions and functions, Proc. Natl. Acad. Sci. U. S. A., 2004, 101, 14408–14413 Search PubMed.
- F. G. Parak, Proteins in action: the physics of structural fluctuations and conformational changes, Curr. Opin. Struct. Biol., 2003, 13, 552 Search PubMed.
- M. Faarrand, A. J. Dianoux, W. Petry and G. Zaccai, Thermal motion and functions of bacteriorhodopsin in purple membranes: Effects of temperature and hydration studied by neutron scattering, Proc. Natl. Acad. Sci. U. S. A., 1993, 90, 9668–9672 Search PubMed.
- W. Doster, S. Cusak and W. Petry, Dynamical transition of myoglobin revealed by inelastic neutron scattering, Nature, 1989, 337, 754–756 Search PubMed.
- S. H. Chen, L. Liu, E. Fratini, P. Baglioni, A. Faraone and E. Momontov, Observation of fragile-to-strong dynamic crossover in protein hydration water, Proc. Natl. Acad. Sci. U. S. A., 2006, 103, 9012–9016 Search PubMed.
- G. Schiro, Y. Fichou, F.-X. Gallat, K. Wood, F. Gabel, M. Moulin, M. Hartlein, M. Heyden, J.-P. Colletier, A. Orecchini, A. Paciaroni, J. Wuttke, D. Tobias and M. Weik, Translational diffusion of hydration water correlates with functional motions in folded and intrinsically disordered proteins, Nat. Commun., 2015, 6, 6490 Search PubMed.
- S. Magazu, F. Migliardo and A. Benedetto, Mean Square Displacements from Elastic Incoherent Neutron Scattering Evaluated by Spectrometers Working with Different Energy Resolution on Dry and Hydrated (H2O and D2O) Lysozyme, J. Phys. Chem. B, 2010, 114, 9268–9274 Search PubMed.
- S. Magazu, F. Migliardo, A. Benedetto, R. La Torre and L. Hennet, Bio-protective effects of homologous disaccharides on biological macromolecules, Eur. Biophys. J., 2012, 41, 361–367 Search PubMed.
- C. A. Angell, Relaxation in liquids, polymers and plastic crystals – strong/fragile patterns and problems, J. Non-Cryst. Solids, 1991, 131–133, 13–31 Search PubMed.
- H. Frauenfelder, G. Chen, J. Berendzen, P. W. Fenimore, H. Jannson, B. H. Mcmahon, I. R. Stroe, J. Swenson and R. D. Young, A unified model of protein dynamics, Proc. Natl. Acad. Sci. U. S. A., 2009, 106, 5129–5134 Search PubMed.
- I. E. T. Iben, D. Braunstein, W. Doster, H. Frauenfelder, M. K. Hong, J. B. Johnson, S. Luck, P. Ormos, A. Schulte, P. J. Steinbach, A. H. Xie and R. D. Young, Glassy Behavior of a Protein, Phys. Rev. Lett., 1989, 62, 1916–1919 Search PubMed.
- C. A. Angell, Formation of Glasses from Liquids and Biopolymers, Science, 1995, 267, 1924–1935 Search PubMed.
- M. Tarek and D. J. Tobias, Role of Protein-Water Hydrogen Bond Dynamics in the Protein Dynamical Transition, Phys. Rev. Lett., 2002, 88, 138101 Search PubMed.
- M. Tarek and D. J. Tobias, Environmental dependence of the dynamics of protein hydration water, J. Am. Chem. Soc., 1999, 121, 9740–9741 Search PubMed.
- G. Zaccai, How soft is a protein? A protein dynamics force constant measured by neutron scattering, Science, 2000, 288, 1604–1607 Search PubMed.
- W. Doster, The dynamical transition of proteins, concepts and misconceptions, Eur. Biophys. J., 2008, 37, 591–602 Search PubMed.
- A. P. Sokolov, J. H. Roh, E. Mamontov and V. Garcia Sakai, Role of hydration water in dynamics of biological macromolecules, Chem. Phys., 2008, 345, 212–218 Search PubMed.
- W. Doster, S. Cusack and W. Petry, Dynamic instability of liquidlike motions in a globular protein observed by inelastic neutron scattering, Phys. Rev. Lett., 1990, 65, 1080–1083 Search PubMed.
- P. W. Fenimore, H. Frauenfelder, B. H. McMahon and R. D. Young, Proteins are paradigms of stochastic complexity, Physica A, 2005, 351, 1 Search PubMed.
- M. Weik, R. B. G. Ravelli, I. Silman, J. L. Sussman, P. Gros and J. Kroon, Specific protein dynamics near the solvent glass transition assayed by radiation-induced structural changes, Protein Sci., 2001, 10, 1953–1961 Search PubMed.
- U. Lehnert, V. Réat, M. Weik, G. Zaccaï and C. Pfister, Thermal Motions in Bacteriorhodopsin at Different Hydration Levels Studied by Neutron Scattering: Correlation with Kinetics and Light-Induced Conformational Changes, Biophys. J., 1998, 75, 1945–1952 Search PubMed.
- T. Kleinert, W. Doster, F. Post and M. Settles, Hydration effects on protein function: the kinetics of ligand binding to myoglobin, in Proceedings of the Italian Physical Society, ed. M. U. Palma, M. B. Palma-Vittorelli and F. Parak, Societa Italiana di Fisica, Bologna, 1993, pp. 127–130 Search PubMed.
- P. Kumar, Z. Yan, L. Xu, M. G. Mazza, S. V. Buldyrev, S.-H. Chen, S. Sastry and H. E. Stanley, Glass Transition in Biomolecules and the Liquid-Liquid Critical Point of Water, Phys. Rev. Lett., 2006, 97, 177802 Search PubMed.
- C. F. Wong, C. Zheng and J. A. McCammon, Glass transition in pure SPC/E water and protein solution: a molecular dynamics simulation study, Chem. Phys. Lett., 1989, 154, 151–154 Search PubMed.
- S. Khodadadi, S. Pawlus, J. H. Row, V. G. Sakai, E. Mamontov and A. P. Sokolov, The origin of the dynamic transition in proteins, J. Chem. Phys., 2008, 128, 195106(1) Search PubMed.
- S. Magazu, F. Migliardo and A. Benedetto, Elastic incoherent neutron scattering operating by varying instrumental energy resolution: principle, simulations, and experiments of the resolution elastic neutron scattering (RENS), Rev. Sci. Instrum., 2012, 82, 105115(1) Search PubMed.
- S. Magazu, F. Migliardo and A. Benedetto, Puzzle of Protein Dynamical Transition, J. Phys. Chem. B, 2011, 115, 7736–7743 Search PubMed.
- T. Becker, J. A. Hayward, J. L. Finney, R. M. Daniel and J. C. Smith, Neutron frequency windows and the protein dynamical transition, Biophys. J., 2004, 87, 1436–1444 Search PubMed.
- R. D. Young, H. Frauenfelder and P. Fenimore, Mossbauer effect in proteins, Phys. Rev. Lett., 2011, 107, 158102 Search PubMed.
- W. Doster, S. Busch, A. M. Gaspar, M.-S. Appavou, J. Wuttke and H. Scheer, Dynamical Transition of Protein-Hydration Water, Phys. Rev. Lett., 2010, 104, 098101 CrossRef CAS PubMed.
- B. Bagchi, Hydration of proteins, Water in Biological and Chemical Processes: From Structure and Dynamics to Function, Cambridge University Press, Cambridge, 2013, pp. 117–134 Search PubMed.
- B. Bagchi, Understanding the protein hydration layers: lessons from computer simulations, Water in Biological and Chemical Processes: From Structure and Dynamics to Function, Cambridge University Press, Cambridge, 2013, pp. 135–149 Search PubMed.
- F. Sterpone, G. Stirnemann and D. Laage, Magnitude and molecular origin of water slowdown next to a protein, J. Am. Chem. Soc., 2012, 134, 4116–4119 Search PubMed.
- M. Marchi, F. Sterpone and M. J. Ceccarelli, Water rotational relaxation and diffusion in hydrated lysozyme, J. Am. Chem. Soc., 2002, 124, 6787–6791 Search PubMed.
- B. Bagchi, Water solvation dynamics in the bulk and in the hydration layer of proteins and self-assemblies, Annu. Rep. Prog. Chem., Sect. C: Phys. Chem., 2003, 99, 127–175 Search PubMed.
- D. Laage and J. T. Hynes, A molecular jump mechanism of water reorientation, Science, 2006, 311, 832–835 Search PubMed.
- D. Laage and J. T. Hynes, One the molecular mechanism of water reorientation, J. Phys. Chem. B, 2008, 112, 14230–14242 Search PubMed.
- D. V. D. Spoel, E. Lindahl, B. Hess, G. Groenhof, A. E. Mark and H. J. C. Berendsen, GROMACS: Fast, flexible, and free, J. Comput. Chem., 2005, 26, 1701–1718 Search PubMed.
- W. L. Jorgensen, D. S. Maxwell and J. Tirado-Rives, Development and Testing of the OPLS All-Atom Force Field on Conformational Energetics and Properties of Organic Liquids, J. Am. Chem. Soc., 1996, 118, 11225–11236 Search PubMed.
- G. A. Kaminski, R. A. Friesner, J. Tirado-Rives and W. L. Jorgensen, Evaluation and Reparametrization of the OPLS-AA Force Field for Proteins via Comparison with Accurate Quantum Chemical Calculations on Peptides, J. Phys. Chem. B, 2001, 105, 6474–6487 Search PubMed.
- H. J. C. Berendsen, J. R. Grigera and T. P. Straatsma, The missing term in effective pair potentials, J. Phys. Chem., 1987, 91, 6269–6271 Search PubMed.
- M. Ramanadham, L. C. Sieker and L. H. Jensen, Refinement of triclinic lysozyme: II. The method of stereochemically restrained least squares, Acta Crystallogr., Sect. B: Struct. Sci., 1990, 46, 63–69 Search PubMed.
- G. Bussi, D. Donadio and M. Parrinello, Canonical sampling through velocity rescaling, J. Chem. Phys., 2007, 126, 014101 Search PubMed.
- M. Parrinello and A. Rahman, Polymorphic transitions in single crystals: a new molecular dynamics method, J. Appl. Phys., 1981, 52, 7182–7190 Search PubMed.
- B. Hess, H. Bekker, H. J. C. Berendsen and J. G. E. M. Fraaije, LINCS: a linear constraint solver for molecular simulations, J. Comput. Chem., 1997, 18, 1463–1472 Search PubMed.
- U. Essmann, L. Perera, M. L. Berkowitz, T. Darden, H. Lee and L. G. Pedersen, A smooth particle mesh Ewald method, J. Chem. Phys., 1995, 103, 8577–8593 Search PubMed.
- J. D. Durrant and J. A. McCammon, HBonanza: A Computer Algorithm for Molecular-Dynamics-Trajectory Hydrogen-Bond Analysis, J. Mol. Graphics Modell., 2011, 31, 5–9 Search PubMed.
- G. Y. Solomentsev, N. J. English and P. O'Brien, Hydrogen bond perturbation in hen egg white lysozyme by external electromagnetic fields: a nonequilibrium molecular dynamics study, J. Chem. Phys., 2010, 133, 235102 Search PubMed.
- S. Ebbinghaus, S. J. Kim, M. Heyden, X. Yu, U. Heugen, M. Greubele, D. M. Leitner and M. Havenith, An extended dynamical hydration shell around proteins, Proc. Natl. Acad. Sci. U. S. A., 2007, 104, 20749–20752 Search PubMed.
- G. F. Voronoi, Recherches sur les paralléloèdres primitives, J. Reine Angew. Math., 1908, 134, 198–287 Search PubMed.
- B. Halle and M. Davidovic, Biomolecular hydration: from water dynamics to hydrodynamics, Proc. Natl. Acad. Sci. U. S. A., 2003, 100, 12135–12140 Search PubMed.
- A. Benedetto and G. J. Kearley, Elastic scattering spectroscopy (ESS): an instrument-concept for dynamics of complex (bio-) systems from elastic neutron scattering, Sci. Rep., 2016, 6, 34266 Search PubMed.
- B. Jana, S. Pal and B. Bagchi, Hydrogen bond breaking mechanism and water reorientational dynamics in the hydration layer of lysozyme, J. Phys. Chem. B, 2008, 112, 9112–9117 Search PubMed.
- C. Rocchi, A. R. Bizzarri and S. Cannistraro, Water dynamical anomalies evidenced by molecular-dynamics simulations at the solvent-protein interface, Phys. Rev. E: Stat. Phys., Plasmas, Fluids, Relat. Interdiscip. Top., 1998, 57, 3315–3325 Search PubMed.
- R. V. Hogg, J. McKean and A. T. Craig, Introduction to Mathematical Statistics, Pearson Education Limited, Harlow, Essex CM20 2JE, 7th edn, 2014 Search PubMed.
- J. G. Duman, Antifreeze and ice nucleator proteins in terrestrial orthopods, Annu. Rev. Physiol., 2001, 63, 327–357 Search PubMed.
- K. Meister, S. Ebbinghaus, Y. Xu, J. G. Duman, A. DeVries, M. Gruebele, D. M. Leitner and M. Havenith, Long-range protein-water dynamics in hyperactive insect antifreeze proteins, Proc. Natl. Acad. Sci. U. S. A., 2013, 110, 1617–1622 Search PubMed.
- A. D. J. Haymet, L. G. Ward, M. M. Harding and C. A. Knight, Valine substituted winter flounder ‘antifreeze’: preservation of ice growth hysteresis, FEBS Lett., 1998, 430, 301–306 Search PubMed.
Footnote |
| † Electronic supplementary information (ESI) available. See DOI: 10.1039/c6cp05601f |
| This journal is © the Owner Societies 2017 |