Impact of position and number of boron atom substitution on hydrogen uptake capacity of Li-decorated pentalene
Priyanka
Tavhare
a,
Amol
Deshmukh
bc and
Ajay
Chaudhari
*a
aDepartment of Physics, The Institute of Science, Fort, Mumbai 400 032, Maharashtra, India. E-mail: ajaychau5@yahoo.com
bInstitute of Atomic and Molecular Sciences, Molecular Science and Technology Program, Taiwan International Graduate Program, Academia Sinica, Taipei 11529, Taiwan
cDepartment of Physics, National Central University, Jung-Li 32001, Taiwan
First published on 18th November 2016
Abstract
We have performed an ab initio and density functional theory study of the hydrogen adsorption on a lithium (Li)-decorated pentalene (C8H6Li2) complex. The C8H6Li2 complex can interact with a maximum of two hydrogen molecules with a H2 uptake capacity of 3.36 wt%. The effect of the number and position of boron atom substitution in the C8H6Li2 complex on the H2 uptake capacity is also studied. Two and four carbon atoms are substituted by boron atoms in the C8H6Li2 complex. Two different structures are considered for each of the two and four boron atom substitutions. It is found that boron substitution in the C8H6Li2 complex enhances the binding energy of Li to the substrate. Four boron atom substitution at different positions also affects the H2 uptake capacity. The two structures of two boron-substituted complexes (C6B2H6Li2) show the same H2 uptake capacity viz. 6.63 wt%. Unlike the two boron-substituted complexes, two different structures of the four boron-substituted complexes (C4B4H6Li2) show different H2 uptake capacity which is found to be 9.81 wt% and 6.76 wt%. The temperature and pressure range for energetically favourable H2 adsorption on these complexes is predicted using the Gibbs free energy corrected H2 adsorption energy. Various interaction energies are calculated for all the maximum H2-adsorbed complexes using the many-body analysis approach. The H2 desorption temperature for these complexes is predicted using the Van't Hoff equation and is found to be in the range of 25 K to 115 K. Molecular dynamics simulations for all these complexes are performed which show that these complexes can not bind a single H2 molecule at ambient conditions during the simulations. However, H2 adsorption on these complexes is energetically favourable at low temperature.
1. Introduction
The world's energy demand is increasing with the quickly rising population. All of us are dependent on fossil fuels for transportation. The number of vehicles on the globe is growing day by day and this results in high consumption of fossil fuels which depletes fossil resources. A polluted environment and the greenhouse effect are the end results of using fossil fuels. Therefore, it is necessary to transit from the fossil energy configuration to technology which should be based on a clean and lifelong energy source. Hydrogen fuel cells can be the best alternative substitute because of their zero emission characteristics and they can change the future of energy infrastructure. However, the hydrogen storage obstacle needs to be overcome to complete the hydrogen economy cycle.1 The energy density of molecular hydrogen is high by its mass and low by volume. Different technologies are available to store molecular hydrogen and among all the hydrogen storage methods, the solid-state hydrogen storage technique has better features.2 Hydrogen storage systems have been studied by considering different aspects such as gravimetric and volumetric hydrogen storage densities, refuelling time, operating temperature and pressure etc. The hydrogen storage capacity of different materials like chemical/metal hydrides, different metal–organic frameworks (MOFs), organic and inorganic nanostructures, and different organometallic (OM) materials has been tested from a vehicular relevance point of view.3–26 Numerous efforts have been made to upgrade the hydrogen storage capacity of these materials. But none of these materials have shown all the characteristics and satisfy the target set by the U. S. Department of Energy (DOE) by 2020.27Nowadays attention has been focused on OM complexes as hydrogen storage media. Several investigations have been carried out on metal-doped CnHn complexes (n = 3, 4, 5, 6, 8) and other metal-decorated compounds from a hydrogen storage point of view.5–16 Earlier studies on metal-decorated CnHn rings have made use of the 18 electron rule as a guide tool to determine the maximum number of hydrogen molecules that can interact with a transition metal (TM)-doped CnHn ring.9–16. TiC4H4, TiC5H5, and TiC8H8 complexes can store up to five, four, and three hydrogen molecules respectively which is governed by the 18 electron rule.9 Martinez et al. concluded that the Sc-doped C4H4 ring structure is feasible for reversible hydrogen storage on early transition metal (TM = Sc, Ti, V)-doped CnHn ring (n = 4, 5) structures.10 Wadnerkar et al. showed that among all the V-doped CnHn ring structures, the V-capped VC3H3 complex can adsorb maximum hydrogen molecules with 10.07 wt% hydrogen uptake capacity.11 Liu et al. roughly estimated the average desorption temperature of hydrogen molecules for the Ti(C5H5)+(5H2) complex as 715 K.12 The H2 uptake capacity of Sc- and V-doped CnHn (n = 4, 5, 6) ring complexes was reported by Weck et al. and compared with Ti-doped CnHn ring structures.13 Guo et al. obtained a 3.49 wt% hydrogen uptake capacity for Co- and Ni-decorated CnHn (n = 4, 5) OM complexes which is much lower than that of early TM (Sc, Ti, V)-doped CnHn (n = 4, 5) OM complexes.14 Bodrenko et al. showed that the electrostatic force of an ion-doped aromatic ring (benzene) can bind hydrogen molecules strongly to it.15 The kinetics of molecular hydrogen with alkali and TM-doped naphthalene was studied by Kalamse et al. and they concluded that a Li-functionalized naphthalene system is not as efficient as Ti-functionalized naphthalene for hydrogen adsorption.16
Some investigations have been carried out on boron-substituted complexes from a hydrogen storage point of view.17–26,28–32 Srinivasu et al. showed that light metal atoms can bind strongly to the MOF after boron substitution which is useful to overcome the metal aggregation crisis.17 Kalamse et al. suggested that Ti-functionalized boron-substituted naphthalene is more promising than Li-functionalized boron-substituted naphthalene for hydrogen storage by means of both ADMP-MD simulations and electronic structure calculations.18 Their thermochemistry calculations show that boron substitution in naphthalene enhanced the Gibbs free energy corrected H2 adsorption energy of the Ti-decorated boron-substituted naphthalene complex. Park et al. found that the adsorption energy of a Li atom with boron-substituted graphene is larger than the cohesive energy of Li.19 Wang et al. proposed a thermally stable 3D boron-substituted graphene-interconnected framework (B-GIF) and found that boron substitution in the GIF enhances the Li binding energy.20 Lee et al. suggested that clustering of calcium can be overcome at the zigzag edge and boron-substituted armchair edge of graphene.21 Rao et al. found that porous graphene and porous graphene nanotubes can be made electron deficient by boron substitution.22 This enhances the electrostatic interaction between the metal and substrate and subsequently enhances the binding energy of the metal to the substrate. Lu et al. found strong interaction between Li or Ca and the substrate after boron substitution.23 Zou et al. substituted boron for carbon in a covalent organic framework without affecting its stability and obtained a H2 uptake capacity higher than 6.5 wt% for all Sc, Ti and Ca doping cases.24 Deshmukh et al. found that H2 uptake capacity of C6H6Sc, C6H6Ti and C6H6V complexes gets enhanced by about 1.5 wt% after substitution of two boron atoms in a benzene ring.25 Firlej et al. showed that the larger size of the boron than the carbon atom significantly affects the H2 adsorption on graphene.26 Ariharan et al. studied the hydrogen storage on boron-substituted carbon materials and reported the effects of boron doping, carbonization temperature, and functional groups.28 Sankaran and Viswanathan reported the hydrogen storage capacity of boron-substituted carbon nanotubes as 2 wt%.29 Lin et al. studied the hydrogen storage capacity of boron-substituted and nitrogen-substituted nano carbon materials doped with alkaline earth metal ions using ab initio calculations.30 Tokarev et al. studied the hydrogen storage capacity of boron-substituted graphene decorated with potassium metal atoms using density functional theory.31 Nachimuthu et al. proposed a solid-state material consisting of a combination of both transition and alkaline earth metal atoms decorated on a graphene surface.32
It is clear that boron substitution not only affects the binding energy of the metal atom to the substrate but also the H2 storage capacity. It will be interesting to study whether the position and number of boron atom substitution also affects the binding energy of the metal atom to the substrate and hydrogen uptake capacity of the OM complex. To our knowledge, the effect of the number and position of boron atom substitution on the hydrogen storage capacity of OM complexes has not been considered yet. Most of the metal-decorated ring structures considered so far for hydrogen storage are CnHn rings in which the number of carbon atoms is equal to the number of hydrogen atoms in a ring. In this work we have considered two five-membered fused ring structures i.e. pentalene (C8H6) with metal doping for hydrogen storage. In this complex the number of hydrogen atoms is less than the number of carbon atoms. Since metal doping creates active centres for the H2 adsorption, selecting a proper metal for doping is a vital task. Since lithium (Li) is a lightweight alkali metal and has low cohesive energy, it is selected for doping on the C8H6 complex. Some efforts have been made earlier on Li-decorated systems for hydrogen storage theoretically as well as experimentally.33–36 Aramini et al. proposed a synthetic strategy based on the solid-state reaction of C60 with lithium-transition metals alloys and obtained transition metal-decorated lithium intercalated fullerides with improved hydrogen storage properties.33 They obtained an 18% increase of the H2 uptake capacity as compared to that of pure Li6C60. Xu et al. showed that 14 H2 molecules can be adsorbed on Li-decorated graphyne with 13 wt% hydrogen uptake capacity and an adsorption energy of 0.19 eV per H2 using first principles plane wave calculations.34 Seenithurai et al. using density functional theory calculations obtained 7.26 wt% H2 uptake capacity of Li-decorated double carbon vacancy graphene with a binding energy of 0.26 eV per H2.35 Li et al. reported the H2 uptake capacity of two Li-decorated silicene as 6.35 wt% with an average H2 binding energy in the range of 0.32 to 0.17 eV.36
The aim of this work is first to study the H2 uptake capacity of a Li-doped pentalene (C8H6Li2) complex using an ab initio and density functional theory (DFT) method. Then we studied its H2 uptake capacity after two and four boron atom substitution at different positions to see whether the H2 uptake of the C8H6Li2 complex improves by substituting two and four C with B atoms. We have dealt with two different configurations of two and four boron-substituted pentalene in which the position of the boron atoms has changed. The two structures of two boron-substituted Li-doped pentalene are labelled as TBP1 and TBP2. The two configurations of four boron-substituted Li-doped pentalene are labelled as FBP1 and FBP2. These structures are shown in Fig. 1. The effect of boron substitution on the binding energy per Li to the substrate is obtained. The H2 adsorption energies are calculated at a different temperature and pressure to find a suitable temperature and pressure range over which H2 adsorption on these complexes is energetically favourable. The H2 desorption temperature for all the complexes is also predicted. Molecular dynamics simulations have been used to obtain the relation between the adsorption energy and number of H2 molecules remaining adsorbed during the simulations.
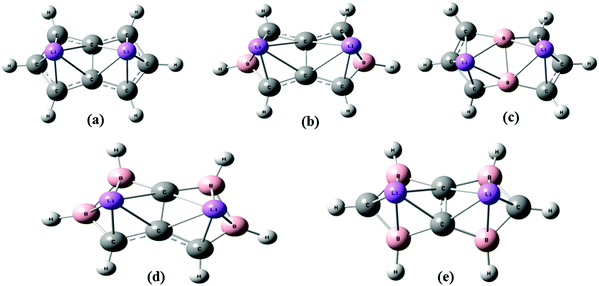 | ||
| Fig. 1 Optimized geometry of (a) C8H6Li2, (b) TBP1, (c) TBP2, (d) FBP1, and (e) FBP2 at the MP2/6-311++g** level. | ||
2. Computational details
We employ the second-order Møller–Plesset (MP2) method37,38 in combination with the valence double diffuse and polarization function (6-311++G**) basis set for optimization of all geometries. We have also used the DFT method with M06,39 M06-2X,39 and wB97XD40 functionals and the 6-311++g** basis set to compare the results from MP2 and DFT calculations.The averaged adsorption energy without zero point energy correction (ΔE), with zero point energy correction (ΔEZPE), and with Gibbs free energy correction (ΔEG) is calculated as:
| ΔE = {E[OM] + (n × E[H2]) − E[OM(nH2)]}/n | (1) |
| ΔEZPE = {EZPE[OM] + (n × EZPE[H2]) − EZPE[OM(nH2)]}/n | (2) |
| ΔEG = {EG[OM] + (n × EG[H2]) − EG[OM(nH2)]}/n | (3) |
Molecular dynamics (MD) simulations were performed with atom centered density matrix propagation (ADMP). The time step (Δt) of 0.2 fs was set for the ADMP-MD simulations and the temperature was maintained using the velocity scaling method. Optimized geometries from the electronic structure calculations have been used as a starting structure for the ADMP-MD simulations. Various interaction energies in H2-adsorbed complexes are obtained using the many-body analysis approach.41–47 All calculations are carried out with the Gaussian suite of programs.48
3. Results and discussion
Two H2 molecules are adsorbed on the unsubstituted C8H6Li2 complex with a H2 uptake capacity of 3.36 wt% which is lower than the target set by the U. S. Department of energy (DOE) i.e. 5.5 wt% by 2020. Fig. 2(a) shows the optimized geometry of the C8H6Li2(2H2) complex at the MP2/6-311++g** level. To improve the H2 uptake capacity of the C8H6Li2 complex we have considered the substitution effect in pentalene. Since boron is electron deficient and has a lower atomic weight than carbon, it is used as a substitute for a carbon atom. The C8H6 structure becomes electron deficient after boron substitution which is useful to increase the binding energy of Li to the substrate. Two and four carbon atoms of the C8H6Li2 complex are replaced by boron atoms. For each case two different structures are obtained by substituting boron atoms at different positions as shown in Fig. 1.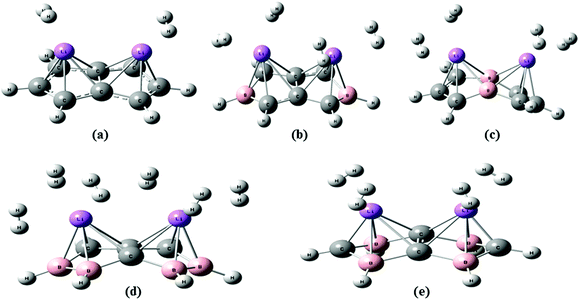 | ||
| Fig. 2 Optimized geometry of (a) C8H6Li2(2H2), (b) TBP1(4H2), (c) TBP2(4H2), (d) FBP1(6H2), and (e) FBP2(4H2) at the MP2/6-311++g** level. | ||
The TBP1 and TBP2 complexes can adsorb four H2 molecules each with 6.63 wt% H2 uptake capacity. In the case of four boron atom substitution, the number of H2 molecules adsorbed on FBP1 and FBP2 is different. The FBP1 and FBP2 complexes can adsorb six and four H2 molecules respectively with a respective H2 uptake capacity of 9.81 and 6.76 wt%. We also tried to adsorb six hydrogen molecules on the FBP2 complex, but they do not get adsorbed and go away from the Li atom during the optimization. The different number of H2 molecules being adsorbed on the FBP1 and FBP2 complexes may be due to the charge on the Li atom. The NBO charges for all the five complexes before H2 adsorption are presented in Table 1. For the C8H6Li2 complex the average charge on Li is positive and is found to be 0.71. In the case of the TBP1 and TBP2 complexes there is no large difference in the average charge on the Li atom and it is found to be 0.81 and 0.89 respectively. So on both the TBP1 as well as TBP2 complexes, the same number of hydrogen molecules gets adsorbed. On the other hand, for the FBP1 and FBP2 complexes a significant difference in the average charge on the Li atom is observed. For the former it is found to be 0.17 and it adsorbs six H2 molecules. For the latter the average charge on Li is found to be 0.81 and it adsorbs four H2 molecules. The optimized geometries of the TBP1(4H2), TBP2(4H2), FBP1(6H2), and FBP2(4H2) complexes are shown in Fig. 2. All the optimized structures have no soft vibrational modes indicating that all these complexes before as well as after H2 adsorption are quantum mechanically stable.
| Complex | C | C (at fusion) | B | Li | H2 |
|---|---|---|---|---|---|
| C8H6Li2(2H2) | −0.36(−0.38) | −0.17(−0.19) | — | 0.57(0.71) | 0.57 |
| TBP1(4H2) | −0.36(−0.38) | −0.07(−0.09) | 0.11(0.52) | 0.19(0.81) | 0.13 |
| TBP2(4H2) | −0.53(−0.53) | — | 0.12(0.09) | 0.85(0.89) | 0.12 |
| FBP1(6H2) | −0.80(−0.28) | −0.45(−0.004) | 0.26(0.01) | 0.53(0.17) | 0.19 |
| FBP2(4H2) | −1.12(−1.14) | −0.62(−0.67) | 0.49(0.46) | 0.55(0.81) | 0.13 |
The boron substitution energy (ΔEsub) is calculated for the TBP1, TBP2, FBP1, and FBP2 complexes. The negative boron substitution energies obtained for all these complexes indicate that the substitution of B for C is an endothermic process. The boron substitution energy increases with an increase in the concentration of boron. The energy required to substitute four boron atoms is about twice that for the two boron atoms. The energy required to substitute the same number of boron atoms in two different structures is also different. The TBP2 complex requires 0.82 eV more energy for two boron atom substitution than that for the TBP1 complex whereas the FBP1 complex requires 0.54 eV more energy for four boron atom substitution than that for the FBP2 complex.
The binding energy of the Li atom to the C8H6 substrate is found to be 2.78 eV per Li. This binding energy of Li is higher than its cohesive energy (1.63 eV per Li).49 The binding energy of Li to the TBP1 complex is found to be 2.49 eV per Li. This Li binding energy is a little lower than that for the C8H6 complex, but still higher than the cohesive energy of Li. The binding energy of Li to the TBP2, FBP1, and FBP2 complexes is found to be 3.81, 3.71, and 3.74 eV per Li respectively. These Li binding energies are significantly higher than that for the C8H6 complex. It indicates that boron substitution in the C8H6 complex enhances the binding energy of Li to the substrate. The binding energies of Li to the C8H6, TBP1, TBP2, FBP1, and FBP2 complexes after H2 adsorption are found to be 2.77, 2.38, 3.79, 3.70, and 3.62 eV per Li respectively. These energies are a little lower than the Li binding energies to the substrate before H2 adsorption. This indicates that the bond between Li and the substrate becomes a little weak after H2 adsorption. Since the binding energy of Li atoms to all the substrates is higher than the cohesive energy of Li, clustering of the Li atom is not observed before as well as after H2 adsorption. Fig. 3 shows that in all the boron-substituted complexes, new electronic states appear above the highest occupied molecular orbitals which make them electron deficient and help in increasing the binding energy of Li to the substrate.
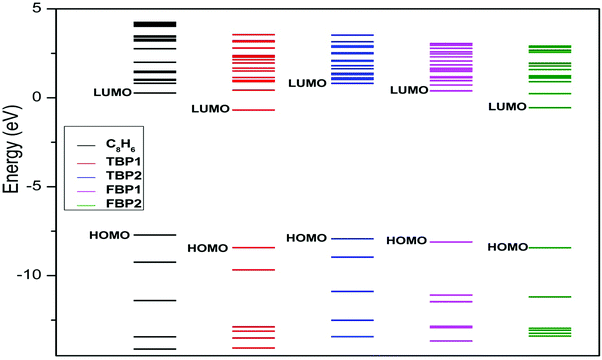 | ||
| Fig. 3 Introduction of new states after boron substitution in pentalene at the MP2/6-311++g** level. | ||
The different bond lengths in Li-doped pentalene and Li-doped boron-substituted pentalene before and after maximum H2 adsorption are tabulated in Table 2. Two B atoms in the TBP2 complex are substituted at the fusion of the two rings and the B–B bond length is found to be 1.86 Å. It is longer than the B–B bond length in the FBP1 complex i.e. 1.77 Å where the two B atoms do not lie at the fusion of the two rings. In all the Li-doped boron-substituted complexes the B–B bond lengths are longer than the C–C and C–B bond lengths. There is no significant change observed for the C–C, C–B, and B–B bond lengths in all the complexes after H2 adsorption. The C–Li bonds become longer after boron substitution and remain longer even after maximum H2 adsorption than those for the unsubstituted C8H6Li2 complex. Metal clustering can be avoided by boron substitution in an OM complex. This is confirmed not only by an increase in the Li binding energy with the substrate but also from the Li–Li distances in boron-substituted complexes. The Li–Li distance is significantly longer in all the boron-substituted complexes before as well as after maximum H2 adsorption than that for the C8H6Li2 complex. It also helps in avoiding the Li atom clustering.
| Complex | Bond length (Å) | ||||||
|---|---|---|---|---|---|---|---|
| C–C | C–B | B–B | C–Li | B–Li | Li–Li | Li–H2 | |
| C8H6Li2 | 1.43–1.47 | — | — | 2.04–2.2 | — | 2.84 | — |
| C8H6Li2(2H2) | 1.43–1.47 | — | — | 2.04–2.25 | — | 2.81 | 1.98–2.00 |
| TBP1 | 1.41–1.56 | 1.56 | — | 2.11–2.42 | 2.19 | 3.38 | — |
| TBP1(4H2) | 1.38–1.54 | 1.51–1.61 | — | 2.10–2.43 | 2.22 | 3.08 | 2.00–2.05 |
| TBP2 | 1.39–1.46 | 1.49–1.55 | 1.86 | 2.13–2.19 | 2.17–2.29 | 3.10 | — |
| TBP2(4H2) | 1.39–1.46 | 1.49–1.55 | 1.84 | 2.14–2.19 | 2.19–2.29 | 3.12 | 2.16–2.21 |
| FBP1 | 1.42–1.56 | 1.53 | 1.77 | 2.18–2.29 | 2.25–2.29 | 3.09 | — |
| FBP1(6H2) | 1.42–1.55 | 1.52–1.53 | 1.76 | 2.21–2.38 | 2.28–2.32 | 3.15 | 2.11–2.38 |
| FBP2 | 1.43 | 1.51–1.62 | — | 2.03–2.39 | 2.20–2.39 | 3.08 | — |
| FBP2(4H2) | 1.43 | 1.51–1.62 | — | 2.03–2.41 | 2.22–2.40 | 3.02 | 2.06–2.09 |
Different Li–H2 distances are observed for these complexes which show the different H2 adsorption strengths of these complexes. In the C8H6Li2(2H2) complex, hydrogen molecules lie at 1.98–2.00 Å from Li. H2 molecules are adsorbed at longer distances in all the Li-doped boron-substituted complexes than those for the C8H6Li2 complex. It indicates stronger interaction between H2 molecules and the C8H6Li2 complex than between H2 molecules and Li-doped boron-substituted complexes. Among all the Li-doped boron-substituted complexes, longer Li–H2 distances are found for the TBP2(4H2) and FBP1(6H2) complexes than those for the TBP1(4H2) and FBP2(4H2) complexes respectively. This shows weaker binding of H2 molecules with the TBP2 and FBP1 complexes than that with the TBP1 and FBP2 complexes respectively.
Table 1 shows the average NBO charges for the C8H6Li2, TBP1, TBP2, FBP1, and FBP2 complexes before and after H2 adsorption at the MP2/6-311++g** level of theory. The charges mentioned on the H2 molecules are the total charges on adsorbed H2 molecules. In the case of the C8H6Li2(2H2) complex each Li atom gets −0.14 charge from H2 molecules and C atoms after H2 adsorption. In the H2 adsorbed TBP1 complex, each C atom donates about −0.49 charge to the B and Li atom and becomes more positive after H2 adsorption. The Li atom accepts −0.62 charge from the C atom as well as H2 molecules. There is no major charge transfer observed in the TBP2 complex after H2 adsorption. For all the complexes, the negative charge on each Li atom increases after H2 adsorption except for the FBP1 complex in which it decreases after H2 adsorption. The greater elongation in the Li–Li bond length in the FBP1 complex after H2 adsorption also indicates the charge transfer from Li atoms to the H2 molecules. In the H2 adsorbed FBP1 complex, the Li and B atoms donate about −0.36 and −0.25 charge respectively to the C atoms after H2 adsorption. In the FBP2 complex no significant change in charge on C and B is observed after H2 adsorption. H2 molecules donate negative charges and become positive in all the complexes. But for the FBP1 complex the amount of charge transfer between the H2 molecules and Li is more than that for the remaining complexes.
Table 3 shows the averaged H2 adsorption energies without (ΔE) and with (ΔEZPE) zero point energy correction and with Gibbs free energy correction (ΔEG) for all the complexes calculated with the MP2 method and DFT with different exchange and correlation functionals with the 6-311++g** basis set. The ΔE values for all the complexes are within the range of 0.10–0.24 eV using different levels at room temperature and 1 atm pressure. There is no large variation in the ΔE values obtained using different levels. The negative ΔEG values for all the complexes indicate that formation of all these complexes at room temperature is endothermic i.e. thermodynamically unfavourable. The contribution of ΔEZPE to ΔE is not ignorable. Comparison of the H2 interaction energies obtained using the DFT functional that includes (wB97XD) empirical dispersion with those obtained using the DFT functional which does not include (wB97X) empirical dispersion shows that there is a negligible difference in the H2 adsorption energies obtained from these two DFT functionals for all the structures.
| Energy | Method (eV) | Complex | ||||
|---|---|---|---|---|---|---|
| C8H6(2H2) | TBP1(4H2) | TBP2(4H2) | FBP1(6H2) | FBP2(4H2) | ||
| ΔE | MP2 | 0.17 | 0.15 | 0.10 | 0.10 | 0.14 |
| M06 | 0.16 | 0.24 | 0.13 | 0.15 | 0.16 | |
| M06-2X | 0.16 | 0.15 | 0.12 | 0.13 | 0.15 | |
| wB97X | 0.16 | 0.16 | 0.12 | 0.13 | 0.14 | |
| wB97XD | 0.19 | 0.19 | 0.13 | 0.15 | 0.16 | |
| ΔEG | MP2 | −0.13 | −0.20 | −0.21 | −0.22 | −0.19 |
| M06 | −0.24 | −0.24 | −0.27 | −0.28 | −0.20 | |
| M06-2X | −0.20 | −0.23 | −0.25 | −0.26 | −0.20 | |
| wB97X | −0.17 | −0.19 | −0.21 | −0.19 | −0.18 | |
| wB97XD | −0.17 | −0.17 | −0.21 | −0.19 | −0.13 | |
| ΔEZPE | MP2 | 0.09 | 0.05 | 0.03 | 0.02 | 0.05 |
| M06 | 0.02 | 0.11 | 0.00 | 0.01 | 0.01 | |
| M06-2X | 0.04 | 0.01 | 0.00 | 0.02 | 0.02 | |
| wB97X | 0.06 | 0.06 | 0.03 | 0.05 | 0.05 | |
| wB97XD | 0.09 | 0.08 | 0.05 | 0.08 | 0.08 | |
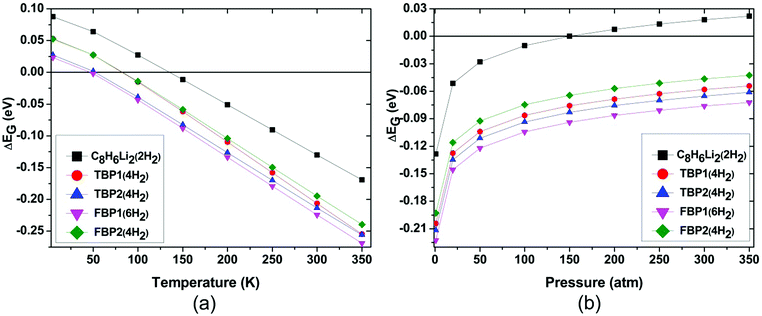
H2 adsorption on all these complexes is energetically unfavourable at ambient conditions. To find out the pressure and temperature range over which H2 adsorption on these complexes is thermodynamically favourable, ΔEG is calculated at various temperatures and pressures for all the complexes. To get the pressure-dependent ΔEG, the temperature was kept constant at 298.15 K and the pressure was varied from 1 to 350 bar. For obtaining temperature-dependent H2 adsorption energies, the pressure was kept constant at 1 atm and the temperature was varied from 5 to 350 K. The temperature and pressure dependence of the ΔEG values for all the complexes is shown in Fig. 4 at the MP2/6-31l++g** level. The temperature-dependent ΔEG values show that the H2 adsorption on the C8H6Li2, TBP1, TBP2, FBP1, and FBP2 complexes is favourable below 120, 75, 45, 45, and 75 K respectively at 1 atm pressure. The pressure-dependent ΔEG values show that H2 adsorption on the C8H6Li2 complex is favourable at room temperature and above 150 bar pressure but it is not favourable for other complexes even at high pressure. The temperature- and pressure-dependent H2 adsorption energies are in agreement with the structural parameters. H2 molecules in the C8H6Li2(2H2) complex are adsorbed at shorter distances than the remaining complexes. It results in more positive H2 adsorption energies for the C8H6Li2(2H2) complex than for the remaining four complexes.
The effect of temperature and pressure on the ΔEG values is also studied at the different levels of theory used here for all the H2 adsorbed complexes. Fig. 5 and 6 show the temperature- and pressure-dependent ΔEG values respectively for the H2 adsorbed complexes obtained at different levels of theory. It can be seen that H2 adsorption is energetically unfavourable at room temperature and 1 atm pressure at all the levels of theory used here. However it is favourable at low temperature for all the complexes at all the levels of theory. From Fig. 5 it can be seen that as we go to a lower temperature, the ΔEG values become more positive. As can be seen from Fig. 6, H2 adsorption on all these complexes is energetically unfavourable even at very high pressure and room temperature except for the C8H6Li2(2H2) complex for which it is favourable above 150 atm pressure at room temperature.
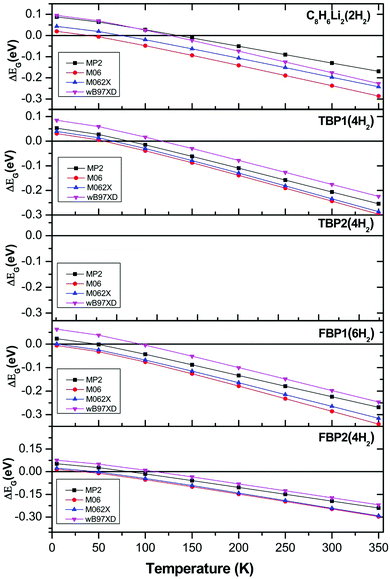 | ||
| Fig. 5 Temperature-dependent Gibbs free energy corrected H2 adsorption energies for C8H6Li2(2H2), TBP1(4H2), TBP2(4H2), FBP1(6H2), and FBP2(4H2) complexes at different levels. | ||
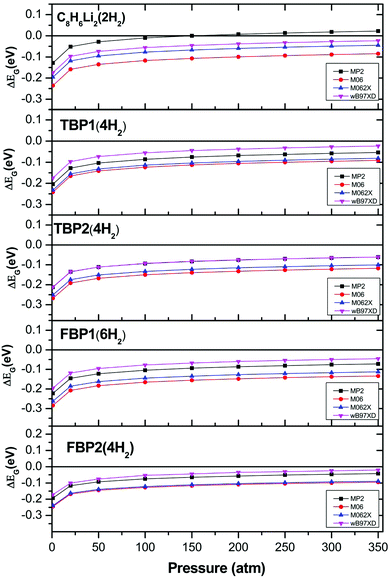 | ||
| Fig. 6 Pressure-dependent Gibbs free energy corrected H2 adsorption energies for C8H6Li2(2H2), TBP1(4H2), TBP2(4H2), FBP1(6H2), and FBP2(4H2) complexes at different levels. | ||
Selected vibrational modes for all the complexes before and after H2 molecule adsorption using the MP2/6-311++g** level are presented in Table 4. For the C8H6Li2 complex, the symmetric and asymmetric stretching modes between the C8H6 ring and Li atom are blue-shifted after adsorption of H2 molecules. This indicates that the Li–C8H6 bonds in the C8H6Li2 complex become weak after H2 adsorption. There is no large change observed in the ring-Li symmetric and asymmetric stretching modes in the TBP1, TBP2, FBP1, and FBP2 complexes after H2 adsorption. It indicates that Li remains strongly bound to the TBP1, TBP2, FBP1, and FBP2 complexes even after adsorption of a maximum of H2 molecules. Most of the Li–H2 symmetric and Li–H2 asymmetric stretching modes in the H2 adsorbed TBP1, TBP2, FBP1, and FBP2 complexes are red-shifted compared to the corresponding modes in the vibrational spectrum of the C8H6Li2(2H2) complex. In all the complexes the H–H stretching frequencies of the adsorbed H2 molecules are red-shifted compared to that for the isolated H2 molecule. On comparing the H–H stretching frequencies in H2 adsorbed TBP1 and TBP2 complexes, it can be seen that all the H–H stretching frequencies for the former are lower than those for the latter. This is consistent with the Li–H2 distances. It is observed that the H2 molecules are adsorbed at a longer distance from Li for TBP2 than that for TBP1. Similar results are also obtained for FBP1 and FBP2. Since all the H2 molecules are adsorbed at a longer distance from Li in FBP1 than that for the FBP2, the H–H stretching frequencies for the H2 adsorbed FBP2 complex are lower than those for the H2 adsorbed FBP1 complex.
| Assignments | C8H6Li2(2H2) | TBP1(4H2) | TBP2(4H2) | FBP1(6H2) | FBP2(4H2) |
|---|---|---|---|---|---|
| Ring-Li stretch(sym) | 605(574) | 528(532) | 499(495) | 463(465) | 589(589) |
| Ring-Li stretch(asym) | 612(560) | 530(514) | 494(488) | 425(434) | 551(548) |
| Li–H2 stretch(sym) | 353/398 | 266/287/387/404 | 219/225/297/301 | 229/244/272/279/280/358 | 363/377/397/410 |
| Li–H2 stretch(asym) | 750/751 | 730/731/838/840 | 616/617/633/634 | 539/576/590/606/628/705 | 691/694/714/715 |
| H–H stretch | 4413/4414(4530) | 4283/4286/4402/4403(4530) | 4436/4437/4445.4/4445.5(4530) | 4394/4424/4436/4439/4445/4448(4530) | 4413/4413/4414/4416(4530) |
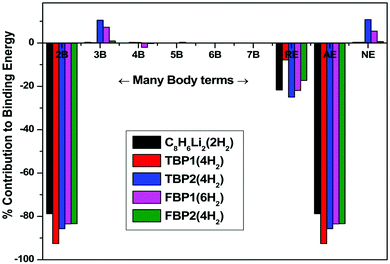
The different interaction energies in the H2 adsorbed complexes are studied at the MP2/6-311++G** level using the many-body analysis approach and tabulated in Table 5. Contribution from many-body energies, additive energy, non-additive energy, and relaxation energy to the binding energy of the respective H2 adsorbed complexes is shown in Fig. 7. The total two-body interaction energy has a major contribution to the binding energy of the respective complex for all the H2 adsorbed complexes as shown in Fig. 7. All two-body interaction energies of the OM complex and hydrogen molecules are attractive in nature. The interaction energy depends upon the distances between the OM and H2 molecules. H2 molecules adsorbed at shorter distances from the OM complex have more attractive interaction energy than that for the H2 molecules adsorbed at longer distances. Since both the H2 molecules in the C8H6Li2(2H2) complex are adsorbed at nearly equal distance, there is no difference in their interaction energy with the OM complex. The two-body interaction energies for the TBP1(4H2) complex are found to be more attractive than those for the TBP2(4H2) complex. The Hi–Hj two-body interactions are repulsive and found to be negligible as compared to the OM–Hi interactions for all the complexes. Here Hi and Hj represent the ith and jth adsorbed hydrogen molecule respectively in a complex. The total two-body energy has 78.82, 92.59, 85.71, 83.55, and 83.39% attractive contribution to the binding energy of the C8H6Li2(2H2), TBP1(4H2), TBP2(4H2), FBP1(6H2), and FBP2(4H2) complexes respectively.
| Interaction terms | Energy (kcal mol−1) | ||||
|---|---|---|---|---|---|
| C8H6Li2(2H2) | TBP1(4H2) | TBP2(4H2) | FBP1(6H2) | FBP2(4H2) | |
| Two-body energies | |||||
| OM–H1 | −3.14 | −2.88 | −2.22 | −1.87 | −2.75 |
| OM–H2 | −3.14 | −2.88 | −2.22 | −3.39 | −2.75 |
| OM–H3 | — | −3.88 | −1.97 | −1.85 | −2.72 |
| OM–H4 | — | −3.88 | −1.97 | −2.31 | −2.72 |
| OM–H5 | — | — | — | −1.97 | — |
| OM–H6 | — | — | — | −1.78 | — |
| H1–H2 | 0.00 | 0.00 | 0.00 | 0.00 | 0.00 |
| H1–H3 | — | −0.02 | 0.20 | 0.00 | 0.13 |
| H1–H4 | — | 0.22 | 0.00 | 0.24 | −0.01 |
| H1–H5 | — | — | — | 0.00 | — |
| H1–H6 | — | — | — | 0.25 | — |
| H2–H3 | — | 0.22 | 0.00 | 0.19 | 0.00 |
| H2–H4 | — | −0.02 | 0.20 | 0.23 | 0.13 |
| H2–H5 | — | — | — | 0.02 | — |
| H2–H6 | — | — | — | 0.05 | — |
| H3–H4 | — | 0.00 | 0.00 | 0.00 | 0.05 |
| H3–H5 | — | — | — | 0.24 | — |
| H3–H6 | — | — | — | 0.00 | — |
| H4–H5 | — | — | — | 0.00 | — |
| H4–H6 | — | — | — | 0.1 | — |
| H5–H6 | — | — | — | 0.05 | — |
| Three-body energies | |||||
| OM–H1–H2 | 0.03 | 0.04 | 0.04 | 0.05 | 0.03 |
| OM–H1–H3 | — | −0.01 | 0.47 | 0.04 | −0.05 |
| OM–H1–H4 | — | −0.08 | 0.00 | −0.14 | 0.03 |
| OM–H1–H5 | — | — | — | 0.01 | — |
| OM–H1–H6 | — | — | — | −0.04 | — |
| OM–H2–H3 | — | −0.08 | 0.00 | −0.11 | 0.03 |
| OM–H2–H4 | — | −0.01 | 0.47 | 0.17 | −0.05 |
| OM–H2–H5 | — | — | — | 0.19 | — |
| OM–H2–H6 | — | — | — | 0.29 | — |
| OM–H3–H4 | — | 0.15 | 0.01 | 0.06 | 0.12 |
| OM–H3–H5 | — | — | — | 0.27 | — |
| OM–H3–H6 | — | — | — | 0.03 | — |
| OM–H4–H5 | — | — | — | 0.06 | — |
| OM–H4–H6 | — | — | — | 0.40 | — |
| OM–H5–H6 | — | — | — | −0.14 | — |
| H1–H2–H3 | — | 0.00 | 0.00 | 0.00 | 0.00 |
| H1–H2–H4 | — | 0.00 | 0.00 | 0.00 | 0.00 |
| H1–H2–H5 | — | — | — | 0.00 | — |
| H1–H2–H6 | — | — | — | 0.00 | — |
| H1–H3–H4 | — | 0.00 | 0.00 | 0.00 | 0.00 |
| H1–H3–H5 | — | — | — | 0.00 | — |
| H1–H3–H6 | — | — | — | 0.00 | — |
| H1–H4–H5 | — | — | — | 0.00 | — |
| H1–H4–H6 | — | — | — | −0.04 | — |
| H1–H5–H6 | — | — | — | 0.00 | — |
| H2–H3–H4 | — | 0.00 | 0.00 | 0.00 | 0.00 |
| H2–H3–H5 | — | — | — | −0.03 | — |
| H2–H3–H6 | — | — | — | 0.00 | — |
| H2–H4–H5 | — | — | — | 0.00 | — |
| H2–H4–H6 | — | — | — | −0.03 | — |
| H2–H5–H6 | — | — | — | −0.01 | — |
| H3–H4–H5 | — | — | — | 0.00 | — |
| H3–H4–H6 | — | — | — | 0.00 | — |
| H3–H5–H6 | — | — | — | 0.00 | — |
| H4–H5–H6 | — | — | — | 0.00 | — |
| Four-body energies | |||||
| OM–H1–H2–H3 | — | 0.00 | 0.01 | −0.02 | −0.01 |
| OM–H1–H2–H4 | — | 0.00 | 0.01 | −0.03 | −0.01 |
| OM–H1–H2–H5 | — | — | — | 0.00 | — |
| OM–H1–H2–H6 | — | — | — | −0.04 | — |
| OM–H1–H3–H4 | — | 0.02 | 0.00 | −0.02 | −0.01 |
| OM–H1–H3–H5 | — | — | — | 0.00 | — |
| OM–H1–H3–H6 | — | — | — | −0.01 | — |
| OM–H1–H4–H5 | — | — | — | 0.00 | — |
| OM–H1–H4–H6 | — | — | — | 0.01 | — |
| OM–H1–H5–H6 | — | — | — | 0.00 | — |
| OM–H2–H3–H4 | — | 0.02 | 0.00 | −0.07 | −0.01 |
| OM–H2–H3–H5 | — | — | — | 0.01 | — |
| OM–H2–H3–H6 | — | — | — | −0.03 | — |
| OM–H2–H4–H5 | — | — | — | −0.04 | — |
| OM–H2–H4–H6 | — | — | — | −0.05 | — |
| OM–H2–H5–H6 | — | — | — | 0.03 | — |
| OM–H3–H4–H5 | — | — | — | −0.01 | — |
| OM–H3–H4–H6 | — | — | — | −0.01 | — |
| OM–H3–H5–H6 | — | — | — | −0.02 | — |
| OM–H4–H5–H6 | — | — | — | −0.02 | — |
| H1–H2–H3–H4 | — | 0.00 | 0.00 | 0.00 | 0.00 |
| H1–H2–H3–H5 | — | — | — | 0.00 | — |
| H1–H2–H3–H6 | — | — | — | 0.00 | — |
| H1–H2–H4–H5 | — | — | — | 0.00 | — |
| H1–H2–H4–H6 | — | — | — | 0.00 | — |
| H1–H2–H5–H6 | — | — | — | 0.00 | — |
| H1–H3–H4–H5 | — | — | — | 0.00 | — |
| H1–H3–H4–H6 | — | — | — | 0.00 | — |
| H1–H3–H5–H6 | — | — | — | 0.00 | — |
| H1–H4–H5–H6 | — | — | — | 0.00 | — |
| H2–H3–H4–H5 | — | — | — | 0.00 | — |
| H2–H3–H4–H6 | — | — | — | 0.00 | — |
| H2–H4–H5–H6 | — | — | — | 0.00 | — |
| Five-body energies | |||||
| OM–H1–H2–H3–H4 | — | 0.00 | 0.00 | 0.01 | — |
| OM–H1–H2–H3–H5 | — | — | — | 0.00 | — |
| OM–H1–H2–H3–H6 | — | — | — | 0.01 | — |
| OM–H1–H2–H4–H5 | — | — | — | 0.00 | — |
| OM–H1–H2–H4–H6 | — | — | — | 0.00 | — |
| OM–H1–H2–H5–H6 | — | — | — | 0.00 | — |
| OM–H1–H3–H4–H5 | — | — | — | 0.00 | — |
| OM–H1–H3–H4–H6 | — | — | — | 0.00 | — |
| OM–H1–H3–H5–H6 | — | — | — | 0.00 | — |
| OM–H1–H4–H5–H6 | — | — | — | 0.00 | — |
| OM–H2–H3–H4–H5 | — | — | — | 0.01 | — |
| OM–H2–H3–H4–H6 | — | — | — | 0.01 | — |
| OM–H2–H3–H5–H6 | — | — | — | −0.01 | — |
| OM–H2–H4–H5–H6 | — | — | — | 0.00 | — |
| OM–H3–H4–H5–H6 | — | — | — | 0.01 | — |
| H1–H2–H3–H4–H5 | — | — | — | 0.00 | — |
| H1–H2–H3–H4–H6 | — | — | — | 0.00 | — |
| H1–H2–H3–H5–H6 | — | — | — | 0.00 | — |
| H1–H2–H4–H5–H6 | — | — | — | 0.00 | — |
| H1–H3–H4–H5–H6 | — | — | — | 0.00 | — |
| H2–H3–H4–H5–H6 | — | — | — | 0.00 | — |
| Six-body energies | |||||
| OM–H1–H2–H3–H4–H5 | — | — | — | 0.00 | — |
| OM–H1–H2–H3–H4–H6 | — | — | — | 0.00 | — |
| OM–H1–H2–H3–H5–H6 | — | — | — | 0.00 | — |
| OM–H1–H2–H4–H5–H6 | — | — | — | 0.00 | — |
| OM–H1–H3–H4–H5–H6 | — | — | — | 0.00 | — |
| OM–H2–H3–H4–H5–H6 | — | — | — | 0.00 | — |
| Seven-body energies | |||||
| OM–H1–H2–H3–H4–H5–H6 | — | — | — | 0.00 | — |
| Sum of 2-body | −6.29 | −13.12 | −7.98 | −11.83 | −10.65 |
| Sum of 3-body | 0.03 | 0.02 | 0.98 | 1.03 | 0.12 |
| Sum of 4-body | — | 0.04 | 0.02 | −0.29 | −0.04 |
| Sum of 5-body | — | −0.001 | 0.002 | 0.05 | 0.00 |
| Sum of 6-body | — | — | — | −0.01 | — |
| Sum of 7-body | — | — | — | 0.00 | — |
| Relaxation energy | −1.73 | −1.11 | −2.33 | −3.11 | −2.21 |
| Additive energy | −6.29 | −13.12 | −7.98 | −11.83 | −10.65 |
| Non-additive energy | 0.03 | 0.054 | 1.003 | 0.78 | 0.09 |
| Binding energy | −7.98 | −14.17 | −9.31 | −14.16 | −12.77 |
| BSSE corrected total energy (Hartree) | −324.88 | −300.70 | −300.70 | −276.52 | −274.23 |
A negligible contribution from the total three-body interaction energies to the binding energy of the respective complexes is found except for the TBP2(4H2) and FBP1(6H2) complexes. There is a 10.53% and 7.27% repulsive contribution to the binding energy of the former and latter respectively. The total four-body, total five-body, total six-body, and total seven-body energies have negligible contribution to the binding energy of the respective complex. The relaxation energy also contributes significantly to the binding energy of the respective complex. Its contribution is found to be 21.68, 7.83, 25.03, 21.96, and 17.31% for the C8H6Li2(2H2), TBP1(4H2), TBP2(4H2), FBP1(6H2), and FBP2(4H2) complexes respectively.
The gap between the highest occupied molecular orbital (HOMO) and lowest unoccupied molecular orbital (LUMO) gives information about the chemical stability of the complex. The HOMO–LUMO gap is calculated for the C8H6Li2, TBP1, TBP2, FBP1, and FBP2 complexes and it is found that boron-substituted complexes are more stable than the C8H6Li2 complex. On comparing the TBP1 and TBP2 complexes, TBP1 is more stable than the TBP2 complex. The FBP2 complex is more stable than the FBP1 complex. This is in agreement with what is observed for the boron substitution energy. The complex with a lower boron substitution energy is more stable and shows less further reactivity. This also affects the binding energy of Li.
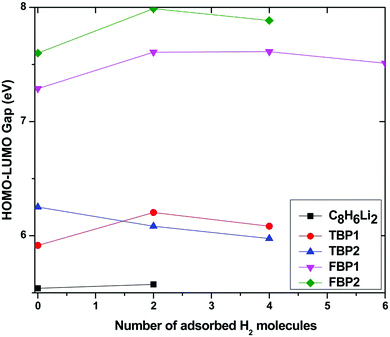
The HOMO–LUMO gap is calculated for all the Li-doped complexes with successive addition of H2 molecules and is plotted in Fig. 8. Fig. 8 shows that the HOMO–LUMO gap increases with an increase in the number of adsorbed H2 molecules for all the complexes except for the TBP2 complex. This shows that the stability of all the complexes increases with an increase in the number of adsorbed H2 molecules for all the complexes except for the TBP2 complex, for which it decreases little by about 0.2 eV. The HOMO–LUMO gap of the C8H6Li2 complex is smaller than that for the boron-substituted complexes. It is found that the HOMO–LUMO gap also depends upon the number of substituted boron atoms. The HOMO–LUMO gap for the four boron-substituted complexes is higher than that for the two boron-substituted complexes. H2 adsorbed boron-substituted complexes are more stable than the H2 adsorbed C8H6Li2 complex. The HOMO–LUMO gap suggests that the FBP2 complex is most stable among all the complexes before as well as after maximum H2 adsorption.
H2 desorption temperatures from the C8H6Li2, TBP1, TBP2, FBP1, and FBP2 complexes are roughly calculated using the Van't Hoff equation50 written in terms of ΔEZPE at the MP2/6-311++g** level:
TD = (ΔEZPE/kB)(ΔS/R − ln![[thin space (1/6-em)]](https://www.rsc.org/images/entities/char_2009.gif) P)−1 P)−1 | (4) |
ADMP-MD simulations are performed at 300 K where the ΔEG values are negative and also at a lower temperature T at which the ΔEG values are positive for each complex. Optimized geometries of the respective H2 adsorbed complexes have been used to initialize the ADMP-MD simulations. Fig. 9–13 show the trajectories of H2 molecules from the Li atom for all the complexes. Fig. 9(a) shows that at 300 K and 1 atm pressure, out of two adsorbed H2 molecules one oscillates at a distance of 2–5 Å from Li and the other flies away within 0.1 ps from the C8H6Li2 complex. Similarly in Fig. 10(a), 11(a), 12(a), and 13(a), not all the H2 molecules remain adsorbed on the respective complex during the ADMP-MD simulations at 300 K since at 300 K and 1 atm pressure, adsorption of H2 molecules is endothermic on each of these complexes with negative ΔEG values. To see whether all the adsorbed H2 molecules in the initial structure of the ADMP-MD simulations remain adsorbed during the simulations when the ΔEG values are positive, we have performed ADMP-MD simulations at a lower temperature at which the ΔEG values are positive. Fig. 9(b), 10(b), 11(b), 12(b), and 13(b) show the trajectories of H2 molecules from Li atoms during the ADMP-MD simulations for the C8H6Li2(2H2), TBP1(4H2), TBP2(4H2), FBP1(6H2), and FBP2(4H2) complexes respectively at a lower temperature where the ΔEG values are positive. It indicates that when the ΔEG values obtained using electronic structure calculations are positive at temperature T, all the H2 molecules remain adsorbed during the ADMP-MD simulations performed at the same temperature T. The distance between Li and the adsorbed H2 molecules oscillates during the ADMP-MD simulations performed at temperature T with positive ΔEG values in the range of 1.82–2.62, 1.9–2.32, 2.05–2.27, 2.05–2.6, and 1.97–2.12 Å for the C8H6Li2(2H2), TBP1(4H2), TBP2(4H2), FBP1(6H2), and FBP2(4H2) complexes respectively.
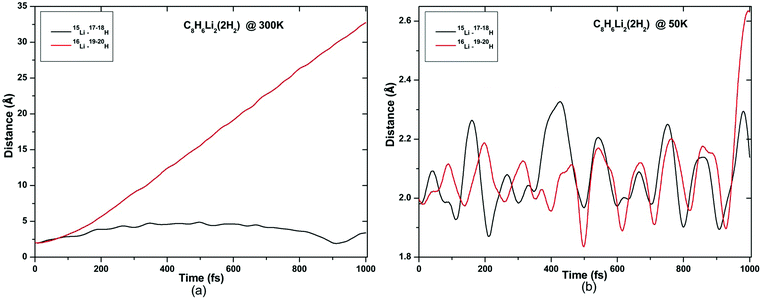 | ||
| Fig. 9 Trajectories of time evolution of distance of H2 molecules from respective Li atom in C8H6Li2(2H2) complex at (a) 300 K and (b) 50 K. | ||
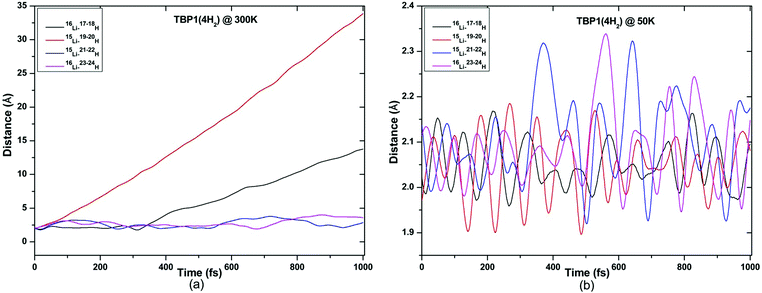 | ||
| Fig. 10 Trajectories of time evolution of distance of H2 molecules from respective Li atom in TBP1(4H2) complex at (a) 300 K and (b) 50 K. | ||
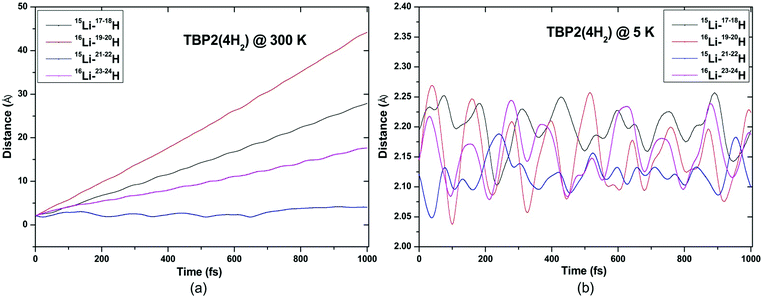 | ||
| Fig. 11 Trajectories of time evolution of distance of H2 molecules from respective Li atom in TBP2(4H2) complex at (a) 300 K and (b) 5 K. | ||
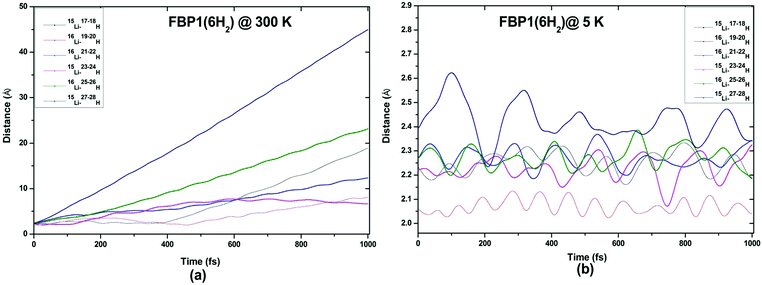 | ||
| Fig. 12 Trajectories of time evolution of distance of H2 molecules from respective Li atom in FBP1(6H2) complex at (a) 300 K and (b) 5 K. | ||
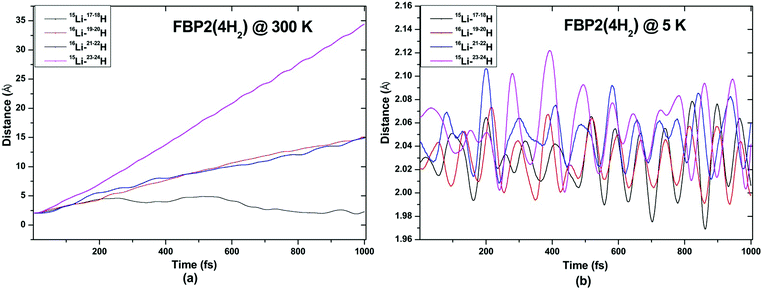 | ||
| Fig. 13 Trajectories of time evolution of distance of H2 molecules from respective Li atom in FBP2(4H2) complex at (a) 300 K and (b) 5 K. | ||
As compared to other small Li-decorated complexes, the binding energy of the Li atom to pentalene and boron-substituted pentalene is found to be higher than the cohesive energy of Li in bulk. The binding energies of Li to boron-substituted pentalene are significantly higher than that for pentalene. Boron substitution in pentalene has enhanced the binding energy of Li to the substrate. The binding energies of Li to pentalene and boron-substituted pentalene before as well as after the maximum amount of H2 molecule adsorption remain higher than the cohesive energy of Li which helps to avoid the clustering of Li atoms in these complexes before as well as after H2 adsorption. Boron substitution in pentalene has not only helped in avoiding the clustering of Li atoms but also increased the H2 uptake capacity as new electronic states appeared above the highest occupied molecular orbitals in the boron-substituted complexes which make them electron deficient.
4. Conclusions
The second-order Møller–Plesset method and DFT with different exchange and correlation functionals are used with the 6-311++G** basis set to study Li-doped boron-substituted and unsubstituted pentalene. The H2 uptake capacity for the C8H6Li2 complex is found to be 3.36 wt% which is lower than the U. S. DOE target by 2020. The H2 uptake capacity of the C8H6Li2 complex is enhanced after boron substitution and further enhanced with an increase in boron concentration. The H2 uptake capacity of the C8H6Li2 complex is enhanced by 3.27 wt% after two boron atom substitution. In the case of four boron atom-substituted complexes, the H2 uptake capacity is increased by 6.45 wt% and 3.6 wt% for the two different structures considered. A different number of hydrogen molecules gets adsorbed on the two different structures of Li-doped four boron atom-substituted pentalene, which may be due to the different charge on the Li atom in these two complexes. The lower H2 desorption temperature obtained for the boron-substituted complexes indicates weak interaction of H2 molecules with these complexes compared to the C8H6Li2 complex. The chemical stability of the H2 adsorbed complexes is confirmed from the HOMO–LUMO gap which is found to be greater than 5 eV for all the complexes. All the complexes considered here are not suitable for hydrogen storage at ambient conditions but can be used for hydrogen storage at lower temperature in the range of 45 to 120 K. This is also confirmed from the ADMP-molecular dynamics simulations.References
- S. Singh, S. Jain, P. S. Venkateswaran, A. K. Tiwari, M. R. Nouni, J. K. Pandey and S. Goel, Renewable Sustainable Energy Rev., 2015, 51, 623 CrossRef CAS.
- S. I. Orimo, Y. Nakamori, J. R. Eliseo, A. Züttel and C. M. Jensen, Chem. Rev., 2007, 107, 4111 CrossRef CAS PubMed.
- C. M. Brown, Y. Liu and D. A. Neumann, Pramana, 2008, 71, 755 CrossRef CAS.
- Y. J. Choi, J. W. Lee, J. H. Choi and J. K. Kang, Appl. Phys. Lett., 2008, 92, 173102 CrossRef.
- P. Tavhare, V. Kalamse, R. Krishna, E. Titus and A. Chaudhari, Int. J. Hydrogen Energy, 2016, 41, 11730 CrossRef CAS.
- V. Kalamse, N. Wadnerkar and A. Chaudhari, J. Phys. Chem. C, 2010, 114, 4704 CAS.
- V. Kalamse, N. Wadnerkar, A. Deshmukh and A. Chaudhari, Int. J. Hydrogen Energy, 2012, 37, 3727 CrossRef CAS.
- P. Tavhare, V. Kalamse, R. Bhosale and A. Chaudhari, Struct. Chem., 2015, 26, 823 CrossRef CAS.
- B. Kiran, A. K. Kandalam and P. Jena, J. Chem. Phys., 2006, 124, 224703 CrossRef PubMed.
- A. I. Martinez, J. Nano Res., 2009, 5, 113 CrossRef CAS.
- N. Wadnerkar, V. Kalamse and A. Chaudhari, Int. J. Hydrogen Energy, 2011, 36, 664 CrossRef CAS.
- C. S. Liu, Phys. Rev. B: Condens. Matter Mater. Phys., 2009, 79, 245419 CrossRef.
- P. F. Weck and T. J. Dhilip Kumar, J. Chem. Phys., 2007, 126, 094703 CrossRef PubMed.
- J. H. Guo, W. D. Wu and H. Zhang, Struct. Chem., 2009, 20, 1107 CrossRef CAS.
- I. V. Bodrenko, A. V. Avdeenkov, D. G. Bessarabov, A. V. Bibikov, A. V. Nikolaev, M. D. Taran and E. V. Tkalya, J. Phys. Chem. C, 2012, 116, 25286 CAS.
- V. Kalamse, N. Wadnerkar and A. Chaudhari, Energy, 2013, 49, 469 CrossRef CAS.
- K. Srinivasu and S. K. Ghosh, J. Phys. Chem. C, 2011, 115, 16984 CAS.
- V. Kalamse, R. Krishna, E. Titus and A. Chaudhari, Int. J. Hydrogen Energy, 2016, 41, 11723 CrossRef CAS.
- H. L. Park, S. C. Yi and Y. C. Chung, Int. J. Hydrogen Energy, 2010, 35, 3583 CrossRef CAS.
- Y. Wang, Z. Meng, Y. Liu, D. You, K. Wu, J. Lv, X. Wang, K. Deng, D. Rao and R. Lu, Appl. Phys. Lett., 2015, 106, 063901 CrossRef.
- H. Lee, J. Ihm, M. L. Cohen and S. G. Louie, Nano Lett., 2010, 10, 793 CrossRef CAS PubMed.
- D. Rao, R. Lu, Z. Meng, Y. Wang, Z. Lu, Y. Liu, X. Chen, E. Kan, C. Xiao, K. Deng and H. Wu, Int. J. Hydrogen Energy, 2014, 39, 18966 CrossRef CAS.
- R. Lu, D. Rao, Z. Lu, J. Qian, F. Li, H. Wu, Y. Wang, C. Xiao, K. Deng, E. Kan and W. Deng, J. Phys. Chem. C, 2012, 116, 21291 CAS.
- X. Zou, G. Zhou, W. Duan, K. Choi and J. Ihm, J. Phys. Chem. C, 2010, 114, 13402 CAS.
- A. Deshmukh, R. Konda, V. Kalamse and A. Chaudhari, RSC Adv., 2016, 6, 47033 RSC.
- L. Firlej, B. Kuchta, C. Wexler and P. Pfeifer, Adsorption, 2009, 15, 312 CrossRef CAS.
- S. Satyapal, J. Petrovic, C. Read, G. Thomas and G. Ordaz, Catal. Today, 2007, 120, 246 CrossRef CAS.
- A. Ariharan, B. Viswanathan and V. Nandhakumar, Int. J. Hydrogen Energy, 2016, 41, 3527 CrossRef CAS.
- M. Sankaran and B. Viswanathan, Carbon, 2007, 45, 1628 CrossRef CAS.
- I. H. Lin, Y. J. Tong, H. J. Hsieh, H. W. Huang and H. T. Chen, Int. J. Energy Res., 2016, 40, 230 CrossRef CAS.
- A. Tokarev, A. V. Avdeenkov, H. Langmi and D. G. Bessarabov, Int. J. Energy Res., 2015, 39, 524 CrossRef CAS.
- S. Nachimuthu, P. J. Lai, E. G. Leggesse and J. C. Jiang, Sci. Rep., 2015, 5, 16797 CrossRef CAS PubMed.
- M. Aramini, C. Milanese, D. Pontiroli, M. Gaboardi, A. Girella, G. Bertoni and M. Riccò, Int. J. Hydrogen Energy, 2014, 39, 2124 CrossRef CAS.
- B. Xu, X. L. Lei, G. Liu, M. S. Wu and C. Y. Ouyang, Int. J. Hydrogen Energy, 2014, 39, 17104 CrossRef CAS.
- S. Seenithurai, R. K. Pandyan, S. Vinod Kumar, C. Saranya and M. Mahendran, Int. J. Hydrogen Energy, 2014, 39, 11016 CrossRef CAS.
- F. Li, C. W. Zhang, H. X. Luan and P. J. Wang, J. Nanopart. Res., 2013, 15, 1972 CrossRef.
- C. Møller and M. S. Plesset, Phys. Rev., 1934, 46, 0618 CrossRef.
- M. Head-Gordon, J. A. Pople and M. J. Frisch, Chem. Phys. Lett., 1988, 153, 503 CrossRef CAS.
- Y. Zhao and D. G. Truhlar, Theor. Chem. Acc., 2008, 120, 215 CrossRef CAS.
- J. D. Chai and M. Head-Gordon, Phys. Chem. Chem. Phys., 2008, 10, 6615 RSC.
- S. S. Xantheas, J. Chem. Phys., 1994, 100, 7523 CrossRef CAS.
- S. S. Xantheas, J. Chem. Phys., 1995, 102, 4505 CrossRef CAS.
- A. Chaudhari, P. K. Sahu and S. L. Lee, J. Chem. Phys., 2004, 120, 170 CrossRef CAS PubMed.
- A. Chaudhari and S. L. Lee, J. Chem. Phys., 2004, 120, 7464 CrossRef CAS PubMed.
- P. Valiron and I. Mayer, Chem. Phys. Lett., 1997, 275, 46 CrossRef CAS.
- A. Kulkarni, V. Ganesh and S. R. Gadre, J. Chem. Phys., 2004, 121, 5043 CrossRef CAS PubMed.
- R. Konda, V. Kalamse, A. Deshmukh and A. Chaudhari, RSC Adv., 2015, 5, 99207 RSC.
- M. J. Frisch, G. W. Trucks, H. B. Schlegel, G. E. Scuseria, M. A. Robb and J. R. Cheeseman, et al., Gaussian 09, Revision A.1, Gaussian Inc., Wallingford, CT, 2009 Search PubMed.
- K. Charles, Introduction to Solid State Physics, John Wiley & Sons, Inc., Hoboken, NJ, 8th edn, 2005 Search PubMed.
- W. Zhou, T. Yildirim, E. Durgun and S. Ceraci, Phys. Rev. B: Condens. Matter Mater. Phys., 2007, 76, 085434 CrossRef.
- D. R. Lide, CRC Handbook of Chemistry and Physics, New York, 75th edn, 1994 Search PubMed.
| This journal is © the Owner Societies 2017 |

