
 Open Access Article
 This Open Access Article is licensed under a
 Creative Commons Attribution 3.0 Unported Licence
Protein sensing and discrimination using highly functionalised ruthenium(II) tris(bipyridyl) protein surface mimetics in an array format†
Sarah H.
Hewitt
ab and
Andrew J.
Wilson
 *ab
*ab
aSchool of Chemistry, University of Leeds, Woodhouse Lane, Leeds, LS2 9JT, UK. E-mail: a.j.wilson@leeds.ac.uk
bAstbury Centre for Structural Molecular Biology, University of Leeds, Woodhouse Lane, Leeds, LS2 9JT, UK
First published on 1st November 2017
Abstract
Ruthenium(II) tris(bipyridyl) protein surface mimetics are used in an array format to sense and discriminate proteins including therapeutically relevant targets, hDM2 and MCL-1, using linear discriminant analysis (LDA).
The sensing and detection of proteins represents an ongoing challenge in life sciences research. The ability to detect the presence or absence of a disease relevant protein and/or changes in protein levels in response to environmental stimuli are key objectives in healthcare diagnostics and proteomic approaches to understanding signalling pathways.1–3 Whilst antibodies and related reagents have proven enormously powerful in this regard,4–6 synthetic reagents are attractive in terms of their stability and cost-effective preparation. However, the identification of synthetic molecules that recognise their targets with high affinity and selectivity is challenging. Within the broad supramolecular chemistry community, considerable emphasis has been placed on the exploitation of synthetic molecules in an array format, using their composite response to achieve sensing in a manner that reproduces the process by which smell is distinguished.7–12 Porphyrins,13,14 peptidomimetic libraries,15,16 nanoparticles17–19 and multifunctional small molecules20,21 have all been used for protein sensing. In the current manuscript we demonstrate for the first time that protein surface mimetics22 based on a ruthenium(II) tris(bipyridyl) scaffold can be exploited in an array format to sense and discriminate proteins through solvent exposed surface recognition. Crucially, using linear discriminant analyses (LDA) we show that sensing is enhanced when the ruthenium(II) tris(chelates) are employed alongside a second fluorescent reporter, that the discriminatory power of such arrays can be dominated by the response of a single protein analyte, and finally that the approach can be used to sense the structurally similar proteins hDM2 and MCL-1 (similar MW, pI and protein-binding interfaces), both of which are important anticancer targets.23,24
We and others recently described a family of highly functionalised ruthenium(II) tris(bipyridyl) co-ordination complexes that act as high affinity and selective ligands for protein surfaces.25–28 These cell penetrant29 protein surface mimetics have been shown to recognise cytochrome c (cyt c) with high affinity through enthalpically and entropically favourable electrostatic interactions,30 to inhibit the protein–protein interactions of cyt c,30 to selectively destabilize the protein target,31 and, to exhibit affinity for the protein target in a manner dependent on the geometry at the metal centre.28
Using a series of eight of these ruthenium(II) complexes (1–8, Fig. 1a) we initially constructed a sensing array to attempt the discrimination of six proteins (lysozyme, α-chymotrypsin (α-ChT), horse cyt c, papain, RNAse A and bovine serum albumin (BSA)), selected to provide a diversity of shape, size and surface charge (Fig. 1b). The array produced a fingerprint luminescence response (Fig. 2a, b and see ESI,† Fig. S1) allowing us to perform statistical analyses to interpret the data. Discriminant analysis (DA) has been widely used in the literature to reduce the dimensionality of array data,32 using matrix techniques to calculate combinations of the original data which describe the maximum between class variation while keeping the within class variation at a minimum. Despite the pronounced luminescence response of the array, in this configuration only cyt c could be discriminated from the other proteins using 2D (not shown) or 3D LDA (Fig. 3a) whilst the remaining proteins occupied a similar region in the LDA plots.
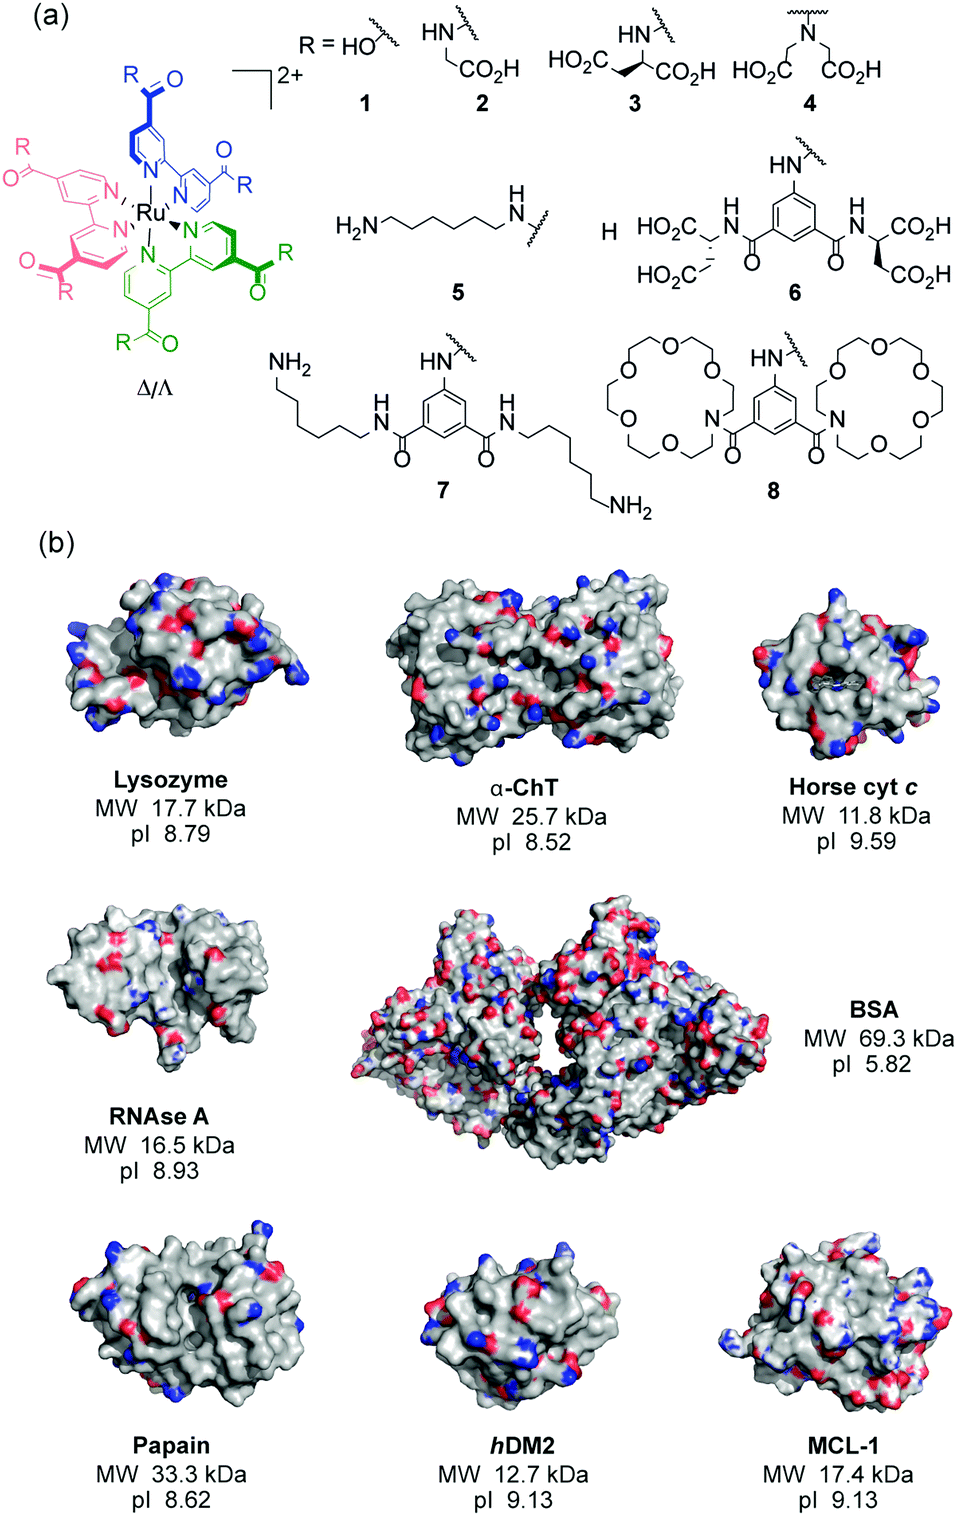 | ||
| Fig. 1 Structures used in this work (a) ruthenium(II) tris(bipyridyl) co-ordination complexes 1–8 (b) X-ray crystal structures with molecular weights (MW) and isoelectric points (pI) of the proteins; lysozyme (PDB ID: 1LYZ), α-chymotrypsin (α-ChT) (PDB ID: 4CHA), horse cyt c (1HRC), papain (PDB ID: 9PAP), RNAse A (PDB ID: 5RSA), bovine serum albumin (BSA) (PDB ID: 3V03), hDM2 (PDB ID: 4GH7) and MCL-1 (PDB ID: 5C3F) (electrostatic potential is shown with basic (blue) and acidic (red) regions). | ||
 | ||
| Fig. 2 Fingerprint luminescence responses for the six different proteins on incubation for 2 and 20 h, (a and b) with Ru2+(bpy)3 surface mimetics 1–8 alone, monitoring Ru2+(bpy)3 MLCT, λem = 630 nM; (c and d) with Ru2+(bpy)3 surface mimetics 1–8 and FITC-NOXA-B peptide, monitoring Ru2+(bpy)3 MLCT, λem = 630 nM; (e and f) with Ru2+(bpy)3 surface mimetics 1–8 and FITC-NOXA B peptide monitoring fluorescein emission, λem = 530 nm (λexc = 467 nm, 5 mM sodium phosphate, pH 7.5, 2.5 μM Ru(bpy)3 surface mimetics 1–8, 0.5 μM FITC-NOXA-B peptide and 10 μM protein, readings using fixed filters). | ||
 | ||
| Fig. 3 LDA analyses of Ru(bpy)3 surface mimetic 1–6 array (a) LDA of Ru2+(bpy)3 complex array with six target proteins fails to achieve clustering of the analytes (each panel represents a different orientation of the data to aid visualization), (b) LDA of Ru2+(bpy)3 surface mimetic array in the presence of FITC-NOXA B, combining 2 hour and 20 hour incubation data allows separation of all six proteins into distinct clusters (c) 95% confidence ellipsoids for the data shown in (b) and (d) 80% confidence ellipsoids for the data shown in (b), (conditions as given in Fig. 2). | ||
To improve the discriminatory power of the array we added a second fluorescent reporter molecule, specifically a fluorescein labelled BCL-2 family BH3 sequence (a NOXA-B variant) similar to those we have used33 in studies on constrained peptides. In such a configuration, the speciation of the array is such that the interactome is considerably more complex with the possibility for interaction between both sensing fluorophores, and, potentially different responses to the analyte with the fluorophores alone or in combination, (a more detailed explanation for the sensing mechanisms and diagram is given in the ESI,† Fig. S2). Given the proximity of the emission maxima for fluorescein and the MLCT luminescence of the Ru2+(bpy)3 core and the significantly greater quantum yield of the former, we tested different concentrations of the two sensing elements to establish conditions at which both could be observed in a standard emission spectrum (see ESI,† Fig. S3). This established working conditions of 2.5 μM Ru2+(bpy)3 surface mimetic, 0.5 μM FITC-NOXA and 10 μM protein as optimal for further array studies. An array with six different proteins was performed, and the luminescence of the Ru2+(bpy)3 surface mimetics and the FITC-NOXA B peptide recorded and compared to that without the protein present. This gave rise to differential responses (see ESI,† Fig. S4) from the Ru2+(bpy)3 surface mimetics and FITC-NOXA B peptide, resulting in a fingerprint-like response (Fig. 2c and d). Subtly different responses were obtained after 2 and 20 h incubation and these were exploited in subsequent LDA analyses.
Considering only 2 discriminants which define the most between class variation, the proteins cluster for the 2 h, 20 h and combined 2 and 20 h data sets (see ESI,† Fig. S5). In all three cases cyt c always appears as a distinct separate cluster. After 2 hours the BSA cluster is defined and after 20 hours the RNAse A cluster is defined, in combination discrimination of both these proteins is achieved however significant overlap between α-ChT and lysozyme, and, papain and lysozyme was observed. To separate these protein clusters further, 3D LDA was used, assigning the 3rd linear discriminant (F3) as the z axis. The 3D LDA, again, shows the clearly defined clusters and provides separation for all proteins (Fig. 3b). In comparison to the original Ru2+(bpy)3 array where only discrimination of cyt c could be achieved (Fig. 3a), addition of the second fluorophore, allowed for much better discrimination. Using the 3D LDA it is possible to plot confidence ellipsoids, in order to graphically represent the confidence with which it is possible to discriminate the different proteins. At the 95% confidence level (Fig. 3c) the confidence ellipsoids are clearly distinct but have some overlap meaning the analytes are not fully discriminated. However, at the 80% confidence level (Fig. 3d), the ellipsoids are distinct from each other, showing significant discrimination at this level. Future studies will focus on the use of a more diverse set of Ru2+(bpy)3 surface mimetics and the acquisition of additional replicates, to build on these preliminary results; these are anticipated to narrow the clustering of the data.
Having had success in discriminating commercially available proteins, more therapeutically interesting proteins were added to the array, namely MCL-1 and hDM2, noting the NOXA-B peptide is a known to bind MCL-1 (at low nM Kd and detected using fluorescence anisotropy/not intensity as is the case here). 3D LDA was performed with the data obtained for all the proteins, again showing clearly defined clusters for each protein, however there was considerable overlap of the clusters for some proteins, with all the data for 5 of the proteins (BSA, α-ChT, papain, RNAse A and lysozyme) existing on a straight line parallel to the z (F3) axis (see ESI,† Fig. S6). Using other discriminants (the fourth and fifth discriminants) to replace the first, second or both discriminants, still did not separate these clusters. From these LDA analyses, cyt c was consistently well separated from the remaining proteins; implying that the discrimination of cyt c from the other analytes dominates in the LDA. We therefore hypothesised that it might be possible to discriminate the remaining proteins if the cyt c data were removed from the analysis. Indeed upon removing this data it was observed that the clusters were more effectively separated. Considering the 80% confidence ellipsoids (Fig. 4b, see ESI,† Fig. S7 for 95% confidence ellipsoids) these data cluster MCL-1 and hDM2 as distinct from the other proteins, but partially overlapping each other. The ellipsoids for both of these proteins are quite large whereas the remaining protein confidence ellipsoids are much smaller but show some overlap at both the 80% and 95% confidence levels. This possibly reflects the similar charge, shape and molecular weight of the two targets (Fig. 1b).
 | ||
| Fig. 4 LDA analyses of Ru2+(bpy)3 surface mimetic 1–8 array (a) LDA of Ru2+(bpy)3 complex array with eight target proteins achieves clustering of the analytes (each panel represents a different orientation of the data to aid visualization), (b) 80% confidence ellipsoids for the data shown in (a), (conditions as given in Fig. 2). | ||
In conclusion, the current article establishes the proof-of-concept that ruthenium(II) tris(bipyridyl) protein surface mimetics can be used for protein sensing and discrimination using an array based approach, notably for therapeutically important protein targets such as hDM2 and MCL-1. Our results underscore potential limitations of the approach more generally in discriminating proteins, firstly in that a single fluorescent reporter may not prove sufficient and secondly in that an ascendant analyte may limit overall discriminatory resolution (as observed for cyt c with the expanded set of proteins). In the former case, addition of a second (fluorescent) receptor component leads to improved resolution and may be an advantageous alternative to the synthesis of sensors bearing multiple responsive units,19,21,34,35 whilst in the latter case discriminatory power can be restored by removal of the outlying analyte. Our own future studies will centre on developing a greater diversity of function within the ruthenium(II) tris(bipyridyl) protein surface mimetics and using derivatives with brighter luminescence so as to allow the selective discrimination and identification of closely related protein targets at lower concentrations. This will be a key step in establishing the potential of this approach for protein detection in complex fluids (e.g. serum) and diagnosis.
This work was supported by the Engineering and Physical Sciences Research Council [EP/L504993/1, EP/F039069, EP/F038712 and EP/N013573/1]. We would like to thank Kat Horner for synthesis of the NOXA-B peptide, Kirstin Spence for expression of hDM2 and MCL-1 and Georgina Pleasance for initial synthesis of complex 4.
Conflicts of interest
There are no conflicts to declare.Notes and references
- W. Kolch and A. Pitt, Nat. Rev. Cancer, 2010, 10, 618 CrossRef CAS PubMed.
- C. Choudhary and M. Mann, Nat. Rev. Mol. Cell Biol., 2010, 11, 427 CrossRef CAS PubMed.
- N. Rifai, M. A. Gillette and S. A. Carr, Nat. Biotechnol., 2006, 24, 971 CrossRef CAS PubMed.
- C. Tiede, R. Bedford, S. J. Heseltine, G. Smith, I. Wijetunga, R. Ross, D. AlQallaf, A. P. E. Roberts, A. Balls, A. Curd, R. E. Hughes, H. Martin, S. R. Needham, L. C. Zanetti-Domingues, Y. Sadigh, T. P. Peacock, A. A. Tang, N. Gibson, H. Kyle, G. W. Platt, N. Ingram, T. Taylor, L. P. Coletta, I. Manfield, M. Knowles, S. Bell, F. Esteves, A. Maqbool, R. K. Prasad, M. Drinkhill, R. S. Bon, V. Patel, S. A. Goodchild, M. Martin-Fernandez, R. J. Owens, J. E. Nettleship, M. E. Webb, M. Harrison, J. D. Lippiat, S. Ponnambalam, M. Peckham, A. Smith, P. K. Ferrigno, M. Johnson, M. J. McPherson and D. C. Tomlinson, eLife, 2017, 6, e24903 Search PubMed.
- C. Wingren, in Proteogenomics, ed. Á. Végvári, Springer International Publishing, Cham, 2016, p. 163 Search PubMed.
- C. A. K. Borrebaeck, Immunol. Today, 2000, 21, 379 CrossRef CAS PubMed.
- A. T. Wright and E. V. Anslyn, Chem. Soc. Rev., 2006, 35, 14 RSC.
- S. L. Wiskur, P. N. Floriano, E. V. Anslyn and J. T. McDevitt, Angew. Chem., Int. Ed., 2003, 42, 2070 CrossRef CAS PubMed.
- J. F. Folmer-Andersen, M. Kitamura and E. V. Anslyn, J. Am. Chem. Soc., 2006, 128, 5652 CrossRef CAS PubMed.
- P. Anzenbacher, F. Li and M. A. Palacios, Angew. Chem., Int. Ed., 2012, 51, 2345 CrossRef CAS PubMed.
- T. Minami, N. A. Esipenko, A. Akdeniz, B. Zhang, L. Isaacs and P. Anzenbacher, J. Am. Chem. Soc., 2013, 135, 15238 CrossRef CAS PubMed.
- E. G. Shcherbakova, T. Minami, V. Brega, T. D. James and P. Anzenbacher, Angew. Chem., Int. Ed., 2015, 54, 7130 CrossRef CAS PubMed.
- L. Baldini, A. J. Wilson, J. Hong and A. D. Hamilton, J. Am. Chem. Soc., 2004, 126, 5656 CrossRef CAS PubMed.
- H. Zhou, L. Baldini, J. Hong, A. J. Wilson and A. D. Hamilton, J. Am. Chem. Soc., 2006, 128, 2421 CrossRef CAS PubMed.
- A. T. Wright, M. J. Griffin, Z. Zhong, S. C. McCleskey, E. V. Anslyn and J. T. McDevitt, Angew. Chem., Int. Ed., 2005, 44, 6375 CrossRef CAS PubMed.
- A. T. Wright, N. Y. Edwards, E. V. Anslyn and J. T. McDevitt, Angew. Chem., Int. Ed., 2007, 46, 8212 CrossRef CAS PubMed.
- C.-C. You, O. R. Miranda, B. Gider, P. S. Ghosh, I.-B. Kim, B. Erdogan, S. A. Krovi, U. H. F. Bunz and V. M. Rotello, Nat. Nanotechnol., 2007, 2, 318 CrossRef CAS PubMed.
- M. De, S. Rana, H. Akpinar, O. R. Miranda, R. R. Arvizo, U. H. F. Bunz and V. M. Rotello, Nat. Chem., 2009, 1, 461 CrossRef CAS PubMed.
- N. D. B. Le, G. Yesilbag Tonga, R. Mout, S.-T. Kim, M. E. Wille, S. Rana, K. A. Dunphy, D. J. Jerry, M. Yazdani, R. Ramanathan, C. M. Rotello and V. M. Rotello, J. Am. Chem. Soc., 2017, 139, 8008 CrossRef CAS PubMed.
- L. Motiei, Z. Pode, A. Koganitsky and D. Margulies, Angew. Chem., Int. Ed., 2014, 53, 9289 CrossRef CAS PubMed.
- J. Hatai, L. Motiei and D. Margulies, J. Am. Chem. Soc., 2017, 139, 2136 CrossRef CAS PubMed.
- S. H. Hewitt and A. J. Wilson, Chem. Commun., 2016, 52, 9745 RSC.
- K. K. Hoe, C. S. Verma and D. P. Lane, Nat. Rev. Drug Discovery, 2014, 13, 217 CrossRef PubMed.
- D. Nhu, G. Lessene, D. C. S. Huang and C. J. Burns, MedChemComm, 2016, 7, 778 RSC.
- H. Takashima, S. Shinkai and I. Hamachi, Chem. Commun., 1999, 2345 RSC.
- J. Ohkanda, R. Satoh and N. Kato, Chem. Commun., 2009, 6949 RSC.
- J. Muldoon, A. E. Ashcroft and A. J. Wilson, Chem. – Eur. J., 2010, 16, 100 CrossRef CAS PubMed.
- M. H. Filby, J. Muldoon, S. Dabb, N. C. Fletcher, A. E. Ashcroft and A. J. Wilson, Chem. Commun., 2011, 47, 559 RSC.
- S. J. Turrell, M. H. Filby, A. Whitehouse and A. J. Wilson, Bioorg. Med. Chem. Lett., 2012, 22, 985 CrossRef CAS PubMed.
- S. H. Hewitt, M. H. Filby, E. Hayes, L. T. Kuhn, A. P. Kalverda, M. E. Webb and A. J. Wilson, ChemBioChem, 2017, 18, 223 CrossRef CAS PubMed.
- A. J. Wilson, J. R. Ault, M. H. Filby, H. I. A. Philips, A. E. Ashcroft and N. C. Fletcher, Org. Biomol. Chem., 2013, 11, 2206–2212 CAS.
- S. Stewart, M. A. Ivy and E. V. Anslyn, Chem. Soc. Rev., 2014, 43, 70 RSC.
- J. A. Miles, D. J. Yeo, P. Rowell, S. Rodriguez-Marin, C. M. Pask, S. L. Warriner, T. A. Edwards and A. J. Wilson, Chem. Sci., 2016, 7, 3694 RSC.
- D. Margulies, C. E. Felder, G. Melman and A. Shanzer, J. Am. Chem. Soc., 2007, 129, 347 CrossRef CAS PubMed.
- Y. Nissinkorn, N. Lahav-Mankovski, A. Rabinkov, S. Albeck, L. Motiei and D. Margulies, Chem. – Eur. J., 2015, 21, 15981 CrossRef CAS PubMed.
Footnote |
| † Electronic supplementary information (ESI) available. See DOI: 10.1039/c7cc06175g |
| This journal is © The Royal Society of Chemistry 2017 |