Combined bortezomib-based chemotherapy and p53 gene therapy using hollow mesoporous silica nanospheres for p53 mutant non-small cell lung cancer treatment
Chun
Li
ab,
Junqing
Hu
a,
Wenyao
Li
*c,
Guosheng
Song
*ad and
Jia
Shen†
*b
aState Key Laboratory for Modification of Chemical Fibers and Polymer Materials, College of Materials Science and Engineering, Donghua University, Shanghai 201620, China. E-mail: songguosheng12@sina.com
bState Key Laboratory of Molecular Biology; Institute of Biochemistry and Cell Biology, Shanghai Institutes for Biological Sciences, Chinese Academy of Sciences, Shanghai 200031, China. E-mail: zshen@sbpdiscovery.org
cSchool of Material Engineering, Research & Development Center for Key Technologies of Intelligent Ultra-Intense Laser Processing Equipments, Shanghai University of Engineering Science, Shanghai 201620, China. E-mail: liwenyao314@gmail.com
dInstitute of Functional Nano and Soft Materials Collaborative Innovation Center of Suzhou Nano Science and Technology, Soochow University, Suzhou, Jiangsu 215123, China
First published on 8th November 2016
Abstract
Our previous work reported the development of a proteasome inhibitor, bortezomib (BTZ) encapsulated hollow mesoporous silica nanospheres (HMSNs), as a biocompatible and effective drug-delivery system for non-small cell lung cancer (NSCLC) therapy. Then we found that the tumor-suppressing effect of BTZ or HMSNs-BTZ was compromised in p53 null/mutant NSCLC. In fact, clinical studies have shown a beneficial effect of the combination of p53 gene therapy and chemotherapeutic drugs for patients with NSCLC, especially with the p53 gene null/mutant NSCLC. But there are some safety and toxicity concerns that face the use of gene delivery viral vectors. Here, HMSN-based co-delivery of BTZ and the tumor-suppressor gene p53 was developed for p53 signal impaired NSCLC therapy. The result of the cell viability assay on p53-mutant H1299 cells showed that the half-maximum inhibiting concentration (IC50) of HMSN-PEI-BTZ-p53 was 51% or 25% of that for HMSN-BTZ in 72 or 96 h treatment, respectively. Live/dead staining assay for treated H1299 cells exhibited wider distribution, and higher dead staining was prominent in the HMSNs-PEI-BTZ-p53 group when compared to that of the HMSNs-BTZ group with equivalent BTZ concentration, which was consistent with accumulated p53 expression. Furthermore, the Annexin V-FITC/PI assay suggested restored p53 expression by HMSNs-PEI-BTZ-p53 induced activation of early apoptosis which contributed to enhanced later cell death. Western blotting and real time PCR results showed that several p53 downstream genes responded strongly and synergistically to BTZ function and p53 restored expression (accumulation of p21 and bax, activation of caspase 3, down-regulation of Bcl-2, etc.). Restoration and re-activation of the p53 signal pathway was the basic molecular mechanism for enhanced efficacy of HMSNs-PEI-BTZ-p53 on p53-mutant NSCLC cells.
Introduction
Bortezomib (BTZ) is the first therapeutic proteasome inhibitor to be clinically used in humans for treating multiple myeloma1,2 and mantle cell lymphoma.3,4 However, the efficacy of BTZ is compromised by its hydrophobic properties and low bioavailability. Besides, previous studies reported that BTZ showed varied efficacy on a wide range of human cancer cell lines with different genetic backgrounds.5–9 In particular, single-agent BTZ in non-small cell lung cancer (NSCLC) patients has very limited activity.10,11In our previous work,12 we reported the development of a hollow mesoporous silica nanosphere (HMSN)-based drug delivery system for BTZ to achieve improved tumor-suppressing effects under both in vitro and in vivo conditions for NSCLC therapy. Furthermore, we found the tumor-suppressing effect of HMSNs-BTZ synergized with the presence of wild-type p53 signaling in NSCLC cells. After that, another group reported using a dendrimer to encapsulate BTZ to improve its efficacy.13 We reported another pharmacogenomics study14 which found that the enhanced functions of BTZ were associated with the dramatic activation of the p53 signal pathway, suggesting that more pronounced tumor suppression could be expected if HMSNs-BTZ are administered in combination with gene therapy using wild-type p53 for p53 functionally impaired NSCLC.
Practically, previous studies reported that up to 50% of all NSCLC contained p53 gene mutations, which might contribute to poor prognosis and may be relatively more resistant to chemo-or radiation therapy.15,16 p53 gene therapy has been tested in clinical trials in patients with lung cancer, and several clinical studies have shown a beneficial effect of the combination of p53 gene therapy and chemotherapeutic drugs. However, the issues of immunogenicity, carcinogenicity and inflammation are associated with gene delivery viral vectors.17,18
Since HMSNs could serve as an efficient and biocompatible vesicle capable of encapsulation and delivery, for both small molecule chemicals and plasmids,19–23 in this study, HMSNs were used as the platform for co-delivery of BTZ and the p53 gene. The system was carefully characterized, and its therapeutic efficacy and inner molecular mechanisms for treating NSCLC were systematically evaluated (Scheme 1).
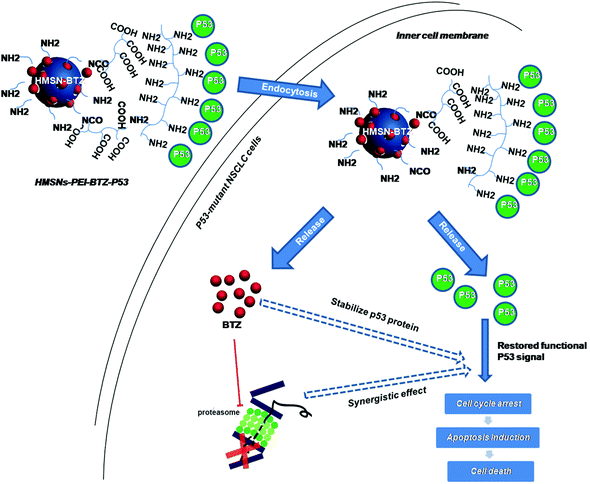 | ||
| Scheme 1 Schematic illustration of the co-delivery and release of BTZ and p53 gene to the p53-mutant human non-small cell lung cancer (NSCLC) cells by HMSNs. | ||
Results and discussion
Effect of HMSNs-BTZ combined with p53 gene transfection
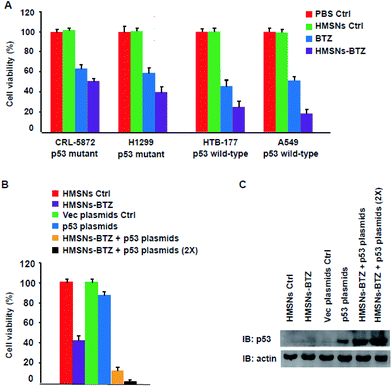
Mutations in the tumor suppressor p53 gene are one of the most common genetic alterations present with high frequency in human cancers including non-small cell lung cancer (NSCLC).15,24,25 Our previous work12 showed that both BTZ and HMSNs-BTZ have more profound efficacy for HTB-177 cells (p53 wild-type) compared to CRL-5872 cells (p53 mutant), which indicated the importance of the presence of wild-type p53 signaling. To further confirm this viewpoint, we evaluated the cell viability of another two NSCLC cells, including A549 cells (p53 wild-type) and H1299 cells (p53 mutant) along with the former two cell lines for BTZ and HMSNs-BTZ treatment, with the CCK-8 assay. As shown in Fig. 1A, at 48 h, both free BTZ and HMSNs-BTZ (comparative concentration of BTZ) exerted notable cytotoxicity on all NSCLC cells. However, the effect was much more significant on p53 gene wild-type HTB-177 cells and A549 cells especially in the HMSNs-BTZ treatment group. This result clearly suggested that the tumor-suppressing effect of BTZ or HMSNs-BTZ synergized with the presence of wild-type p53 signaling.According to these data, we next determined whether a combination of HMSNs-BTZ and p53 gene delivery might lead to a pronounced efficacy for p53-mutant H1299 cells. Firstly the cells were transfected with p53 expression plasmids or vector control, then incubated with HMSNs-BTZ for 48 h before being subjected to cell viability assay. As shown in Fig. 1B, the HMSNs-BTZ incubation caused more than 50% cell death of the total population, which was consistent with our previous study. Expression of the p53 protein in H1299 cells caused ∼10% cell viability decrease compared to the vector transfection control, which was mainly due to over-expressed p53 activated cell cycle arrest and apoptosis of the cells. When cells were treated with HMSNs-BTZ combined with p53 transfection, more growth inhibition was observed with cell viability dropping to ∼12%, and this effect occurred at a p53 dose-dependent manner. Fig. 1C shows the paralleled p53 expression levels under the indicated treatment for 48 h. Compared to p53 gene transfection only, we found that the p53 protein accumulated when the transfection was combined with HMSNs-BTZ treatment, which was attributed to BTZ that could stabilize the p53 protein. Taken together, the combined treatment of HMSNs-BTZ and p53 gene transfection led to a significant reduction of the p53-mutant H1299 cells.
There are a series of safety issues associated with the existing p53 gene delivery viral vectors, and HMSNs could serve as a biocompatible vesicle capable of encapsulation and delivery, for both small molecule chemicals and macromolecules such as plasmids. We expected that the co-delivery of BTZ and the p53gene with HMSNs would be a very promising method for p53-mutant NSCLC treatment.
Synthesis and characterization of HMSN-PEI nanoparticles
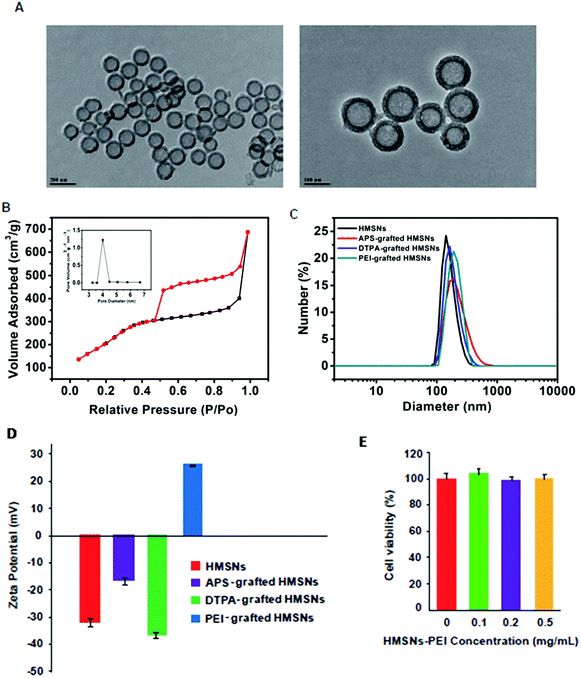
Following our previously published procedure, the hollow mesoporous silica nanospheres (HMSNs) were prepared using polystyrene latex nanospheres as templates of a hollow sphere and surfactant CTAB as pore-generating gas, followed by calcinations to remove the hard template. These NPs were functionalized with 3-aminopropyltriethoxysilane (APS), diethylenetriaminepentaacetic dianhydride and then PEI. TEM images (Fig. 2A) show PEI grafted HMSNs with essentially hollow spherical particles and an average size of ∼140 nm. These PEI grafted HMSNs exhibited characteristic IV type of the N2 adsorption–desorption isotherm (Fig. 2B) with a narrow pore size distribution (average diameter: 4.1 nm) (Fig. 2B, insert), demonstrating their mesoporous nanoshell structure. From the isotherm curve (Fig. 2B), the specific surface area was calculated to be 687.3 m2 g−1. Moreover, the alternating changes of zeta potentials and slightly increased hydrodynamic sizes after each step of polymer coating (Fig. 2C and D) confirmed the successful preparation of HMSNs-PEI. The cytotoxicity of the synthesized HMSNs-PEI on H1299 cells was assessed by using the CCK-8 cell viability assay. As shown in Fig. 2E, the viabilities of cells treated with nanoparticles were comparable to the control even when the tested concentration was as high as 0.5 mg ml−1, indicating that HMSNs-PEI does not exhibit notable cytotoxicity. As a result, in the study on the efficacy of the nanoparticles containing p53 expression plasmids and/or BTZ, the cell inhibition effect from the nanoparticle vectors could be eliminated.Synthesis of HMSNs-PEI-p53 nanoparticles
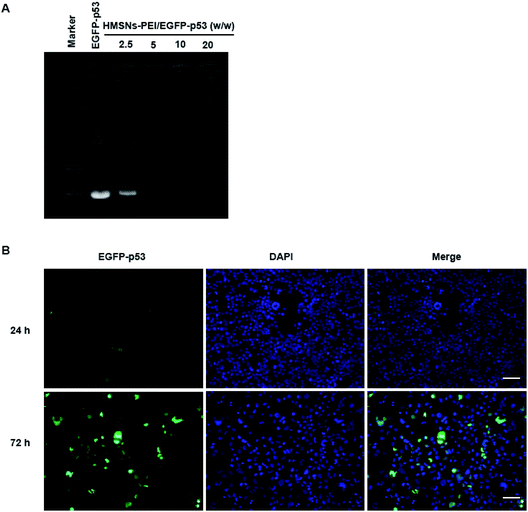
PEI is rich in primary and secondary amines, which are protonated to carry a large quantity of positive charges.26 We expected that HMSNs-PEI was capable of complexing with negatively charged plasmids for p53 gene delivery. Agarose gel electrophoresis for the complex obtained is shown in Fig. 3A. Naked EGFP-p53 plasmids revealed a typical supercoiled band. When HMSNs-PEI and EGFP-p53 plasmids were mixed with a weight ratio of 5, the molecular weight increased and electrophoretic mobility was obviously reduced. Complete retardation of the plasmids was achieved with HMSNs-PEI to DNA at a weight ratio of 5![[thin space (1/6-em)]](https://www.rsc.org/images/entities/char_2009.gif) :
:![[thin space (1/6-em)]](https://www.rsc.org/images/entities/char_2009.gif) 1 or above, indicating that almost all the plasmids were integrated with HMSNs-PEI (the specified ratio of 5
1 or above, indicating that almost all the plasmids were integrated with HMSNs-PEI (the specified ratio of 5![[thin space (1/6-em)]](https://www.rsc.org/images/entities/char_2009.gif) :
:![[thin space (1/6-em)]](https://www.rsc.org/images/entities/char_2009.gif) 1 was used in the following experiments). This observation demonstrated that HMSNs-PEI possessed high EGFP-p53 binding ability.
1 was used in the following experiments). This observation demonstrated that HMSNs-PEI possessed high EGFP-p53 binding ability.
Cellular uptake of HMSNs-PEI-p53
In our previous study, we confirmed the efficient uptake of HMSNs by cancer cells by tracing the FITC which was modified on the surface of HMSNs. Since p53 gene fused with the EGFP gene in the plasmids used in this study, we could directly monitor the EGFP signal for p53 protein expression and cellular localization to evaluate the HMSNs-PEI gene delivery efficiency.HMSNs-PEI-p53 (containing 0.5 μg EGFP-p53 plasmids) was incubated with H1299 cells seeded in 24-well plates for 24 h and 72 h. Cells were stained with DAPI (blue) to visualize the nucleus, and then an Operetta high content analysis system (PerkinElmer) was used for EGFP signal analysis. As shown in Fig. 3B, the EGFP green fluorescence intensity was low at 24 h time point of incubation, indicating that the majority of EGFP-p53 plasmids remained unexpressed. A reasonable explanation for the delayed effects is that a certain period of time may be needed for p53 plasmids to be released from nanoparticles and expression in cells. At 24 h time point, the seeded cells showed normal nuclear morphologies. In contrast, after 72 h incubation with HMSNs-PEI-p53 nanoparticles, the EGFP signal could be clearly observed in more than 60% of the total population. Meanwhile, the cells with high levels of EGFP-p53 expression exhibited shrinking and abnormal nuclear morphologies, indicating p53-induced cell stress and apoptosis initiation. Notably, the majority of the EGFP signal was localized within the cellular nucleus compartment, and this result was consistent with the intracellular distribution pattern of the p53 protein,25 demonstrating that HMSNs-PEI nanocarriers were capable of efficiently and accurately delivering the p53 gene into NSCLC H1299 cells.
Preparation and stability of HMSNs-PEI-BTZ-p53 nanoparticles
Previous results of this study indicated that combined HMSNs-BTZ treatment with p53 gene transfection achieved greater therapeutic efficacy than either HMSNs-BTZ or p53 gene treatment alone. Furthermore, PEI-modified HMSNs exhibited excellent advantages for p53 plasmid delivery. Thus, we expected that synergistic therapeutic effects could be achieved by co-delivery of BTZ and the p53 gene using HMSNs as the platform.To begin with, the HMSNs were used as reservoirs for loading BTZ to form HMSNs-BTZ (based on UV–Vis absorption measurements, approximately 18.7 μg of BTZ drug molecules were stored inside 1.0 mg of the HMSNs and an encapsulation efficiency of the BTZ could reach 48.6%). The methods have been described in our previous work.12 Then HMSNs-BTZ was modified with PEI on the surface for preparation of the HMSNs-PEI-BTZ complex. Subsequently, HMSNs-PEI-BTZ was mixed with EGFP-p53 plasmids (the specified ratio of 5![[thin space (1/6-em)]](https://www.rsc.org/images/entities/char_2009.gif) :
:![[thin space (1/6-em)]](https://www.rsc.org/images/entities/char_2009.gif) 1 was used) at room temperature for 1 h to form the HMSNs-PEI-BTZ-p53 complex, which was very similar to the synthesis of HMSNs-PEI-p53 nanoparticles.
1 was used) at room temperature for 1 h to form the HMSNs-PEI-BTZ-p53 complex, which was very similar to the synthesis of HMSNs-PEI-p53 nanoparticles.
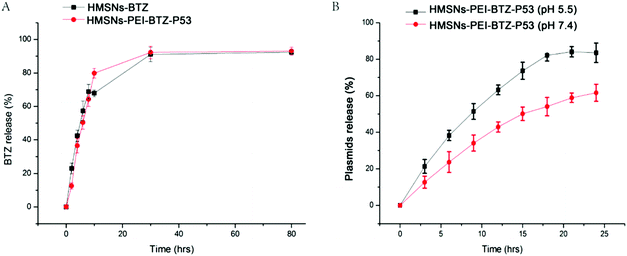
Next we sought to examine the effective BTZ releases from HMSNs-PEI-BTZ-p53 nanoparticles. The cumulative drug release profiles of HMSNs-PEI-BTZ-p53 and HMSNs-BTZ (containing an equal amount of BTZ, ∼374 μg) over a period of 78 hours in phosphate-buffer saline (PBS, pH 7.4) at room temperature are shown in Fig. 4A. In the HMSNs-BTZ group, cumulative drug release profiles exhibited that more than 65% of the drug was discharged from HMSNs within 8 h, followed by a sustained and slow release (∼30% of the drug released within later 70 h). In contrast, BTZ was released much more slowly from the HMSNs-PEI-BTZ-p53 complex in the first 8 h, mainly influenced by the outermost layer of the PEI-p53 structure. Then the curve of BTZ from HMSNs-PEI-BTZ-p53 exhibited faster release. The accumulated release amount of BTZ at 28 h was 92.6%, which was comparable with 92.1% of the HMSNs-BTZ group. Overall, both exhibited a similar controlled drug release pattern with burst release at the initial stage and prolonged release afterwards.
The EGFP-p53 plasmids released from the HMSNs-PEI-BTZ-p53 complex were investigated as follows. The nanoparticle/plasmid complex prepared with a weight ratio of 5![[thin space (1/6-em)]](https://www.rsc.org/images/entities/char_2009.gif) :
:![[thin space (1/6-em)]](https://www.rsc.org/images/entities/char_2009.gif) 1 was incubated in PBS at either pH 7.4 or acidic pH 5.5 at room temperature. The percentages of cumulative EGFP-p53 plasmid release were measured at an interval of 3 h over a period of 78 h. As shown in Fig. 4B, after 9 h incubation, the EGFP-p53 released from the HMSNs-PEI-BTZ-p53 complex reached 52% at pH 5.5 but only 36% at pH 7.4. After 18 h, in the pH 5.5 group, around 82% of plasmids were released from the nanoparticles and the curve reached its peak. In contrast, only 55% of the EGFP-p53 released at that time point under normal physiological pH 7.4 conditions. The p53 plasmids were released slowly from the HMSNs-PEI-BTZ-p53 complex under normal physiological conditions and exhibited accelerated release following endocytosis into lysosomes and endosomes (both acidic environments), which was favorable for increased p53 gene accumulation in the cancer cells and reduced release in normal tissue, thus having potential to enhance the long-term efficacy and reduce toxic side effects when combined with BTZ release.
1 was incubated in PBS at either pH 7.4 or acidic pH 5.5 at room temperature. The percentages of cumulative EGFP-p53 plasmid release were measured at an interval of 3 h over a period of 78 h. As shown in Fig. 4B, after 9 h incubation, the EGFP-p53 released from the HMSNs-PEI-BTZ-p53 complex reached 52% at pH 5.5 but only 36% at pH 7.4. After 18 h, in the pH 5.5 group, around 82% of plasmids were released from the nanoparticles and the curve reached its peak. In contrast, only 55% of the EGFP-p53 released at that time point under normal physiological pH 7.4 conditions. The p53 plasmids were released slowly from the HMSNs-PEI-BTZ-p53 complex under normal physiological conditions and exhibited accelerated release following endocytosis into lysosomes and endosomes (both acidic environments), which was favorable for increased p53 gene accumulation in the cancer cells and reduced release in normal tissue, thus having potential to enhance the long-term efficacy and reduce toxic side effects when combined with BTZ release.
Cytotoxicity of HMSNs-PEI-p53-BTZ on H1299 cancer cells
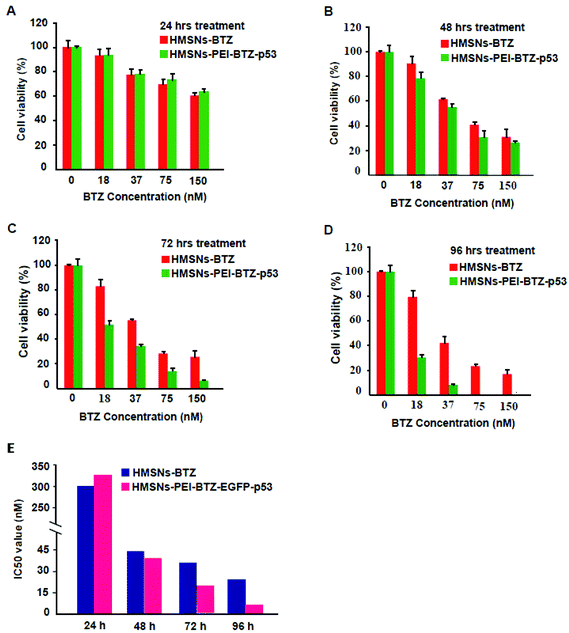
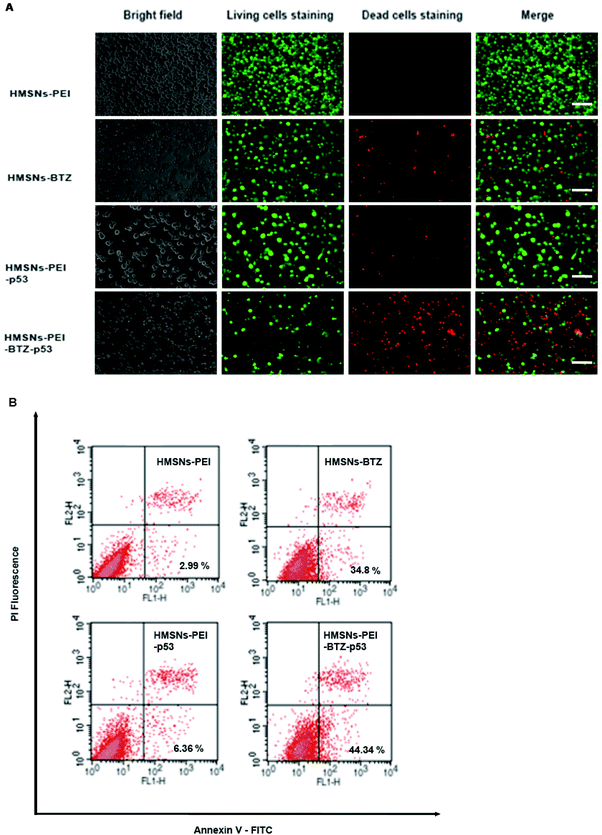
Then we sought to compare the cytotoxicity between HMSNs-BTZ and HMSNs-PEI-BTZ-p53 nanoparticles. As shown in Fig. 5A, the dose-dependent cytotoxic effect on H1299 cells was observed in both treatment groups at all scheduled time points. For the first 24 h treatment, cytotoxicity of HMSNs-BTZ is slightly stronger compared to HMSNs-PEI-BTZ-p53 at most of the concentrations examined, which may be attributed to BTZ being released slowly within that time course. The half-maximum inhibiting concentrations (IC50 value) of HMSNs-BTZ and HMSNs-PEI-BTZ-p53 at 24 h are ∼300 nM and ∼320 nM, respectively (Fig. 5E). However, after 24 h, HMSNs-PEI-BTZ-p53 exhibited obvious advantage over HMSNs-BTZ with respect to cytotoxicity in all concentrations (Fig. 5B–D), and the IC50 values at 72 h and 96 h dropped to 18 nM and 7 nM, respectively. Overall, the anti-proliferative effect was more substantial in cells treated with HMSNs-PEI-BTZ-p53 than those treated with HMSNs-BTZ.For further comparing the efficacy of HMSNs-PEI-BTZ-p53 with HMSNs-BTZ on NSCLC cells, live/dead staining detection was performed for H1299 cells treated with HMSNs-PEI (0.1 mg mL−1), HMSNs-BTZ (equal to 30 nM BTZ), HMSNs-EGFP-p53 (containing ∼0.13 μg p53 plasmids) and HMSNs-BTZ-EGFP-p53 (containing ∼30 nM BTZ and ∼0.13 μg p53 plasmids) for 72 h. Following treatment, the cells were co-stained with Calcine AM and propidium iodide (PI) to differentiate live (green) and dead (red) cells, respectively. As shown in Fig. 6A, in the case of HMSNs-PEI incubated cells, no acute cell death or loss of cell viability was observed after 72 h treatment and further confirmed the biocompatibility of HMSNs. In contrast, ∼10% of the total population exhibited a fluorescence signal of propidium iodide (PI) staining in the HMSNs-PEI-p53 treated group, indicating that p53 expression caused a portion of cell death. HMSNs-BTZ treatment led to more severe cell death; ∼40% cells were stained with PI, which was consistent with our previous cell viability assay results (Fig. 5C). Wider distribution and higher dead staining were more prominent in the HMSNs-PEI-BTZ-p53 group when compared to that of the HMSNs-BTZ group at equivalent BTZ concentration, suggesting that plasmids and drug co-loaded HMSNs might cause more cancer cells to die than HMSNs-BTZ.
As p53 over-expression could induce early apoptosis activation, which could develop to apoptosis-mediated cell death,27 we hypothesized that HMSNs-PEI-BTZ-p53-induced improved later cell death was partially enhanced by early apoptosis induction through HMSN-delivered p53. Hence, cell samples treated as shown in Fig. 6A were subjected to Annexin V-FITC/PI staining for apoptosis analysis with flow cytometry. Annexin V has a high affinity for membrane phospholipid phosphatidylserine, which is translocated from the inner to the outer leaflet of the plasma membrane in cell apoptosis. PI could be used to distinguish viable from nonviable cells. Thus Annexin V-FITC/PI staining could distinguish early apoptosis from late apoptosis/necrosis cells. As shown in Fig. 6B, in the flow cytometry quadrantal diagram, the lower left, lower right, and upper right quadrants denoted viable, early apoptotic, and late apoptotic/necrotic regions, respectively. In the HMSNs-PEI group, the percentage of the early apoptotic cell population was low (2.99%); HMSNs-PEI-p53 incubation increased the early apoptotic percentage to 6.36%, indicating that p53 caused apoptosis induction. Remarkably, significant populations of the cells (44.34%) went into apoptotic quadrants when treated with HMSNs-PEI-p53-BTZ. Compared to HMSNs-BTZ (34.8%), the result suggested that p53 expression induced the early apoptosis activation and led to enhanced efficacy. Taken together, the results suggest that the stronger tumor-killing effect of HMSNs-PEI-p53-BTZ on H1299 cancer cells might be due to the induction of more apoptosis-mediated cell death than that by HMSNs-BTZ at comparable doses. It is conceivable that the increased and prolonged cytotoxicity of HMSNs-PEI-BTZ-p53 after cellular uptake might be attributable to the sustained release and expression of p53 plasmids in the cells. Notably, p53-induced cell stress and apoptosis initiation could further enhance the efficacy of BTZ to the p53-mutant NSCLC cells.
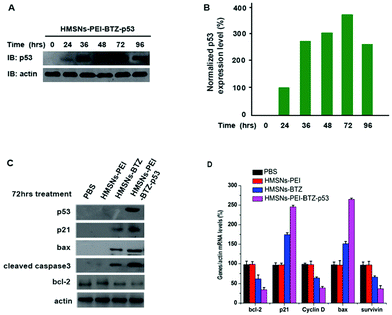
It is well known that the tumor suppressor, p53, exerts functions of cell cycle arrest and apoptosis induction through a variety of downstream genes.28 Meanwhile, treatment with BTZ also caused apoptosis of cancer cells.29,30 Therefore, we sought to investigate whether there are several genes in p53-mutant cells that respond to both BTZ treatment and restored p53 expression, which might be the underlining molecular mechanism of the augmented efficacy of HMSNs-PEI-BTZ-p53 on p53-mutant NSCLC cells. First we confirmed that the levels of the accumulated p53 protein in HMSNs-PEI-BTZ-p53 treated H1299 cells reached the peak at 72 h time point (Fig. 7A and B). Then we carried out western blotting assay to analyze some key proteins which were associated with the cell apoptosis process after HMSNs-BTZ and HMSNs-PEI-BTZ-p53 treatment for 72 h. As shown in Fig. 7C, HMSNs-BTZ indeed stabilized the p21 protein, a key protein in G1/s phase control, presumably through inhibiting its ubiquitylation–proteasome-mediated degradation. Remarkably, HMSNs-PEI-BTZ-p53 caused a stronger accumulation of p21, which might lead to enhanced cell cycle arrest.31 A similar pattern was exhibited by the bax protein, which is a critical inducer for the cell apoptosis process as well as a targeted gene of the p53 protein.32 Meanwhile, we found significant activation of Caspase-3 under HMSNs-PEI-BTZ-p53 treatment, confirming that the apoptotic process was activated,33 which was consistent with the result of Annexin V-FITC/PI staining in the previous experiment. In contrast, the anti-apoptotic bcl-2 protein33 decreased dramatically in the HMSNs-PEI-BTZ-p53 group compared to HMSNs-PEI control. In Fig. 7D, the real time PCR results indicate that the transcriptional level of the cell cycle regulator cyclin D34 decrease distinctly, so as the anti-apoptotic protein surviving under the HMSNs-PEI-BTZ-p53 treatment. Taken together, these p53 downstream genes responded strongly and synergistically to the BTZ function and p53 restored over-expression, which was the basic molecular mechanism for improved efficacy of HMSNs-PEI-BTZ-p53 on p53-mutant NSCLC H1299 cells.
Conclusions
In summary, this study reported the development and primary test of a hollow mesoporous silica nanosphere (HMSN)-based co-delivery system of a proteasome inhibitor anticancer drug, bortezomib (BTZ), and tumor-suppressor gene p53 for therapy against p53-mutant human non-small cell lung cancer (NSCLC). The drug and gene loaded nanostructures, named HMSNs-PEI-BTZ-p53, manifested improved therapy efficacy for p53-mutant NSCLC compared to HMSNs-BTZ that we reported in previous work. This might be attributable to the restored p53 protein in functional p53 mutant cells, which could re-activate the p53 signal pathway, respond strongly and synergistically to BTZ treatment and enhance its efficacy. These results imply that HMSNs-PEI-BTZ-p53 nanoparticles have the potential to become a novel drug-gene therapy for treating the p53-mutant NSCLC.Materials and methods
Chemicals and reagents
Aqueous ammonia, cetyltrimethylammonium bromide (CTAB) and ethanol were purchased from Sinopharm. 2,2′-Azobis(2-methylpropionamidine) dihydrochloride, [2-(acryloyloxy)ethyl] trimethylammonium chloride (AETAC, 80 wt% in H2O), styrene (St, >99.0%, washed through an inhibitor remover column for removing tert-butylcatechol and then distilled under reduced pressure prior to use), fluorescein isothiocyanate (FITC, 90%), 3-aminopropyl triethoxysilane (APS, 98%), and tetraethylorthosilicate (TEOS, GR) were obtained from Aladdin. Bortezomib (BTZ) was purchased from LC Laboratories. DAPI (4′,6-diamidino-2-phenylindole, dilactate), TRIzol reagent, a SuperScript™ First-Strand Synthesis System and a Live/Dead Cell Double Staining Kit were obtained from Life Technologies. The Annexin V-FITC Apoptosis Detection Kit I was purchased from BD Pharmingen™. The Cell Counting Kit-8 (CCK-8) was from Dojindo Molecular Technologies. Enhanced chemiluminescence solution was from Thermo Scientific. The SYBR Green PCR Master Mix was from Applied Biosystems. The mouse anti-p53 antibody (Santa Cruz), rabbit anti-Caspase 3 antibody (Signalway Antibody), mouse anti-actin antibody (Sigma), rabbit anti-p21 antibody (Abcam), rabbit anti-bax antibody (Abcam) and rabbit anti-bcl-2 antibody (Cell Signaling Technology) were obtained. The EGFP-p53 expression plasmids have been described in a previous study.25Materials characterization
Transmission electron microscopy (TEM) imaging was carried out by using a JEM-2100F at an acceleration voltage of 200 kV. Dynamic light scattering (DLS) and zeta potential measurements were carried out with a Zetasizer Nano Z (Malvern). UV-Vis absorption spectra were measured by using a PerkinElmer UV-Vis spectrophotometer. The Brunauer–Emmett–Teller (BET) surface area and pore size were measured using an ASAP 2050 system.Preparation of the APS-grafted HMSNs
The hollow mesoporous silica nanospheres (HMSNs) with size of about 140 nm were prepared as described previously.12 0.2 g of silica (3.3 mmol) and 150 μL of water were added in 20 mL of ethanol and ultrasounded for 3 h. To the silica NP suspension, 300 μL of APS were added and stirred at 35 °C overnight. The nanoparticles were then washed and purified by centrifugation three times with ethanol and water, and were treated with dry DMF. Then, the APS-grafted HMSNs were dispersed into dry DMF (60 mL) for later use.Synthesis of HMSNs-PEI
Then, 1.8 mL of triethylamine and 360 mg of diethylenetriamine pentaacetic acid dianhydride (DTPAda) were added to an APS-grafted HMSNs/DMF (60 mL) suspension. The mixture was heated to 80 °C for 30 min, and cooled down to room temperature while stirring overnight. The particles were purified by repeating the centrifugation/redispersion/washing steps: 1 time with 1% triethylamine in DMF, 2 times with water, followed by dispersion into 55 mL of water. Then the suspension was dispersed dropwise into 170 mL of PEI solution (5 wt%) and stirred for 4 h at 35 °C. The particles were purified by repeating the centrifugation/redispersion with water, then dispersed into 40 mL of water.Preparation of HMSNs-PEI-p53 and gel retardation assay
EGFP-p53 plasmids were combined with HMSNs-PEI (5 mg mL−1) at various w/w ratios after incubation for 1 h at room temperature, forming HMSNs-PEI-EGFP-p53 for further experiments. The plasmid DNA concentration was constant, 5 μg. To determine the binding efficiency of HMSNs-PEI with EGFP-p53 plasmids, HMSNs-PEI-EGFP-p53 complexes at various ratios of HMSNs-PEI to EGFP-p53 plasmids from 5 to 20 in pH 7.4 PBS buffer were loaded into the wells of a 1% agarose gel in Tris-acetate-EDTA (TAE) buffer, while naked DNA plasmids were used as the control. Electrophoresis was carried out at a voltage of 100 V for 30 min and the agarose gel was later soaked in ethidium bromide solution before visualizing the DNA bands under an ultraviolet transilluminator. Images were recorded by an Image Quant 300 (GE Healthcare).Synthesis of HMSNs-PEI-BTZ-p53
The HMSNs were used as reservoirs for loading bortezomib (BTZ) to form HMSNs-BTZ as described in our previous work (approximately 18.7 μg of BTZ drug molecules were stored inside 1.0 mg of the HMSNs and an encapsulation efficiency of the BTZ could reach 48.6%).12 Then HMSNs-BTZ were modified with PEI on the surface for preparation of the HMSNs-PEI-BTZ complex. Subsequently, HMSNs-PEI-BTZ were mixed with EGFP-p53 plasmids (the specified weight ratio of 5![[thin space (1/6-em)]](https://www.rsc.org/images/entities/char_2009.gif) :
:![[thin space (1/6-em)]](https://www.rsc.org/images/entities/char_2009.gif) 1 was used) at room temperature for 1 h to form HMSNs-PEI-BTZ-p53 nanoparticles.
1 was used) at room temperature for 1 h to form HMSNs-PEI-BTZ-p53 nanoparticles.
In vitro BTZ and p53 plasmids’ release
For BTZ release experiment in vitro, the prepared BTZ-loaded HMSNs-BTZ and HMSNs-PEI-BTZ-p53 nanoparticles (containing an equal amount of BTZ, ∼374 μg) were dispersed in 4 ml of phosphate-buffer saline (PBS, pH 7.4) as described previously.12 For the measurement of EGFP-p53 plasmids released from the HMSNs-PEI-BTZ-p53 complex, the nanoparticle/plasmid complex prepared with a weight ratio of 5![[thin space (1/6-em)]](https://www.rsc.org/images/entities/char_2009.gif) :
:![[thin space (1/6-em)]](https://www.rsc.org/images/entities/char_2009.gif) 1 (500 μg
1 (500 μg![[thin space (1/6-em)]](https://www.rsc.org/images/entities/char_2009.gif) :
:![[thin space (1/6-em)]](https://www.rsc.org/images/entities/char_2009.gif) 100 μg) was incubated in PBS at either pH 7.4 or acidic pH 5.5 in 24-well plates. Samples were taken from the plate at scheduled time points (at an interval of 3 h, from 0–24 h) and centrifuged at 5000g for 10 min, and the concentration of plasmids in 0.1 ml of the supernatant was measured using a U-3010 spectrophotometer (Hitachi, Japan).
100 μg) was incubated in PBS at either pH 7.4 or acidic pH 5.5 in 24-well plates. Samples were taken from the plate at scheduled time points (at an interval of 3 h, from 0–24 h) and centrifuged at 5000g for 10 min, and the concentration of plasmids in 0.1 ml of the supernatant was measured using a U-3010 spectrophotometer (Hitachi, Japan).
Cell culture
Human non-small cell lung cancer (NSCLC) cells (CRL-5872, HTB-177, H1299, A549 cells) were purchased from The Cell Bank of Type Culture Collection of Chinese Academy of Sciences (CAS, Shanghai). The cells were maintained in Dulbecco's modified Eagle's medium and supplemented with 10% fetal bovine serum, 100 U mL−1 penicillin, and 100 mg mL−1 streptomycin at 37 °C in a humidified incubator with 5% CO2 in air.Cellular uptake
Human non-small cell lung cancer cells H1299 seeded at a density of 105 cells per well on 24-well plates were incubated with HMSNs-PEI-p53 (containing 0.5 μg GFP-p53 plasmids) for 24 or 72 h. The cells were then washed with phosphate-buffer saline (PBS) 3 times and fixed in 2% formaldehyde for 1 h and stained with 0.5 μg ml−1 DAPI for 10 min. After washing with PBS for another 3 times, fluorescence was observed using an Operetta high content analysis system (PerkinElmer).Cell viability assay
Human non-small cell lung cancer (NSCLC) cells seeded in 96-well plates were subjected to indicated treatment; cell viability detection was carried out by using a CCK-8 detection kit (Dojindo Molecular Technologies, Inc., Gaithersburg, MD) according to the manufacturer's instructions as described before.12Observation of live/dead cell fluorescence
H1299 cells (2 × 10⁵ cells per well) on 24-well plates were incubated with HMSNs-PEI (0.1 μg ml−1), HMSNs-BTZ (equal to 30 nM BTZ), HMSNs-EGFP-p53 (containing ∼0.13 μg p53 plasmids) and HMSNs-BTZ-EGFP-p53 (containing ∼30 nM BTZ and ∼0.13 μg p53 plasmids) for 72 h. Cell viability was assessed using a Live/Dead staining kit (Life Technologies) according to the manufacturer's instruction. Calcein AM, a live cell stain, is a nonfluorescent dye that permeates the cell membrane, which is hydrolyzed by intracellular esterases to a green fluorescent calcein dye in live cells. Propidium iodide (PI), a dead cell stain, is membrane nonpermeable and generally excluded from viable cells. It binds to the DNA of dead cells by intrabase intercalation, generating red fluorescence. A 60 μL aliquot of calcein AM (1 mg mL−1) and 6 μL of propidium iodide (1 mg mL−1) were mixed with 5934 μL of Krebs buffer (pH 7.4). A 500 μL aliquot of this mixture was added to each well and incubated for 40 min. Fluorescence was observed by using an Operetta high content analysis system (PerkinElmer).Western blotting
For western blot analysis, treated H1299 cells were harvested and lysed in RIPA buffer (50 mM Tris-HCl, pH 7.2, 150 mM NaCl, 1% NP40, 0.1% SDS, 0.5% DOC, 1 mM PMSF, 25 mM MgCl2, and supplemented with a phosphatase inhibitor cocktail) before being subjected to immunoblotting analysis. The detection was carried out with enhanced chemiluminescence solution (Thermo Scientific).Cell apoptosis analysis
H1299 cells were treated with HMSNs-PEI (0.1 μg ml−1), HMSNs-BTZ (equal to 30 nM BTZ), HMSNs-EGFP-p53 (containing ∼0.13 μg p53 plasmids) and HMSNs-BTZ-EGFP-p53 (containing ∼30 nM BTZ and ∼0.13 μg p53 plasmids) for 72 h. Then the cells were washed with PBS 3 times and analyzed for apoptosis by using CANTO II (BD Biosciences) with the Annexin V-FITC Apoptosis Detection Kit I (BD Pharmingen). The binding of Annexin V was used as a sensitive method for measuring apoptosis. The cells were stained with Annexin V-FITC and propidium iodide (PI) after collection. Annexin V-positive and PI-negative cells were considered as early apoptotic cells and the Annexin V-positive and PI-positive cells were considered as late apoptotic and necrotic cells.RNA extraction and real-time PCR for messenger RNA expression
The total RNA was isolated from H1299 cells with TRIzol reagent (Life Technologies) and complementary DNA was synthesized from RNA with the SuperScript™ First-Strand Synthesis System (Life Technologies), following the manufacturer's instructions. Relative transcript expression levels were measured by quantitative real-time PCR with an ABI7700 sequence detection system (Perkin-Elmer Applied Biosystems) and the amplifications were performed using the SYBR Green PCR Master Mix (Applied Biosystems). The thermal cycling conditions were composed of 50 °C for 2 min followed by an initial denaturation step at 95 °C for 10 min, 45 cycles at 95 °C for 30 s, 60 °C for 30 s and 72 °C for 30 s. The experiments were carried out in duplicate for each data point. The actin forward primer was 5′-TTCTACAATGAGCTGCGTGTG-3′, reverse primer was 5′-GGGGTGTTGAAGGTCTCAAA-3′; the p21 forward primer was 5′-GCAGATCCACAGCGATATCC-3′, reverse primer was 5′-CAACTGCTCACTGTCCACGG-3′; the Bax forward primer was 5′-TGG AGCTGCAGAGGATGATTG-3′, reverse primer was 5′-GAAGTTGCCGTCAGAAAACATG-3′; the Bcl2 forward primer was 5′-CATGCTGGGGCCGTACAG-3′, reverse primer was 5′-GAACCGGCACCTGCACAC-3′; the cyclin D1 forward primer was 5′-TGTTCGTGGCC TCTAAGATGAAG-3′, reverse primer was 5′-AGGTTCCACTTGAGCTTGTTCA C-3′; the surviving forward primer was 5′-TGCCTGGCAGCCCTTTC-3′, reverse primer was 5′-CCTCCAAGAAGGGCCAGTTC-3′.Statistical analysis
All of the data are presented as means ± SEM. The two tailed unpaired Student's t-test was used to evaluate the significance of difference between two sets of data. Differences were considered to be statistically significant when P < 0.05.Acknowledgements
This work was financially supported by the National Natural Science Foundation of China (Grant No. 51602193), the Foundation of Shanghai University of Engineering Science (2015-05) and the Project of Shanghai Universities Young Teacher Training Scheme (ZZGCD15037).References
- D. Chen, M. Frezza, S. Schmitt, J. Kanwar and Q. P. Dou, Curr. Cancer Drug Targets, 2011, 11, 239–253 CrossRef CAS PubMed.
- J. Laubach and P. Richardson, Nat. Rev. Clin Oncol., 2011, 8, 8–10 CrossRef CAS PubMed.
- R. C. Kane, R. Dagher, A. Farrell, C. W. Ko, R. Sridhara, R. Justice and R. Pazdur, Clin. Cancer Res., 2007, 13, 5291–5294 CrossRef CAS PubMed.
- J. L. Koprivnikar and B. D. Cheson, Future Oncol., 2012, 8, 359–371 CrossRef CAS PubMed.
- J. Voortman, A. Checinska and G. Giaccone, Mol. Cancer, 2007, 6, 1046–1053 CrossRef CAS PubMed.
- C. Ceresa, E. Giovannetti, J. Voortman, A. C. Laan, R. Honeywell, G. Giaccone and G. J. Peters, Mol. Cancer Ther., 2009, 8, 1026–1036 CrossRef CAS PubMed.
- C. Wang, D. M. Gao, K. Guo, X. N. Kang, K. Jiang, C. Sun, Y. Li, L. Sun, H. Shu, G. Z. Jin, H. Y. Sun, W. Z. Wu and Y. K. Liu, BMC Cancer, 2012, 12 CAS.
- S. Thaler, G. Thiede, J. G. Hengstler, A. Schad, M. Schmidt and J. P. Sleeman, Int. J. Cancer, 2015, 137, 686–697 CrossRef CAS PubMed.
- K. F. Chen, C. Y. Liu, Y. C. Lin, H. C. Yu, T. H. Liu, D. R. Hou, P. J. Chen and A. L. Cheng, Oncogene, 2010, 29, 6257–6266 CrossRef CAS PubMed.
- B. Besse, D. Planchard, A. S. Veillard, L. Taillade, D. Khayat, M. Ducourtieux, J. P. Pignon, J. Lumbroso, C. Lafontaine, C. Mathiot and J. C. Soria, Lung Cancer, 2012, 76, 78–83 CrossRef PubMed.
- T. H. Li, L. Ho, B. Piperdi, T. Elrafei, F. J. Camacho, J. R. Rigas, R. Perez-Soler and R. Gucalp, Lung Cancer, 2010, 68, 89–93 CrossRef PubMed.
- J. Shen, G. S. Song, M. An, X. Q. Li, N. Wu, K. C. Ruan, J. Q. Hu and R. G. Hu, Biomaterials, 2014, 35, 316–326 CrossRef CAS PubMed.
- M. Wang, Y. Wang, K. Hu, N. Shao and Y. Cheng, Biomater. Sci., 2015, 3, 480–489 RSC.
- T. Yu, Y. H. Tao, M. Q. Yang, P. Chen, X. B. Gao, Y. B. Zhang, T. Zhang, Z. Chen, J. Hou, Y. Zhang, K. C. Ruan, H. Y. Wang and R. G. Hu, Cell Res., 2014, 24, 1214–1230 CrossRef CAS PubMed.
- C. L. Huang, H. Yokomise and A. Miyatake, Future Oncol., 2007, 3, 83–93 CrossRef CAS PubMed.
- J. Neukirchen, A. Meier, A. Rohrbeck, G. Garcia-Pardillos, U. Steidl, R. Fenk, R. Haas, R. Kronenwett and U. P. Rohr, Cancer Gene Ther., 2007, 14, 431–439 CrossRef CAS PubMed.
- S. Chira, C. S. Jackson, I. Oprea, F. Ozturk, M. S. Pepper, I. Diaconu, C. Braicu, L. Z. Raduly, G. A. Calin and I. Berindan-Neagoe, Oncotarget, 2015, 6, 30675–30703 Search PubMed.
- K. Park, W. J. Kim, Y. H. Cho, Y. I. Lee, H. Lee, S. Jeong, E. S. Cho, S. I. Chang, S. K. Moon, B. S. Kang, Y. J. Kim and S. H. Cho, Front. Biosci., Landmark Ed., 2008, 13, 2653–2659 CrossRef CAS.
- P. P. Yang, S. L. Gai and J. Lin, Chem. Soc. Rev., 2012, 41, 3679–3698 RSC.
- M. H. Kafshgari, M. Alnakhli, B. Delalat, S. Apostolou, F. J. Harding, E. Makila, J. J. Salonen, B. J. Kuss and N. H. Voelcker, Biomater. Sci., 2015, 3, 1555–1565 RSC.
- M. Colilla, B. Gonzalez and M. Vallet-Regi, Biomater. Sci., 2013, 1, 114–134 RSC.
- G. S. Song, Q. A. Wang, Y. Wang, G. Lv, C. Li, R. J. Zou, Z. G. Chen, Z. Y. Qin, K. K. Huo, R. G. Hu and J. Q. Hu, Adv. Funct. Mater., 2013, 23, 4281–4292 CrossRef CAS.
- G. Song, J. Shen, F. Jiang, R. Hu, W. Li, L. An, R. Zou, Z. Chen, Z. Qin and J. Hu, ACS Appl. Mater. Interfaces, 2014, 6, 3915–3922 CAS.
- J. Shen, X. Sheng, Z. Chang, Q. Wu, D. Xie, F. Wang and R. Hu, Mol. Cell. Oncol., 2016, 3, e965642 CrossRef PubMed.
- J. Shen, X. Sheng, Z. Chang, Q. Wu, S. Wang, Z. Xuan, D. Li, Y. Wu, Y. Shang, X. Kong, L. Yu, L. Li, K. Ruan, H. Hu, Y. Huang, L. Hui, D. Xie, F. Wang and R. Hu, Cell Rep., 2014, 7, 180–193 CrossRef CAS PubMed.
- L. Han, J. Zhao, J. Liu, X. L. Duan, L. H. Li, X. F. Wei, Y. Wei and X. J. Liang, Biomaterials, 2014, 35, 3110–3120 CrossRef CAS PubMed.
- J. Shen, S. Zhang, Y. Li, W. Zhang, J. Chen, M. Zhang, T. Wang, L. Jiang, X. Zou, J. Wong, X. Li, Y. Cui and C. Wang, Biochem. J., 2011, 434, 275–285 CrossRef CAS PubMed.
- C. L. Brooks and W. Gu, Curr. Opin. Cell Biol., 2003, 15, 164–171 CrossRef CAS PubMed.
- M. Lioni, K. Noma, A. Snyder, A. Klein-Szanto, J. A. Diehl, A. K. Rustgi, M. Herlyn and K. S. Smalley, Mol. Cancer Ther., 2008, 7, 2866–2875 CrossRef CAS PubMed.
- F. Yang, V. Jove, S. Chang, M. Hedvat, L. Liu, R. Buettner, Y. Tian, A. Scuto, W. Wen, M. L. Yip, T. Van Meter, Y. Yen and R. Jove, Cancer Biol. Ther., 2012, 13, 349–357 CrossRef CAS PubMed.
- O. Coqueret, Trends Cell Biol., 2003, 13, 65–70 CrossRef CAS PubMed.
- M. P. Luna-Vargas and J. E. Chipuk, Trends Cell Biol., 2016 DOI:10.1016/j.tcb.2016.07.002.
- A. G. Porter and R. U. Janicke, Cell Death Differ., 1999, 6, 99–104 CAS.
- Y. J. Choi, B. Saez, L. Anders, P. Hydbring, J. Stefano, N. A. Bacon, C. Cook, I. Kalaszczynska, S. Signoretti, R. A. Young, D. T. Scadden and P. Sicinski, Dev. Cell, 2014, 30, 255–267 CrossRef CAS PubMed.
Footnote |
| † Present address: Tumor Initiation and Maintenance Program, Sanford Burnham Prebys Medical Discovery Institute, San Diego, CA 92037, USA. |
| This journal is © The Royal Society of Chemistry 2017 |

