A minimalist Chinese liquor identification system based on a colorimetric sensor array with multiple applications†
Li
Jia-wei
a,
Hou
Chang-jun
*ab,
Huo
Dan-qun
a,
Yang
Mei
*a,
Zhang
Su-yi
c,
Ma
Yi
ad and
Lin
Yang
a
aKey Laboratory of Biorheology Science and Technology, Ministry of Education, College of Bioengineering, Chongqing University, Chongqing, 400044, China. E-mail: houcj@cqu.edu.cn; yangmei@cqu.edu.cn; Fax: +862365102507; Tel: +862365112673
bNational Key Laboratory of Fundamental Science of Micro/Nano-Device and System Technology, Chongqing University, Chongqing, 400044, China
cNational Engineering Research Center of Solid-State Brewing, Luzhou Laojiao Group Company, Ltd., Luzhou, Sichuan 646000, China
dLiquor Making Bio-Technology & Application of Key Laboratory of Sichuan Province, Zigong, 643000, China
First published on 14th November 2016
Abstract
The components of Chinese liquor are influenced by geographical origins and raw materials. Currently, Chinese liquor identification systems are limited and have a single application that can distinguish only one nature of flavor type and production area. Four chemical reagents were successfully used to build this 3 × 1 simple colorimetric sensor array. This is the first time that a highly accurate colorimetric Chinese liquor sensor array was fabricated using only a few array points. It could distinguish four types of Chinese base liquors from Luzhou Laojiao, nine types of Chinese liquors with different flavor types, and seven types of Chinese liquors from different geographical origins. In order to ensure the accuracy, seven parallel samples were analyzed with water used as a control. PCA proved this sensor array to be effective. In LDA and HCA, every group was clearly classified. The “leave-one-out” cross-validation method was applied with 100% prediction ability in the three experiments. According to the results of the PCA, HCA, LDA, and the “leave-one-out” method, we can deduce that this colorimetric sensor array with multiple applications has great performance in discriminating Chinese liquors.
Introduction
Chinese liquor, an alcoholic beverage, is popular all over the world. According to recent statistics, the annual consumption of Chinese liquor exceeds 10 billion liters, with more than 7![[thin space (1/6-em)]](https://www.rsc.org/images/entities/char_2009.gif) 000
000![[thin space (1/6-em)]](https://www.rsc.org/images/entities/char_2009.gif) 000 tons produced in 2010.1,2 The brewing method of Chinese liquor, which comes from the home brewing methods carried out by the general population, comprises of distilling cereals that are fermented by yeast (Saccharomyces cerevisiae).3–5
000 tons produced in 2010.1,2 The brewing method of Chinese liquor, which comes from the home brewing methods carried out by the general population, comprises of distilling cereals that are fermented by yeast (Saccharomyces cerevisiae).3–5
The main components accounting for 90% of Chinese liquor are water and alcohol.6 The other components are responsible for the special and attractive taste.7,8 Different types of raw materials and specialized brewing techniques lead to a variety of flavor types, which determine the quality grade of the resulting Chinese liquor.9 Chinese liquor now can be divided into ten main types, including strong, sauce, light, soybean, rice, sesame, medicine, mixed, te-, and feng-flavors.10 The quality is determined by geographical origins too. There are several examples in which the quality of liquor is influenced by the production area and raw materials. For example, the butyl caproate concentration in strong flavor is much higher than in other flavors and the Mg and K levels in the liquor from Luzhou Laojiao11 (Sichuan Province) are lower compared with liquors from other production areas. The organics and metal ion content can also change the flavor type and quality.6
Wine tasters can determine different levels, flavor types and geographical origins. This detection method needs a professional wine taster and is too subjective to be impacted by environmental and physiological factors.10 Physical and chemical analyses depend largely on equipment, including headspace solid-phase micro-extraction gas chromatography,12 gas chromatography-mass spectrometry (GC-MS),13 and infrared spectroscopy.14 These methods can do accurate detection, but at the same time they have limitations that include time-consuming procedures,13 requirement for professional operation, complicated pretreatment, and high cost. These shortcomings greatly hinder such methods applications for real-time in situ measurements.15,16 Significantly, physical and chemical analyses only measure the content of the materials, neglect the relationship between partners, and cannot carry out comprehensive evaluation of Chinese liquors.17
In view of these disadvantages, an identification system based on a colorimetric sensor array stands out as a great candidate to address the abovementioned problems.1 With the inspiration of the mammalian gustatory, such a sensor array can get unique, visible fingerprints for a complex mixture.18–20 These sensor arrays are made up of various nonselective sensitive materials, which endow the sensor arrays with the ability to discriminate complex matrices. Successful application of colorimetric sensor arrays have been reported, including sensor arrays for beers,21 soft drinks,22 coffees,23 and also Chinese liquors.1,17,24 Previous reports have found that these sensor arrays can distinguish different types of Chinese liquors accurately and effectively. However, these sensors are not only much more complicated than the ones in this study, but also suffer from their single function to differentiate the flavor types and geographical origin of the Chinese liquor.17 In addition, the sensor array systems reported previously were vulnerable to long-time storage, which also limits their real application in the field of Chinese liquor monitoring.21,25
Therefore, one exact and objective way to distinguish different Chinese liquors is imperative. With inspiration from Table 1, we successfully created a 3 × 1 sensor array to identify four types of Chinese base liquors from Luzhou Laojiao. Then, considering the similarity between the composition of liquors and base liquors, we used this sensor to distinguish different flavors and different geographical origins. SPSS 22, multivariate analysis software, was used to analyze the change of RGB. Data analysis was performed by hierarchical clustering analysis (HCA), principal component analysis (PCA), and linear discriminant analysis (LDA). The “leave-one-out” cross validation was used to ensure the veracity and practicability. These results demonstrated that the new sensor array had great performance in discriminating different Chinese liquors. The main goal of this study was to develop a reliable sensor array to discriminate base liquors and to identify commercial Chinese liquors with different flavors and production areas. This effort may prove to be helpful for the quality control of Chinese liquors in the market and in mass-production.
| Components | Base liquor | Components | Base liquor | ||||||
|---|---|---|---|---|---|---|---|---|---|
| I | II | III | IV | I | II | III | IV | ||
| 1,1-Diethoxy-3-methylbutane | 0.0025 | 0.0019 | Ethyl palmitate | 0.0601 | 0.0447 | 0.0232 | 0.0367 | ||
| 1,1-Diethoxy-3-methyl-butane | 0.0026 | 0.0051 | 0.0072 | 0.0034 | Ethyl palmitate | 0.0006 | 0.0005 | ||
| 2-Amyl alcohol | 0.0247 | 0.0120 | 0.0191 | 0.0094 | Ethyl pelargonate | 0.0085 | 0.0026 | 0.0018 | 0.0069 |
| 2-Butanone | 0.0020 | 0.0011 | 0.0019 | 0.0015 | Ethyl phenylacetate | 0.0210 | 0.0111 | 0.0056 | 0.0052 |
| 2-Butyl alcohol | 0.0294 | 0.0200 | 0.0346 | 0.0179 | Ethyl propionate | 0.0574 | 0.0447 | ||
| 2-Methyl-1-butanol | 0.0141 | 0.0001 | 0.0001 | Ethyl valerate | 0.1172 | 0.0722 | 0.1100 | 0.0526 | |
| 2-Methylbutyraldehyde | 0.0051 | 0.0084 | 0.0042 | Ethylis oleas | 0.0117 | 0.0117 | 0.0182 | 0.0103 | |
| 2-Pentanone | 0.0140 | 0.0237 | 0.0128 | Furfural | 0.0223 | 0.0367 | 0.0257 | 0.0360 | |
| 3-Methylbutyraldehyde | 0.0315 | 0.0503 | 0.0229 | Furfuralcohol | 0.0108 | 0.0118 | 0.0169 | 0.0233 | |
| Acetaldehyde | 0.0583 | 0.0400 | 0.0479 | 0.0215 | Heptanoic acid | 0.0052 | 0.0034 | 0.0040 | |
| Acetal | 0.2904 | 0.2426 | 0.2941 | 0.1440 | Hexyl hexanoate | 0.0011 | 0.0007 | 0.0013 | |
| Acetic acid | 0.6594 | 0.5289 | 0.4851 | 0.3077 | Hexyl alcohol | 0.1080 | 0.0391 | 0.0552 | 0.0496 |
| Acetone | 0.0105 | 0.0071 | 0.0102 | 0.0051 | Isoamyl caproate | 0.0003 | |||
| Acetyl | 0.0832 | 0.0177 | 0.0250 | 0.0154 | Isoamyl acetate | 0.0329 | 0.0503 | 0.0686 | 0.0337 |
| Benzaldehyde | 0.0591 | 0.0003 | 0.0029 | 0.0005 | Isoamylalcohol | 0.0397 | 0.0679 | 0.0558 | 0.0243 |
| Butyl caproate | 0.0008 | 0.0003 | 0.0366 | 0.0010 | Isobutanol | 0.0173 | 0.0187 | 0.0187 | 0.0072 |
| Butyric acid | 0.4776 | 0.2829 | 0.3831 | 0.6327 | Isobutyraldehyde | 0.0018 | |||
| Caproic acid | 1.1359 | 0.3742 | 0.7438 | 0.8804 | Isobutyric acid | 0.0088 | 0.0179 | 0.0126 | 0.0234 |
| Diethyl succinate | 0.0025 | 0.0037 | Isovaleric acid | 0.0193 | 0.0136 | 0.0190 | 0.0405 | ||
| Ethyl caprate | 0.0548 | 0.0028 | 0.0075 | 0.0079 | Methyl alcohol | 0.0613 | 0.0732 | 0.0671 | 0.0493 |
| Ethyl alcohol | 4780.1167 | 4989.0555 | 4710.6807 | 4836.7601 | Normal butanol | 0.1227 | 0.1255 | 0.1148 | 0.1012 |
| Ethyl butyrate | 0.7366 | Normal propyl alcohol | 0.0653 | 0.0729 | 0.0750 | 0.0505 | |||
| Ethyl butyrate | 0.6746 | Octanoic acid | 0.0083 | 0.0021 | |||||
| Ethyl butyrate | 0.3876 | 0.3227 | Pentane-3-carboxylic acid | 0.3892 | 0.4551 | 0.4551 | 0.4551 | ||
| Ethyl caprylate | 0.0420 | 0.0112 | 0.0207 | 0.0111 | Propionic acid | 0.0153 | 0.0105 | 0.0091 | 0.0057 |
| Ethyl formate | 0.0285 | 0.0329 | 0.0362 | 0.0151 | Propyl acetate | 0.0241 | 0.0327 | 0.0207 | |
| Ethyl hexanoate | 7.5227 | 3.9850 | 7.0190 | 4.1892 | tert-Amyl alcohol | 0.3746 | 0.3832 | 0.3832 | 0.3832 |
| Ethyl isobutyrate | 0.0378 | 0.0391 | 0.0342 | Valeric acid | 0.0389 | 0.0227 | 0.0383 | 0.0779 | |
| Ethyl lactate | 1.1264 | 0.9429 | 0.7475 | 0.5724 | β-Phenylethanol | 0.0014 | 0.0018 | 0.0020 | |
| Ethyl laurate | 0.0032 | 0.0044 | 0.0098 | Total acid | 1.81 | 1.13 | 1.58 | 1.7 | |
| Ethyl linoleate | 0.0159 | 0.0157 | 0.0230 | 0.0135 | Total ester | 8.29 | 4.96 | 7.87 | 4.5 |
| Ethyl oenanthate | 0.1095 | 0.0297 | 0.0638 | 0.0346 | |||||
Experimental
Reagents and chemicals
All the Chinese base liquors were from Luzhou Laojiao, and divided into four groups I, II, III, and IV.To discriminate the different flavors, we chose nine flavor types: strong flavor (Wuliangye), sauce flavor (Luzhou Laojiao), soybean flavor (Ice-burning Soy), rice flavor (Three Huajiu), sesame flavor (Wine Jingzhi), medicine flavor (Wine Dong), mixed flavor (Xiangquan wine), te-flavor (Four Special wine), and feng-flavor (Xifeng Jiu).
To discriminate the different geographical origins, we chose seven production areas, including Sichuan Province (Luzhou Laojiao), Guangdong Province (Ice-burning Soy), Shandong Province (Wine Jingzhi), Guizhou Province (Wine Dong), Hunan Province (Xiangquan wine), Jiangxi Province (Four Special wine), and Shaanxi Province (Xifeng Jiu).
Potassium permanganate (KMnO4) was obtained from Chongqing Boyi Chemical Factory (Chongqing, China). Phenol red was bought from Shanghai Qiangshun Reagent (Shanghai, China). Sodium hydroxide (NaOH) was produced by Chengdu Kelong Chemical Factory (Chengdu, China). Bromophenol blue was produced from Aladdin Reagent (Shanghai, China).
Fabrication of the sensor array
The minimalist Chinese liquor identification system with multiple applications based on a 3 × 1 colorimetric sensor array is shown in Fig. 1; chemical reagents from left to right are KMnO4, bromophenol blue, and phenol red containing sodium hydroxide.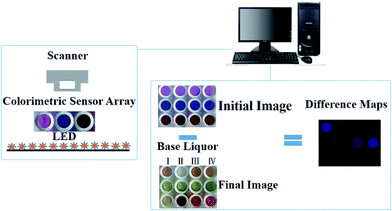 | ||
| Fig. 1 Schematic of the procedure to develop the new Chinese liquor identification system with multiple applications based on a 3 × 1 colorimetric sensor array. | ||
In the hole on the left, 1 mL potassium permanganate (KMnO4) solution (in deionized water) with a 0.1 g L−1 concentration was prepared to react with 1 mL of Chinese liquor samples. In the middle hole, 1 mL bromophenol blue solution (in deionized water) with a 0.1 g L−1 concentration was prepared to react with 1 mL of Chinese liquor samples. In the hole on the right, phenol red contained sodium hydroxide was prepared to react with 1 mL of Chinese liquor samples. The concrete details were as follows: 0.1 g phenol red was dissolved in 10 mL sodium hydroxide solution (10 g L−1 in deionized water). Then, this solution was diluted with deionized water to 100 mL. 0.7 mL of the abovementioned solution was used to react with 1 mL of Chinese liquor samples.
Data acquisition and analytical method
We ensured the center of each dye spot was averaged to avoid subtraction artifacts at the edge of the spots. Difference maps were obtained by taking the difference of the red, green, and blue (RGB) values from the center of every dye spot (∼300 pixels). These values are from the “before” and “after” images. We subtracted the “after” control RGB values from “after” samples RGB values to remove the background influence and get the change values. SPSS 22 was used to process the obtained ΔR, ΔG, and ΔB values. Data analysis was performed by principal component analysis (PCA), linear discriminant analysis (LDA), and hierarchical clustering analysis (Chebyshev distance was used in HCA). The “leave-one-out” cross-validation was applied to evaluate the LDA prediction capacity.Principal component analysis (PCA), a way to reduce the redundancy in the dimensionality of the data, was used to extract the variance between entries in a data matrix.3 It takes into account the obtained ΔR, ΔG, and ΔB for all analytes and generates a set of orthogonal eigenvectors (principal components) for maximum variance. Generally speaking, the larger the number of principal components necessary for a certain level of discrimination, the better the sensor will be able to discriminate among similar analytes.10,20
Linear discriminant analysis (LDA) is a commonly used technique for data classification and dimensionality reduction. Discriminant functions use a linear combination of descriptors that maximize the ratio of between-class variance and minimize the ratio of within-class variance.17 In this study, the prediction capacity of the classification model was validated using a “leave-one-out” procedure. More specifically, each sample was removed from the data set, one at a time. The classification model was built and the removed sample was classified using the new model. All samples in the data set were sequentially removed and reclassified. Finally, a percentage of correct classification was calculated.
Hierarchical clustering analysis (HCA) involves a measurement of either the distance or the similarity between objects to be clustered. Chebyshev distance was used to obtain sample similarities and define clusters. The most similar samples were merged together according to their similarities. Finally, when the similarity decreased, all the sub-groups were fused into a single cluster.5,10,22
Result and discussion
Fabrication of the sensor array
In order to build a sensor to distinguish base liquors from Luzhou Laojiao the chromatographic data was analyzed (Table 1) and special ingredients were selected. From Table 1, we found more than 60 types of organics, which could be categorized by four methods. These organics can be classified into 4 groups, including acid, ester, alcohol, and aldehyde groups. They can be subsequently divided into saturated components and unsaturated components. Furthermore, we defined them according to their effects on pH. We also found that the differences of aldehyde and ester were significant in different liquors.According to the characteristics of saturated components and unsaturated components, oxidants are used to define Chinese liquors. Potassium permanganate (KMnO4) was chosen. The acidity constants pKa of the Chinese liquor were in a pH range from 3.5 to 5. Bromophenol blue (3.0 (yellow)–4.6 (purple)) was used to build the sensor. In different Chinese liquors, the differences of acid, aldehyde and ester are significant. Strong base can react with acid, aldehyde and ester adequately to change the pH of the solution, and then pH indicator can make the pH change visible. Guided by this principle, sodium hydroxide (NaOH) and phenol red (6.8 (yellow)–8.4 (red)) were used.
When four types of base liquors were successfully classified, further investigations were carried out. Considering the similarity between compositions in product liquors and that in base liquors, we used this sensor to clearly classify the nine types of Chinese liquors with different flavors and seven types of Chinese liquors from different geographical origins.
Schematic of the procedure to develop the new Chinese liquor identification system with multiple applications based on a 3 × 1 colorimetric sensor array is shown in Fig. 1. Using the method as shown, the fingerprints were successfully obtained.
Discrimination of the Chinese base liquors from Luzhou Laojiao
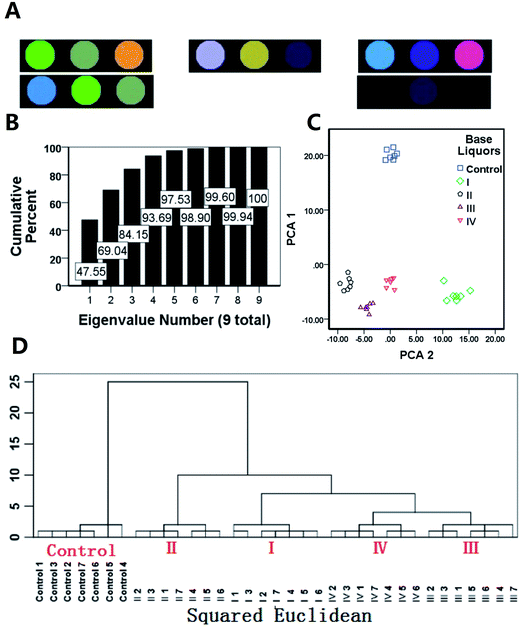
The Chinese base liquors from Luzhou Laojiao were divided into four groups I, II, III and IV. The responses for different Chinese base liquors in the sensor array can be discriminated by the naked eye, and the fingerprints are shown in Fig. 2A. We found that only KMNO4 reacted with II. We speculated that there may be more unsaturated components in II. Shown in Fig. 2B, PCA of the averaged responses to the four bases liquors showed that 84.12% of the discriminatory range required three dimensions, and 100% of total discrimination required nine dimensions. PCA of the averaged responses showed that the high discriminatory range required few dimensions, which means that this sensor array was effective. We decreased the dimensionalities of the data to two dimensions so that only 66.5% of the discriminatory ability of the array was used to establish the 2D model, and the results are shown in Fig. 2C. Deducing the plot of components from PCA is a way to reduce the redundancy in the dimensionality of the data. It can pick the important components in the data and distinguish them. The successful classification of different Chinese base liquors from Luzhou Laojiao samples is an indication of the great discrimination ability of the new sensor array. HCA involves a measurement of either the distance or the similarity between objects to be clustered. The most similar samples were merged together according to their similarities. Right clustering of the 35 samples by HCA further proved that the sensor displayed outstanding performance in discriminating the base liquors. We found that III and IV had a closer relationship and the controls were evidently different from the base liquors. Moreover, when the “leave-one-out” method was used, no errors were found for any sample. Therefore, we can deduce that this colorimetric sensor array developed in the present study has better performance in discriminating different Chinese base liquors from Luzhou Laojiao.Discrimination of the Chinese liquors with different flavors
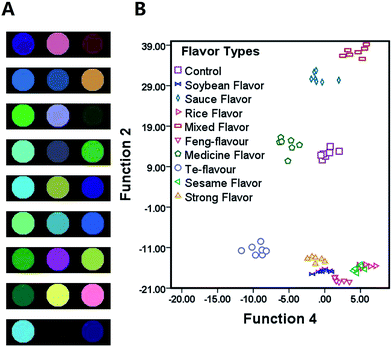
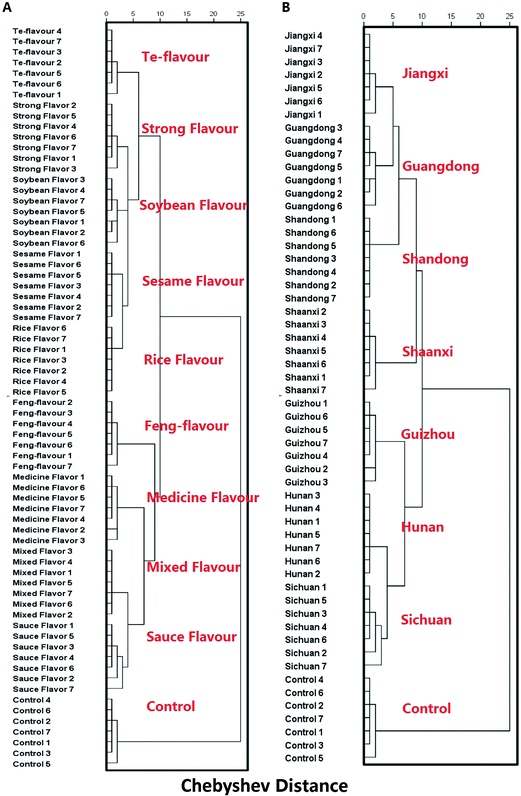
In this study, we used nine liquors of different flavors including strong flavor, sauce flavor, soybean flavor, rice flavor, sesame flavor, medicine flavor, mixed flavor, te-flavor, and feng-flavor. Fig. 3A is the fingerprints of the discrimination of the Chinese liquors with different flavor types. As this sensor array discriminated Chinese liquors of different flavor types, we used linear discriminant analysis (LDA) in SPSS 22 to determine the accuracy. LDA is a commonly used technique for data classification and dimensionality reduction. Nine calculated discriminant functions were utilized by the software to analyze the data; however full functions could not be used to build a model. Therefore, only two functions (function 2 and 4) were chosen to establish the 2D model, which had fair spatial discrimination among the chemical classes (Fig. 3B). Fig. 5 shows that different liquors with different flavors and seven blank controls were successfully classified except for the rice and the sesame flavors. The LDA calculation results were more accurate than those of the 2D model. When the full functions of the array response were applied there was no confusion among the analyte classes or between closely related analytes; this estimate can be verified by HCA in Fig. 5A. We found that strong flavor, soybean flavor, rice flavor, feng-flavor and sesame flavor had a close relationship, which can be seen in the HCA dendrogram. This phenomenon may be because their raw materials are very similar. The 70 samples are right clustered by HCA. The result for HCA indicated that the new 3 × 1 sensor had excellent performance in screening Chinese liquors of different flavors. Then, the “leave-one-out” method was used and every classification of the samples was right, i.e., the error rate of the predictive classification was <1.5%. According to the abovementioned successful analyzes, we can draw a conclusion that this colorimetric sensor array can be used in discriminating nine types of Chinese liquors with different flavors.Moreover, bromophenol blue turned blue when reacting with Chinese liquor of te-flavor. This phenomenon indicates that the pH of te-flavor liquor is alkaline.
Discrimination of the Chinese liquors produced in different areas
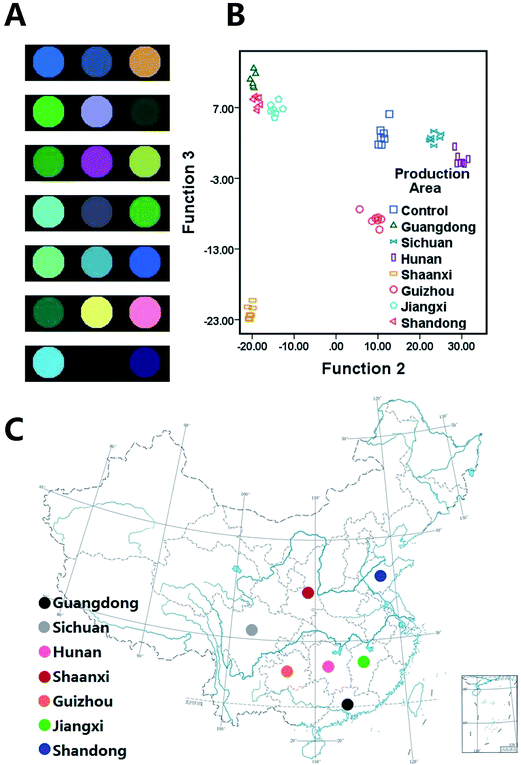
Chinese liquors produced in seven different areas, such as Guangdong Province, Sichuan Province (we choose Luzhou Laojiao), Hunan Province, Shaanxi Province, Guizhou Province, Jiangxi Province, and Shandong Province, were chosen. The fingerprints are shown in Fig. 4A. Fig. 4B shows the sample distribution in 2D space defined by the second and the third calculated discriminant functions (function 2 and function 3). From this figure, 56 samples were significantly classified by their inherent properties, although all the information was not included in this 2D model. Every type of sample could be classified accurately in this 2D model. In Fig. 5B, right clustering of the 56 samples by HCA further proved the 3 × 1 sensor had great performance in discriminating Chinese liquors produced in different areas. We found that the liquors produced in neighboring provinces were more similar, this phenomenon is evidence that proves the reliability of the sensor array. Moreover, when the “leave-one-out” method was used, we found that every type of sample was classified together without error. According to these results, we can deduce that this developed colorimetric sensor array is suitable for the discrimination of Chinese liquors produced in different areas.Conclusion
In this study, we successfully used fewer chemical reagents, only four, to build a minimalist Chinese liquor identification system based on a 3 × 1 colorimetric sensor array with multiple applications. It could distinguish four types of Chinese base liquors from Luzhou Laojiao, nine types of Chinese liquors of different flavor types, and seven types of Chinese liquors with different geographical origins. PCA of the averaged responses showed that a high discriminatory range required few dimensions, and this phenomenon indicated that this sensor array was effective. In LDA and HCA, every group was clearly observed and the recognition ability was 100% for each category. To evaluate the prediction capacity of the LDA, the “leave-one-out” cross-validation was applied. It showed a prediction ability of 100% in the three experiments. According to the information from the PCA, HCA, LDA, and the “leave-one-out” method, we can deduce that this sensor array had outstanding performance in discriminating Chinese liquors. The main aim of this study was to develop a reliable sensor array to discriminate base liquors and to identify different commercial Chinese liquors of different flavors and geographical origins. Using this Chinese liquor identification system we can do real-time in situ measurements. Compared with recent Chinese liquor identification sensor array, we chose fewer chemical reagents, only four, to build an economical and accurate sensor without limited reaction conditions. This effort may prove to be helpful for the quality control of Chinese liquors in the market and in mass-production.Acknowledgements
The authors would like to acknowledge the financial support from the Key Technologies R&D Program of China (No. 2014BAD07B02), Chongqing Graduate Student Research Innovation Project (CYB16038), the workstation in Sichuan Province GY2015-01, and Brew Microorganisms Technology and Application of Key Laboratory Project in Sichuan Province (No. NJ2014-03) and sharing fund of Chongqing University's large equipment.References
- J. J. Li, C. X. Song, C. J. Hou, D. Q. Huo, C. H. Shen, X. G. Luo, M. Yang and H. B. Fa, J. Agric. Food Chem., 2014, 62, 10422–10430 CrossRef CAS PubMed.
- W. L. Fan and M. C. Qian, J. Agric. Food Chem., 2005, 53, 7931–7938 CrossRef CAS PubMed.
- Z. B. Xiao, D. Yu, Y. W. Niu, F. Chen, S. Q. Song, J. C. Zhu and G. Y. Zhu, J. Chromatogr. B: Anal. Technol. Biomed. Life Sci., 2014, 945, 92–100 CrossRef PubMed.
- T. Kuribayashi, K. Sato, T. Joh, M. Kaneoke and K. Watanabe, J. Biosci. Bioeng., 2016, 121, 43–46 CrossRef CAS PubMed.
- L. Q. Zhang, C. D. Wu, X. F. Ding, J. Zheng and R. Q. Zhou, World J. Microbiol. Biotechnol., 2014, 30, 3055–3063 CrossRef CAS PubMed.
- W. L. Fan, Y. Xu and Y. H. Zhang, J. Agric. Food Chem., 2007, 55, 9956–9962 CrossRef CAS PubMed.
- J. H. Wu, Y. Zheng, B. G. Sun, X. T. Sun, J. Y. Sun, F. P. Zheng and M. Q. Huang, Molecules, 2015, 20, 19002–19013 CrossRef CAS PubMed.
- X. H. Wu, X. W. Zheng, B. Z. Han, J. Vervoort and M. J. R. Nout, J. Agric. Food Chem., 2009, 57, 11354–11359 CrossRef CAS PubMed.
- C. L. Wang, D. J. Shi and G. L. Gong, World J. Microbiol. Biotechnol., 2008, 24, 2183–2190 CrossRef.
- M. Liu, X. M. Han, K. Tu, L. Q. Pan, J. Tu, L. Tang, P. Liu, G. Zhan, Q. D. Zhong and Z. H. Xiong, Food Control, 2012, 26, 564–570 CrossRef CAS.
- Z. J. Xie, Y. M. Tang, X. Y. Huang and J. Yan, Niangjiu Keji, 2014, 11, 87–93 Search PubMed.
- J. Zhang, L. Li, N. F. Gao, D. P. Wang, Q. Gao and S. P. Jiang, Anal. Chim. Acta, 2010, 662, 137–142 CrossRef CAS PubMed.
- P. Y. Cheng, W. L. Fan and Y. Xu, Food Res. Int., 2013, 54, 1753–1760 CrossRef CAS.
- D. Dong, W. Zheng, W. Wang, X. Zhao, L. Jiao and C. Zhao, Food Chem., 2014, 155, 45–49 CrossRef CAS PubMed.
- Y. Q. Jing, Q. H. Meng, P. F. Qi, M. Zeng, W. Li and S. G. Ma, Rev. Sci. Instrum., 2014, 85, 10 CrossRef PubMed.
- Z. F. Li, N. Wang, G. S. V. Raghavan and C. Vigneault, Food Bioprocess Technol., 2011, 4, 247–253 CrossRef CAS.
- H. Qin, D. Q. Huo, L. Zhang, L. M. Yang, S. Y. Zhang, M. Yang, C. H. Shen and C. J. Hou, Food Res. Int., 2012, 45, 45–51 CrossRef CAS.
- M. C. Janzen, J. B. Ponder, D. P. Bailey, C. K. Ingison and K. S. Suslick, Anal. Chem., 2006, 78, 3591–3600 CrossRef CAS PubMed.
- L. Feng, C. J. Musto and K. S. Suslick, J. Am. Chem. Soc., 2010, 132, 4046–4047 CrossRef CAS PubMed.
- N. A. Rakow and K. S. Suslick, Nature, 2000, 406, 710–713 CrossRef CAS PubMed.
- C. Zhang, D. P. Bailey and K. S. Suslick, J. Agric. Food Chem., 2006, 54, 4925–4931 CrossRef CAS PubMed.
- C. Zhang and K. S. Suslick, J. Agric. Food Chem., 2007, 55, 237–242 CrossRef CAS PubMed.
- B. A. Suslick, L. Feng and K. S. Suslick, Anal. Chem., 2010, 82, 2067–2073 CrossRef CAS PubMed.
- Z. Ya, K. He, Z. M. Lu, B. Yi, C. J. Hou, S. Shan, D. Q. Huo and X. G. Luo, Flavour Fragrance J., 2012, 27, 165–170 CrossRef CAS.
- Q. Zhou, S. P. Zhang, Y. X. Li, C. S. Xie, H. Y. Li and X. H. Ding, Sens. Actuators, B, 2011, 160, 483–489 CrossRef CAS.
Footnote |
| † Electronic supplementary information (ESI) available: (1) Classification results for discrimination of the base liquor and different flavor types liquors from Luzhou Laojiao. (2) The reproducibility of detection of base liquors, different flavor types and different production areas. See DOI: 10.1039/c6ay02882a |
| This journal is © The Royal Society of Chemistry 2017 |

