Target-induced click conjugation for attomolar electronic monitoring of Cu(II) using horseradish peroxidase as indicator and nanogold particles as enhancer
Jing
Lv
ab,
Ying
Tang
a,
Dianyong
Tang
a,
Jin
Zhang
*ab and
Dianping
Tang
*ac
aChongqing Key Laboratory of Environmental Materials & Remediation Technologies, Chongqing University of Arts and Sciences, Chongqing 402160, P. R. China. E-mail: dianping.tang@fzu.edu.cn; zhangjin@cqwu.edu.cn; Fax: +86 591 22866135; Tel: +86 591 22866125
bCollege of Chemistry and Chemical Engineering, Southwest University, Chongqing 400715, P. R. China
cMOE Key Laboratory of Analysis and Detection for Food Safety, Department of Chemistry, Fuzhou University, Fuzhou 350116, P. R. China
First published on 15th November 2016
Abstract
Herein, a new electrochemical sensing protocol was designed for ultrasensitive detection of copper(II) (Cu2+) at the attomolar level based on target-induced click conjugation using horseradish peroxidase (HRP) as an indicator and gold nanoparticle (AuNP) as an enhancer. The click conjugation was carried out between the immobilized azido-DNA on the electrode and alkynyl-DNA/HRP-labeled AuNP. With the help of sodium ascorbate, target Cu2+ ion was initially reduced into Cu+, and the as-produced Cu+ could catalyze the azide–alkyne click reaction. Accompanying gold nanoparticles, the carried HRP molecules could electrochemically reduce the substrate (H2O2); this resulted in a strong electronic signal. The digital readout was relative to the amount of the peroxidase and indirectly reflected the Cu2+ concentration in the testing media. Under optimal conditions, the as-prepared sensor exhibited good electrochemical response towards Cu2+ in the 1.0 aM to 10 μM dynamic working range with a 0.38 aM detection limit. This methodology also displayed a high selectivity for Cu2+ relative to other potentially interfering ions due to the specific Cu+-induced azide–alkyne click reaction, and was applicable for monitoring Cu2+ in real river samples. Our strategy has a good potential for use in environmental surveys.
Introduction
Heavy metal pollution, a serious widespread environmental problem, can lead to toxicology, cellular effects, and so on. Actually, the human body has suffered too much exposure to heavy metal ions.1 Copper (Cu) is an essential transition element for the human body and one of the vital components utilized in all domains of life. However, Cu2+ ions can cause a series of diseases, such as anemia, arteriosclerosis, Alzheimer's disease, and Parkinson's disease if unregulated.2,3 The U.S. Environmental Protection Agency (EPA) and the World Health Organization (WHO) have defined the maximum permissible level of copper in drinking water to be 1.3 ppm (20 μM) and 2 mg L−1 (32 μM), respectively.4 Therefore, it is still an urgent requirement to develop convenient and reliable copper detection methods in the fields of environmental protection and human health. To date, numerous methods have been established for the detection of Cu2+, including traditional atomic absorption/emission spectrometry (AAS/AES),5–7 inductively coupled plasma mass spectroscopy (ICP-MS),8,9 inductively coupled plasma-atomic emission spectrometry (ICP-AES),10 fluorescence methods,11–13 and colorimetric assays. However, these methods have time-consuming pretreatment and need sophisticated instrumentation skills.4 In contrast, electrochemical sensors,14 as the most promising candidate in technologies, have proven to be advantageous because of simple instrumentation, low time consumption, and real-time in situ detection ability.15,16 Thus, intensive research efforts have been devoted to establishing high-performance electrochemical sensors for detecting heavy-metal ions.17 Generally, the strategies were developed mainly based on the signal amplification of nanomaterials,18 enzymes,19 and aptamers.20A gold nanoparticle label is an ideal material in bionanotechnological systems because of its inherent advantages, e.g., easy preparation and good biocompatibility.21 It has been used extensively to label different biological receptors, such as enzyme, DNA, and antigen/antibody.22 Horseradish peroxidase (HRP), a good choice as a signal amplification probe, could enhance the catalytic activity, leading to increased sensitivity.23 Inspired by these merits, the ability of gold nanoparticles and HRP to form nanocomposites (AuNP–HRP) for the signal multiple amplification was applied to detect analytes. As shown by the previous report, this advanced method was used to monitor protein.24 To this end, our motivation in this work was to develop a new AuNP–HRP-based electrochemical sensor for the detection of heavy metal ions.
Currently, a wide variety of chemical reactions have been used to detect metal ions. Particularly, the Cu+-catalyzed alkyne–azido click reaction has attracted extensive attention as it can be widely applied to monitor Cu2+. Reaction of Cu+-catalyzed Huisgen 1,3-dipolar cycloaddition of azides and terminal alkynes to form 1,2,3-triazoles is the model example of click chemistry.25–27 This reaction has high efficiency because it is simple to perform, modular and wide in scope, high yielding, and region-specific. In addition, other metal ions cannot catalyze the formation of five-membered heterocycles, indicating that the monitoring of Cu2+ requires good selectivity. In general, Cu(I) complex in situ is obtained by mixing a source of Cu2+ and a reducing agent. As a reductant, ascorbic acid or sodium ascorbate has been demonstrated to give excellent performance.28
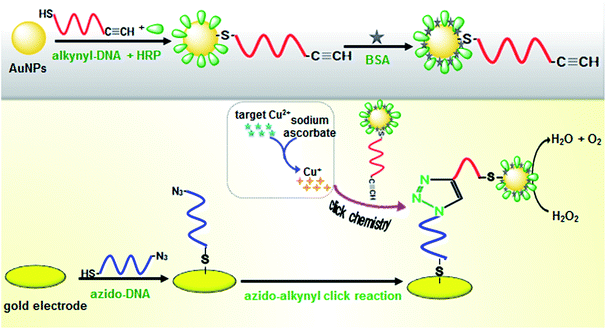
Herein, we report on the proof-of-concept of a novel electrochemical sensor for ultrasensitive detection of Cu2+ based on target-induced click conjugation. The signal was amplified through the HRP toward catalytic degradation of H2O2. The system mainly consisted of two single-stranded DNAs (azido-DNA and alkynyl-DNA) and AuNP–HRP signal multiple amplification probe. The copper ions could induce the click conjugation about azido-DNA and alkynyl-DNA, which resulted in the capture of numerous AuNP–HRP probes on the sensor surface. The AuNP–HRP probes (HRP as indicator and AuNP as enhancer) could catalytically degrade H2O2, thereby efficiently causing the differential pulse voltammetric peak signal. The detectable signal magnitude directly relied on the concentration of target Cu2+ in the sample. By monitoring the change in peak current, we could calculate the level of the target analyte with significant sensitivity, ultrahigh accuracy, and selectivity.
Experimental
Materials and apparatus
Standard solution of copper was provided by the National Center of Analysis and Testing for Nonferrous Metals and Electronic Materials (Beijing, China), 6-mercapto-1-hexanol (MCH), hydrochloroauric acid, tris(2-carboxyethyl)phosphine (TCEP), horseradish peroxidase (HRP), and L-sodium ascorbate were purchased from Sigma-Aldrich. Bovine serum albumin Fraction V (BSA) was purchased from GenView Sci. Inc. (USA). All chemicals were of analytical grade. A Tris–HCl buffer (10 mM Tris adjusted pH with 10 mM HCl) and a phosphate buffer saline (PBS, 100 mM) were used. The synthesized oligonucleotides were provided by Sangon Biotech. Co., Ltd. (Shanghai, China). The sequences were as follows: 5′-SH-CGACT TACGA GGCCA-N3-3′ (azido-DNA); 5′-SH-AACCA CGCAT GCATC-C![[triple bond, length as m-dash]](https://www.rsc.org/images/entities/char_e002.gif) CH-3′ (alkynyl-DNA); they were kept at −20 °C for further use.
CH-3′ (alkynyl-DNA); they were kept at −20 °C for further use.
Electrochemical measurements were carried out on a CHI660E electrochemistry system (Chenhua Instrument, Shanghai, China). The three-electrode system consisted of a gold electrode (4 mm in diameter) as the working electrode, an Ag–AgCl electrode as the reference electrode, and a Pt auxiliary electrode. Transmission electron microscopy (TEM) was obtained using a JEM-1200EX electron microscope (JEOL Ltd., Japan). A TGL-185M medical centrifuge (Pingfan Instrument, Changsha, China), an Agilent 7500ce inductively coupled plasma source mass spectrometer (ICP-MS) (Agilent Technologies Co. Ltd., USA) were used in the assay. All work was performed at room temperature (25 °C) unless otherwise mentioned.
Synthesis and bioconjugation of HRP–AuNP–alkynyl-DNA nanostructures
All glassware used in the following procedures was cleaned in a bath of freshly prepared nitrohydrochloric acid (3![[thin space (1/6-em)]](https://www.rsc.org/images/entities/char_2009.gif) :
:![[thin space (1/6-em)]](https://www.rsc.org/images/entities/char_2009.gif) 1 HCl–HNO3), thoroughly rinsed with double distilled water, and dried prior to use. Gold nanoparticles were prepared by adding 120 μL of 1% (w/w) sodium citrate solution into 10 mL of 0.01% (w/w) HAuCl4 boiling solution according to a literature procedure.29 The maximum adsorption of the synthesized gold colloids in the UV-Vis spectra were at 518 nm, and the solution was stored in a refrigerator in a dark-colored glass bottle for subsequent use. The particle sizes were confirmed by transmission electron microscopy (TEM).
1 HCl–HNO3), thoroughly rinsed with double distilled water, and dried prior to use. Gold nanoparticles were prepared by adding 120 μL of 1% (w/w) sodium citrate solution into 10 mL of 0.01% (w/w) HAuCl4 boiling solution according to a literature procedure.29 The maximum adsorption of the synthesized gold colloids in the UV-Vis spectra were at 518 nm, and the solution was stored in a refrigerator in a dark-colored glass bottle for subsequent use. The particle sizes were confirmed by transmission electron microscopy (TEM).
Finally, the as-synthesized AuNPs was used for the labeling of HRP and alkynyl-DNA. Before labeling, 5 mL of the as-prepared AuNP was adjusted to pH 9.0–9.5 using 0.1 M Na2CO3. Following that, 20 μL of 120 μg mL−1 alkynyl-DNA and 100 μL of 120 μg mL−1 HRP were simultaneously added to the colloids, followed by incubation for 12 h at 4 °C with gentle shaking. Afterwards, the mixture was centrifuged for 15 min at 1.4325g to obtain the HRP–AuNP–DNA conjugate. Finally, the HRP–AuNP–DNA nanostructures was dispersed into 1.0 mL of pH 7.4 PBS containing 1.0 wt% BSA, and stored at 4 °C.
Sensor fabrication
A gold electrode (4 mm in diameter) was initially polished on a polishing cloth with 0.3 μm and 0.05 μm (in diameter) alumina slurries, to obtain a mirror surface, sequentially, followed by successive sonication in ultrapure water, ethanol, Salpeter solution (a 1![[thin space (1/6-em)]](https://www.rsc.org/images/entities/char_2009.gif) :
:![[thin space (1/6-em)]](https://www.rsc.org/images/entities/char_2009.gif) 1 mixture of HNO3 and H2O), and ultrapure water for 5 min and dried in air. Prior to the experiment, the gold electrodes were cleaned with hot piranha solution (a 3
1 mixture of HNO3 and H2O), and ultrapure water for 5 min and dried in air. Prior to the experiment, the gold electrodes were cleaned with hot piranha solution (a 3![[thin space (1/6-em)]](https://www.rsc.org/images/entities/char_2009.gif) :
:![[thin space (1/6-em)]](https://www.rsc.org/images/entities/char_2009.gif) 1 mixture of H2SO4 and H2O2. Caution!) for 10 min and then continuously scanned within the −0.3 to 1.5 V potential range in freshly prepared deoxygenated 0.5 M H2SO4 until a voltammogram characteristic of the clean gold electrode was established.
1 mixture of H2SO4 and H2O2. Caution!) for 10 min and then continuously scanned within the −0.3 to 1.5 V potential range in freshly prepared deoxygenated 0.5 M H2SO4 until a voltammogram characteristic of the clean gold electrode was established.
To reduce the formation of the disulfides, the azido-DNA was left in 10 mM TCEP for 1 h. Then, the gold electrode was immersed into 100 mM PBS containing 1.0 M azido-DNA and 1.0 M NaCl (pH 7.4) for 2 h at room temperature. After rinsing with ultrapure water, the modified electrode was incubated with 1.0 mM 6-mercaptohexanol in 10 mM Tris–HCl buffer, pH 7.4, for 1 h. Next, the resulting sensing surface was washed with the washing buffer (100 mM PBS, pH 7.4), and dried with N2. Finally, the as-prepared sensor was suspended over pH 7.4 PBS at 4 °C for further use.
A mixture of HRP–AuNP–DNA, sodium ascorbate, and various concentrations of Cu2+ in reaction solution (100 mM PBS, 1 mM EDTA, 0.1 M NaCl, pH 7.4) (note: addition of EDTA was to avoid the effect of other minerals) was added to the modified gold electrode to initiate the click chemistry reaction for 12 h in darkness at room temperature. Herein, sodium ascorbate, as a reducing agent, could reduce Cu2+ to Cu+, and HRP–AuNP–DNA was reacted with the azido-DNA-modified electrode in a Cu+-catalyzed click reaction, resulting in the attachment of HRP–AuNP–DNA on the modified gold electrode. The added amount of sodium ascorbate was five times as much as the Cu2+ initial concentration at all times.30 Then, the modified gold electrode was washed with washing buffer. Finally, differential pulse voltammetric (DPV) measurement was carried out in 5 mL of pH 6.5 PBS containing 0.5 M H2O2 from 0.9 to 0.5 V (vs. Ag/AgCl) with a 50 mV pulse amplitude and a 50 ms pulse width. The current was collected and registered as the sensor signal.
Results and discussion
Design of the sensing strategy
Our new sensing strategy for Cu2+ determination is shown in Scheme 1. The assay was carried out as follows: HRP and thiolated alkynyl-DNA were linked on the AuNPs to form the HRP–AuNP–DNA signal probe through covalent conjugation.31 To construct the sensor surface, thiolated azido-DNA was covalently bonded on the working electrode through specific Au–S interactions. Next, the sensor surface was blocked by means of MCH to reduce non-specific adsorptions. Subsequently, Cu2+ in the testing media could be reduced to Cu+ by sodium ascorbate, which catalyzed the click reaction between the azido-DNA immobilized on the sensor surface and the DNA–AuNP–HRP, resulting in the capture of numerous HRP molecules on the sensor surface. The captured HRP could catalyze the degradation of H2O2, which is monitored by the DPV, and the digital reading correlated to the amount of the peroxidase indirectly reflecting the Cu2+ concentration in the testing media. With increasing Cu2+ concentration more Cu+ ions were generated and more DNA–AuNP–HRP conjugates were clicked onto the sensor surface, which resulted in the decomposition of more H2O2 molecules. To realize our design, the successful preparation of HRP–AuNP–DNA was very crucial. Therefore, we utilized transmission electron microscopy (TEM) and UV-Vis absorption spectroscopy to investigate the nanostructures. Fig. 1A shows typical TEM image of the as-synthesized gold nanoparticles with an average size of 16 nm. As seen from curve ‘a’ in Fig. 1B, an evident characteristic peak at 518 nm was obtained toward the newly synthesized gold colloids.29 Furthermore, we also investigated the UV-Vis absorption spectra of AuNPs after conjugation with HRP and alkynyl-DNA. As shown in curve ‘b’ in Fig. 1B, the absorption peak shifted from 518 to 527 nm, indicating the formation of bioconjugates.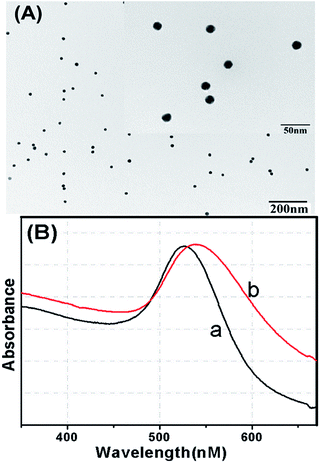 | ||
| Fig. 1 (A) TEM image of gold nanoparticles; (B) UV-Vis absorption spectroscopy images of (a) gold nanoparticles and (b) HRP–AuNP–DNA. | ||
Electrochemical characteristics of the electrochemical sensors
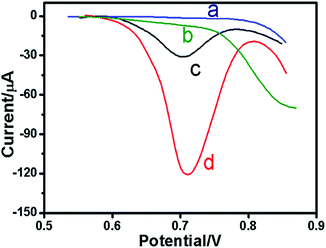
In the present study, the electrochemical signal was mainly derived from the labeled HRP on the AuNP toward direct electrocatalysis of H2O2 after the target-induced click reaction on the electrode. To realize our design, the different signal probes and detection protocols were monitored in pH 6.5 PBS using DPV (Fig. 2). As seen from curve ‘a’ in Fig. 2, no redox peak was observed at the newly prepared sensor without the H2O2. Without target copper ions and corresponding reducing agent, cuprous ions were inexistent as the catalyst for click reaction; therefore no redox peak (curve ‘b’) was observed. However, a puzzling question arises to whether the strong signal derived from HRP-labeled gold nanoparticles. To verify this issue, the probe (AuNPs–alkynyl-DNA) was used for the target determination. From curve ‘c’, the peak value was low and the reason should be that the gold colloid can catalyze the reduction of H2O2. The largest current response was obtained in curve ‘d’. Compared to the peak current response of curve ‘c’, there was more than 200% increase, which can confirm the signal amplification function.Optimization of experimental conditions
The signal of the voltammetric peak is usually related to the detection solution pH within the applied potentials. Fig. 3A gives the dependence of voltammetric peaks on the pH of testing solution. The currents initially increased with increasing pH of PBS from pH 4.5 to pH 6.5, and then decreased. The optimal current was obtained at pH 6.5. The reason could be that higher or lower pH values affect the activity of the immobilized HRP on the AuNP. Therefore, pH 6.5 of PBS was used as the detection solution for quantitative copper ion monitoring.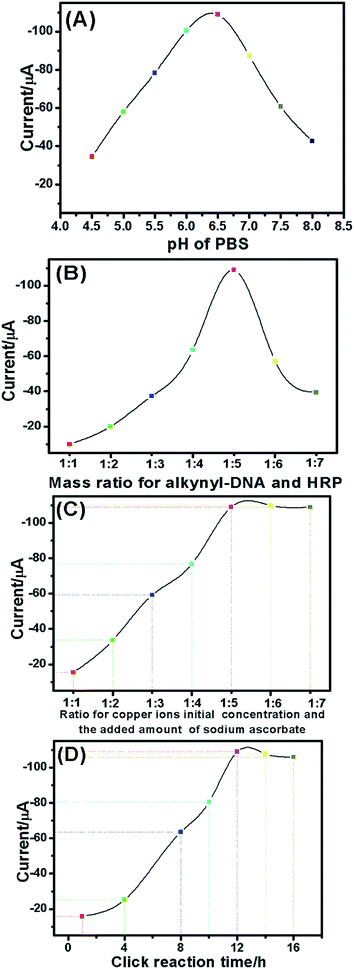 | ||
| Fig. 3 Effects of (A) pH of PBS, (B) mass ratio for alkynyl-DNA and HRP, (C) ratio of copper ions' initial concentration and the added amount of sodium ascorbate and (D) click reaction time. | ||
The ratio of HRP and alkynyl-DNA for the preparation of HRP–AuNP–DNA was also crucial. Although excess alkynyl-DNA can increase the possibility of the click reaction, it decreases the amount of HRP, thus facilitating the low-sensitivity detection for target analyte.31Fig. 3B represents the effect of the developed assay. A maximum electrochemical signal was obtained at 5![[thin space (1/6-em)]](https://www.rsc.org/images/entities/char_2009.gif) :
:![[thin space (1/6-em)]](https://www.rsc.org/images/entities/char_2009.gif) 1 (w/w) of HRP and alkynyl-DNA; this observation was utilized to synthesize the HRP–AuNP–DNA in this study.
1 (w/w) of HRP and alkynyl-DNA; this observation was utilized to synthesize the HRP–AuNP–DNA in this study.
Fig. 3C shows the effect of ratio for Cu2+ initial concentration and the sodium ascorbate on the current of the electrochemical assay. The results indicated that the currents increased with increasing amount of sodium ascorbate, and tended to level off for ratios higher than 1![[thin space (1/6-em)]](https://www.rsc.org/images/entities/char_2009.gif) :
:![[thin space (1/6-em)]](https://www.rsc.org/images/entities/char_2009.gif) 5. Under the quintuple sodium ascorbate condition, Cu2+ can be completely reduced to Cu+. Therefore, 1
5. Under the quintuple sodium ascorbate condition, Cu2+ can be completely reduced to Cu+. Therefore, 1![[thin space (1/6-em)]](https://www.rsc.org/images/entities/char_2009.gif) :
:![[thin space (1/6-em)]](https://www.rsc.org/images/entities/char_2009.gif) 5 was chosen for the click reaction.
5 was chosen for the click reaction.
To achieve a high electrochemical signal, the click reaction time between the alkynyl-DNA and azido-DNA is very important. A short reaction time is not favorable for the formation of five-membered heterocycles. As shown in Fig. 3D, the steady-state current was acquired after 12 h. Therefore, 12 h were insufficient for the formation of the five-membered heterocycles.
Selectivity of the electrochemical sensor
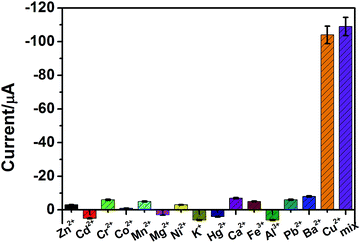
The specificity of the developed electrochemical sensor was evaluated by testing the system against other metal ions, e.g., K+, Ba2+, Ca2+, Cd2+, Co2+, Cr2+, Hg2+, Mg2+, Mn2+, Ni2+, Pb2+, Zn2+, Al3+, and Fe3+. As shown in Fig. 4, the presence of 1 μM Cu2+ ions caused a significant increase in the electrochemical signal and showed a clear difference from the other metal ions. These results also revealed that Cu+ (Cu2+ reduced) induced azide–alkyne click reaction, thus enabling the degradation of substrate (H2O2). Hence the developed azide–alkyne click reaction-based sensing platform could be used for specific detection of the target copper ions.Detectability of the sensor
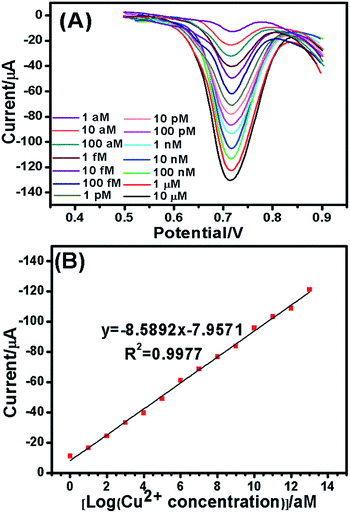
By virtue of the optimal conditions, the quantitative and sensitivity ranges of the proposed sensor were evaluated on the click conjugation-modified electrode toward Cu2+ standard based on the AuNP–HRP signal multiple amplification strategy. The assay was carried out using DPV. As mentioned above, in the absence of Cu2+, the signal was not detected. As displayed in Fig. 5A, the response signal increased with increasing Cu2+ concentration from 1.0 aM to 10 μM. A good linear relationship (Fig. 5B) between the response signal and Cu2+ level was obtained, and the linear regression equation was I (μA) = −8.5892 × (log![[thin space (1/6-em)]](https://www.rsc.org/images/entities/char_2009.gif) CCu2+)/10−18 − 7.9571 (μM), (R2 = 0.9977), and Cu2+ as low as 0.38 aM could be unambiguously detected. This sensitivity was certainly comparable to those of the existing detection schemes: DNAzyme unimolecular probe-based colorimetric detection (1.0 μM),32 ratiometric electrochemical biosensor (80.2 nM),33 molecularly imprinted electrochemical sensor (42.4 pM),34 TiO2 sphere-based impedimetric sensor (4.29 pM),35 and so on. Such a high sensitivity was primarily due to the significant dual signal amplification.
CCu2+)/10−18 − 7.9571 (μM), (R2 = 0.9977), and Cu2+ as low as 0.38 aM could be unambiguously detected. This sensitivity was certainly comparable to those of the existing detection schemes: DNAzyme unimolecular probe-based colorimetric detection (1.0 μM),32 ratiometric electrochemical biosensor (80.2 nM),33 molecularly imprinted electrochemical sensor (42.4 pM),34 TiO2 sphere-based impedimetric sensor (4.29 pM),35 and so on. Such a high sensitivity was primarily due to the significant dual signal amplification.
Analysis of Cu2+ spiked in tap water samples
To investigate the possible application of our strategy for analysis of real samples, tap water samples were spiked using Cu2+ standards with different concentrations, and then they were assessed using the electrochemical sensor and inductively coupled plasma mass spectrometry (ICP-MS) as a reference method, respectively (note: these spiked water samples should be adjusted to pH 7.4 using 0.1 M PBS containing 0.1 M NaCl prior to measurement). The results are summarized in Table 1. When Cu2+ concentration was more than 0.1 μM, the results obtained from two methods were basically the same (RSD ≤ 4.6%). In contrast, the low-concentration (≤0.1 μM) Cu2+ standards were detected by ICP-MS with difficulty. These results once again testify to the ultrahigh sensitivity of the signal-amplification strategy and also indicate that the developed method had outstanding accuracy for copper ions.Conclusion
We report the proof-of-concept for a new signal-amplification strategy with HRP-functionalized gold nanoparticles for sensitive electrochemical sensing of target Cu2+ in environmental water samples. By coupling AuNP–HRP-based signal amplification with target-induced click conjugation, a low-concentration Cu2+ sample (0.38 aM) could be unambiguously detected within a linear range from 1.0 aM to 10 μM. In contrast to previous reports,32–35 the detectable sensitivity could be enhanced using the developed strategy. Importantly, the LOD of the electrochemical sensor was evidently lower than those of WHO and EPA towards Cu2+ ion in drinking water (32 μM and 20 μM, respectively). Moreover, our system exhibited good selectivity against other common divalent metal ions. In addition, the developed sensor was successfully applied to determine Cu2+ in environmental water samples with good accuracy and excellent recovery.Acknowledgements
This study was financially supported by the Chongqing Science & Technology Commission, China (No. CSTC2015JCYJBX0126 and CSTC2016SHMSZX20001) and the Scientific Research Foundation of Chongqing University of Arts and Sciences (No. R2013CJ03).References
- M. Sayadi, M. Rezaei and A. Rezaei, Environ. Monit. Assess., 2015, 187, 1–11 CrossRef CAS PubMed.
- Y. Kim, H. Kim, J. Kim and H. Kim, Adv. Mater., 2008, 20, 4428–4432 CrossRef CAS.
- Q. Liu, Q. Fei, Y. Fei, Q. Fan, H. Shan, G. Feng and Y. Huan, Spectrochim. Acta, Part A, 2015, 151, 785–789 CrossRef CAS PubMed.
- C. Ocaña, N. Malashikhina, M. del Valle and V. Pavlov, Analyst, 2013, 138, 1995–1999 RSC.
- A. Tong, Y. Akama and S. Tanaka, Analyst, 1990, 115, 947–949 RSC.
- A. Gonzáles, M. Firmino, C. Nomura, F. Rocha, P. Oliveira and I. Gaubeur, Anal. Chim. Acta, 2009, 636, 198–204 CrossRef PubMed.
- T.-W. Lin and S.-D. Huang, Anal. Chem., 2001, 73, 4319–4325 CrossRef CAS PubMed.
- J. Wu and E. A. Boyle, Anal. Chem., 1997, 69, 2464–2470 CrossRef CAS PubMed.
- J. S. Becker, A. Matusch, C. Depboylu, J. Dobrowolska and M. Zoriy, Anal. Chem., 2007, 79, 6074–6080 CrossRef CAS PubMed.
- L. Yang, B. Hu, Z. Jiang and H. Pan, Microchim. Acta, 2004, 144, 227–231 CrossRef CAS.
- C. Zong, K. Ai, G. Zhang, H. Li and L. Lu, Anal. Chem., 2011, 83, 3126–3132 CrossRef CAS PubMed.
- H. S. Jung, P. S. Kwon, J. W. Lee, J. I. Kim, C. S. Hong, J. W. Kim, S. Yan, J. Y. Lee, J. H. Lee and T. Joo, J. Am. Chem. Soc., 2009, 131, 2008–2012 CrossRef CAS PubMed.
- Z. Yuan, N. Cai, Y. Du, Y. He and E. S. Yeung, Anal. Chem., 2014, 86, 419–426 CrossRef CAS PubMed.
- A. Chen and S. Chatterjee, Chem. Soc. Rev., 2013, 42, 5425–5438 RSC.
- Z. Lin, Y. Takahashi, T. Murata, M. Takeda, K. Ino, H. Shiku and T. Matsue, Angew. Chem., Int. Ed., 2009, 48, 2044–2046 CrossRef CAS PubMed.
- P. Phillips, G. Stuber, M. Heien, R. Wightman and R. Carelli, Nature, 2003, 422, 614–618 CrossRef CAS PubMed.
- D. Wei, M. J. Bailey, P. Andrew and T. Ryhänen, Lab Chip, 2009, 9, 2123–2131 RSC.
- Y. Liang, Y. Liu, X. Guo, P. Ye, Y. Wen and H. Yang, Sens. Actuators, B, 2014, 201, 107–113 CrossRef CAS.
- C. Chen, Q. Xie, L. Wang, C. Qin, F. Xie, S. Yao and J. Chen, Anal. Chem., 2011, 83, 2660–2666 CrossRef CAS PubMed.
- Z. Lin, X. Li and H. Kraatz, Anal. Chem., 2011, 83, 6896–6901 CrossRef CAS PubMed.
- G. Aragay, F. Pino and A. Merkoci, Chem. Rev., 2012, 112, 5317–5338 CrossRef CAS PubMed.
- H. Jans and Q. Huo, Chem. Soc. Rev., 2012, 41, 2849–2866 RSC.
- C. Wu, Z. Liu, H. Sun, X. Wang and P. Xu, Biosens. Bioelectron., 2016, 79, 843–849 CrossRef CAS PubMed.
- J. Su, J. Xu, Y. Chen, Y. Xiang, R. Yuan and Y. Chai, Biosens. Bioelectron., 2013, 45, 219–222 CrossRef CAS PubMed.
- V. Rostovtsev, L. Green, V. Fokin and K. Sharpless, Angew. Chem., Int. Ed., 2002, 114, 2708–2711 CrossRef.
- Q. Wang, T. Chan, R. Hilgraf, V. Fokin, K. Sharpless and M. Finn, J. Am. Chem. Soc., 2003, 125, 3192–3193 CrossRef CAS PubMed.
- A. Deiters, T. Cropp, M. Mukherji, J. Chin, J. Anderson and P. Schultz, J. Am. Chem. Soc., 2003, 125, 11782–11783 CrossRef CAS PubMed.
- M. Davies, Polyhedron, 1992, 11, 285–321 CrossRef CAS.
- G. Frens, Nature, 1973, 241, 20–22 CAS.
- Y. Zhou, S. Wang, K. Zhang and X. Jiang, Angew. Chem., Int. Ed., 2008, 120, 7564–7566 CrossRef.
- T. Xu, H. Zhang, X. Li, Z. Xie and X. Li, Biosens. Bioelectron., 2015, 73, 167–173 CrossRef CAS PubMed.
- B. Yin, B. Ye, W. Tan, H. Wang and C. Xie, J. Am. Chem. Soc., 2009, 131, 14624–14625 CrossRef CAS PubMed.
- L. Zhang, Y. Han, F. Zhao, G. Shi and Y. Tian, Anal. Chem., 2015, 87, 2931–2936 CrossRef CAS PubMed.
- J. Li, L. Zhang, G. Wei, Y. Zhang and Y. Zeng, Biosens. Bioelectron., 2015, 69, 316–320 CrossRef CAS PubMed.
- M. Kang, M. Wang, S. Zhang, X. Dong, L. He, Y. Zhang, D. Guo, P. Wang, S. Fang and Z. Zhang, Electrochim. Acta, 2015, 161, 186–194 CrossRef CAS.
| This journal is © The Royal Society of Chemistry 2017 |

