DOI:
10.1039/C7RA07574J
(Paper)
RSC Adv., 2017,
7, 47500-47506
Influence of lead-free glass frit in the front contact paste on the conversion efficiency of polycrystalline silicon solar cells
Received
10th July 2017
, Accepted 4th October 2017
First published on 10th October 2017
Abstract
Due to the demand for a new environmentally friendly silver front conductive paste, it is imperative for silicon solar cells to use nontoxic lead-free glass frits. In the present paper, three kinds of Bi–Te–B–Si–P–O lead-free glass frits with different mass fraction ratios of B2O3/SiO2 (10/4, 6/8, and 2/12) were prepared by a melt cooling route. First, we investigated that the effect of those B2O3/SiO2 ratios on the transition temperature (Tg) of glass frits, and their Tg were 311 °C, 347 °C, and 366 °C, respectively. Then, the influence of Tg on cross-sectional microstructures of the front-silver electrodes, the Ag crystallites distribution on Si substrate, and electrical performance were studied. The fabricated solar cell showed the lowest series resistance (0.0017 Ω) and the highest photoelectric conversion efficiency (18.260%) based on the glass frit Tg of 347 °C. This is because the dense thick-film Ag grid can reduce the bulk resistance of the grid line. Besides, the glass frit with the Tg of 347 °C could control the growth and homogeneous distribution of silver crystallites in the glass layer and silicon substrate, which contributed to forming good ohmic contacts and tunneling effect with enough energy photoelectrons. The result was compared with the solar cell fabricated with a classical Pb-based glass frit with the conversion efficiency (18.230%) using the same device configuration, which indicated the designed lead-free glass frit could be a suitable substitute for a Pb-based glass frit for preparing environmentally friendly front-side silver paste for crystalline silicon solar cells.
Introduction
Crystalline silicon solar cells have attracted remarkable attention in recent years as a promising renewable clean energy source because of their high photoelectric conversion efficiency and dependable mass production.1–3 In the industrialization of high yield production, the front-side silver conductive thick films are achieved by screen printing which is a low cost and time-effective option compared with other metallization techniques and rapid thermal processing.4–7 Generally, the main constituents of silver conductive paste are as follows: silver powders, glass frits, and resin binder.8–10 Optimizing the glass frits of the Ag paste can help achieve good-quality thick-film ohmic contacts.11 During the rapid sintering of the Ag paste, the glass frit merely holds 2–5 wt% as a binder and has a significant effect on the front-side metallization contact formation and forming an electrical contact between the Ag electrode and Si wafer. Through corrupting antireflection coating (ARC) on the surface of the Si wafer, Ag crystallites will grow on the silicon emitter surface. What is more, glass frit is crucial for the adhesion strength of Ag electrode to Si wafer and total resistance of the electrode.12–17
Currently, Pb-based glass is almost widely used to the industry on account of excellent electrical and mechanical properties. However, the use of lead is harmful to people health and the environment. With the attention to environmental pollution and global climate change, the preparation and research of the lead-free silver paste had attracted wide attention. In previous studies, the use of lead-free glass frit in Ag paste has been investigated.18–22 Jeon et al.23 reported the influence of particle size of lead-free glass frit in the front contact paste on the conversion efficiency of silicon solar cell. When the glass frit with a small mean particle size was used, the silver paste had a higher FF and Eff. Kim et al.24 prepared the Bi–Zn–Si–B–Al–Ca–O glass frit with spherical shape and submicron size, obtained glass frit improve the sintering characteristics of the silver powders at 700 °C to form the silver conducting film with dense structure and high adhesion strength to the Si substrate. Che et al.2 reported that nanosized glass frit powders showed an excellent wetting behavior and etching effects on SiNx coating and silicon compared to micrometer-sized frits. There was a glass layer at the interface between the Ag grids and Si emitter for Pb- or Bi-based glass, however, Jiang et al.25 developed a new Pb-free Ag paste with a SnO–P2O5 glass frit that revealed no glass layer at the interface between the Ag grids and Si emitter for front contact electrodes of crystalline silicon solar cells. So far, the actual electrical contact formation pathway remained barely understood, Fields J. D. et al.26 believed that achieving optimal firing conditions to minimize contact resistance, and to develop new pastes with alternative materials (that is, earth-abundant and non-toxic), required a detailed understanding of the contact formation process by situ X-ray diffraction (XRD). The Tg of the glass frit is one of the most significant properties that determine the glass behavior. Therefore, it is essential to prepare the glass frit with appropriate Tg for front contact silver paste to obtain good ohmic contact.
In order to better understand the function of Tg of the glass frit, we focused on the preparation of three lead-free glass frits with different Tg by changing B2O3/SiO2 mass fraction ratios to understand how to form better contact quality. The surface morphology of the shattered glass frit, the cross-sectional microstructures of the front-silver electrodes and the Ag crystallites distribution on Si substrate were observed by SEM, the size and quantity of Ag crystallites were affected by Tg, which influenced the quality of interfacial structure and the electrical performance of silicon solar cell. Finally, a simple schematic, which explained the size of Ag crystallites and the dissolution of silver particles, was designed based on final results.
Experimental
Materials
All the raw materials used for the preparation of glass frit were shown below, Bi2O3 (≥99.5%, Zhengzhou PainI), TeO2 (≥99.0%, Tianjin Yaohua), HBO3 (≥99.5%, Tianjin Fuchen), SiO2 (≥99.9%, Sinopharm Chemical Reagent Co., Ltd) and P2O5 (≥98.0%, Tianjin Kermel Chemical Reagent Co., Ltd.), the Pb-based glass frit have been purchased from Korea.
Preparation of glass frit powders
The compositions of Bi–Te–B–Si–P–O glass frit with different B2O3/SiO2 mass fraction ratios were shown in Table 1. Bi–Te–B–Si–P–O glass frit for the front contact paste in polycrystalline silicon solar cells were prepared by melt cooling route. All metallic oxides were mixed uniformly in an agate mortar for 30 min, then were heated at 1200 °C for 30 min at this temperature in an aluminum crucible at a heating rate of 10 °C min−1 in a muffle furnace. The melt was cooled quickly to room temperature by pouring the melt into the deionized water. Subsequently, the Bi–Te–B–Si–P–O glass frits with D50 of 0.5–2 μm were obtained prior to further use regardless of the glass composition by using a air pulverizer (Mianyang Liuneng Powder Equipment Co., Ltd., SB100A/20A, China). The average particle sizes and size distributions were measured using a laser size distribution analyzer (BT-9300-H, Dandong City Baxter Instrument Co., Ltd.). These three kinds of glass frits were named as GF-1, GF-2, and GF-3, respectively.
Table 1 Experimental compositions of Bi–Te–B–Si–P–O system glass frits (wt%)
| Frit ID |
Bi2O3 |
TeO2 |
B2O3 |
SiO2 |
P2O5 |
Others |
Sum |
Transition temperature (Tg/°C) |
| GF-1 |
32.4 |
40.6 |
10 |
4 |
2.5 |
10.5 |
100 |
311 |
| GF-2 |
32.4 |
40.6 |
6 |
8 |
2.5 |
10.5 |
100 |
347 |
| GF-3 |
32.4 |
40.6 |
2 |
12 |
2.5 |
10.5 |
100 |
366 |
Preparation of organic vehicle
The uniform stoichiometric mixed solvents that butyl carbitol, terpineol, N-butyl butyrate and tributyl citrate were added into a three-necked flask. Then a certain quality of thickener (EC), thixotropic agents, surfactant (sorbitan trioleate), and bonding agent (silane coupling agent KH-570) were added sequentially. The materials were mechanically stirred around 90–110 °C in a oil bath with stirring for 2 h and then cooled naturally to room temperature after complete reaction.
Preparation of glass paste
The glass paste was prepared to observe the wetting behavior and etching effect of the glass frit on ARC and the reaction with silicon wafer. Subsequently, by mixing 83 wt% the as-prepared glass frit powders and 17 wt% organic vehicle to prepare test paste. Then the glass paste was deposited on silicon substrate with ARC by screen printing. Next the sample was fired in a tube furnace at 800 °C for 10 min.
Screen printing Ag paste
In this experiment, optimum particle size of silver (purchased from Xi'an Jingsheng Light Technology Co., Ltd., China), Bi–Te–B–Si–P–O glass frit, and the organic vehicle were homogeneously mixed to prepare silver paste. The semi-finished product went through three-roll grinding machine (Puhler, PTR65C) for several times with the shear gap parameters varied from large to small. Different Ag pastes with different glass frits were prepared (denoted as PS1, PS2, and PS3). For comparison, an additional reference silver paste was prepared by mixing the same silver particles, classical Pb-based glass frit and same organic vehicle, denoted as PS4. Then paste was printed on a multi-crystalline Si wafers with area of 156 × 156 mm2, thickness of 200 μm, and sheet resistivity of 80 Ω □−1. The sizes of complex network meshes used were 360 meshes. The thickness of emulsion was 15 μm. The line-diameter and line-width of pattern was 16 μm, 36–38 μm, respectively. Subsequently, the wafers were dried in an oven at 100 °C for 30 min, the printed paste was fired in a tube furnace at 800 °C at a belt speed of 235 inch per min, 5969 mm min−1 for 3 min to obtain the Ag electrode.
Measurements
The amorphous state of as-prepared glass frits were investigated with an X-ray diffractometer (XRD, D/Max-3C, Rigaku, Japan) using Cu Kα radiation. The glass transition temperature (Tg) of different glass frit powers were recorded by a thermo-gravimetric analyzer and Differential Scanning Calorimeter (Netzch TGA/DSC) at the heating rate of 20 K min−1. The infrared spectra were recorded with an FT-IR spectrometer (Nicolet NEXU S670). The surface morphologies of the shattered glass frit and the cross-sectional microstructures of the front-silver electrodes were observed by scanning electron microscopy (SEM) (Quanta 400 FEG instrument, Oxford INCA 35 detector, 25 kV). The 3D morphology and aspect ratio of the electrode was measured by 3D digital microscope (QUESTAR, RH-2000). The photoelectric property of polycrystalline silicon solar cells were studied using an EKO I-V Tracer under standard testing condition (STC): solar radiation of 1000 W m−2 at 25 °C.
Chemical etching was used to obtain the surface morphology of the cells, which usually included two steps: (a) aqua regia (HCl 32% + HNO3 65%, 3![[thin space (1/6-em)]](https://www.rsc.org/images/entities/char_2009.gif) :1, t = 1 h) etches the silver from the finger bulk; (b) 3% HF solution (t = 10 min) etches the glass layer at room temperature, leaving the Ag-crystallites grown in the emitter.
:1, t = 1 h) etches the silver from the finger bulk; (b) 3% HF solution (t = 10 min) etches the glass layer at room temperature, leaving the Ag-crystallites grown in the emitter.
Results and discussion
The morphology and microstructure Bi–Te–B–Si–P–O glass frit
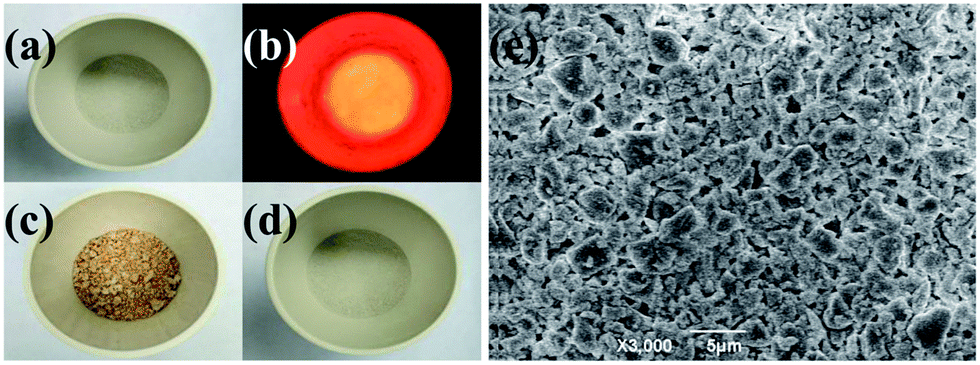
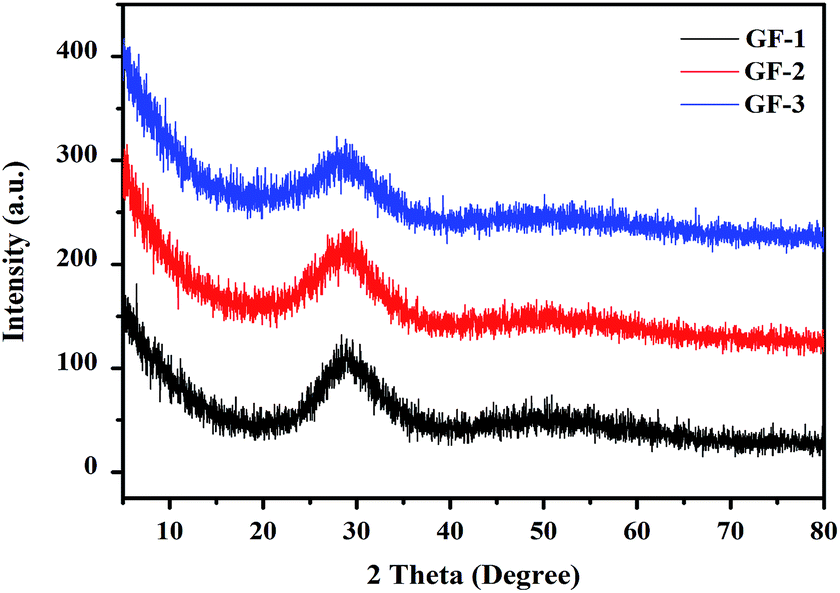
Bi–Te–B–Si–P–O glass frits were prepared by melt cooling route. As shown in Fig. 1a–d, all metallic oxides were mixed uniformly (1a), melted (1b), quenched (1c) and shattered (1d). Fig. 1e showed the morphology of the glass frit. In order to study the microstructure, the XRD patterns of the Bi–Te–B–Si–P–O glass frit powders were exhibited in Fig. 2. As can be seen from the figure, without any sharp peaks, only broad peak can be found at around 28°, which indicated that glass frit powders were amorphous, without crystal precipitation.
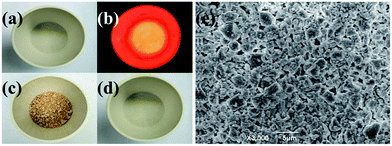 |
| | Fig. 1 The simple flow chart and SEM micrographs of Bi–Te–B–Si–P–O glass frit prepared by the traditional melting route. | |
 |
| | Fig. 2 XRD pattern of different Bi–Te–B–Si–P–O glass frit. | |
The structure analysis and thermal properties of Bi–Te–B–Si–P–O glass frit
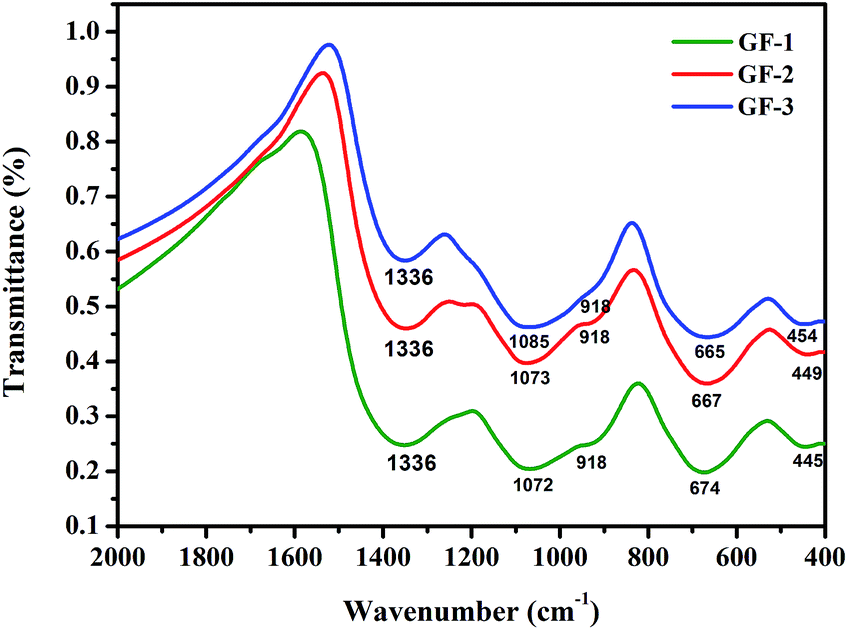
The glass frit IR spectra were shown in Fig. 3. Although B2O3 has subtle changes, the samples showed analogical absorption bands. The vibration types of the investigated glasses were summarized in Table 2. By analyzing the spectra, the bands at about 450 cm−1 are ascribed to the Bi–O–Bi in the [BiO6] octahedral units27–29 and the Si–O bend vibration.30 The infrared spectra in the range of about 680 cm−1 is due to the bending vibration of B–O–B in [BO3] triangles.31,32 The bands at around 918 cm−1 may be due to the symmetric stretching vibrations of [BiO3] and [BiO6] polyhedral,29 it can be deduced that [BiO3] trigonal and [BiO6] octahedral units constitute the bismuthate structure of studied glasses. The wide spectral at around 1070 cm−1 is due to the B–O–B stretch vibration in [BO4]. The result indicates that the addition of Bi2O3 to glass frit maybe cause a effective conversion of [BO3] units to [BO4] units.33 The bands ranging from 1320 cm−1 to 1340 cm−1 are assigned to the B–O bonds in BO3.29
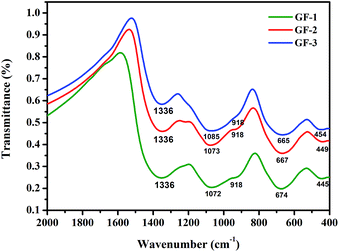 |
| | Fig. 3 The infrared spectra of Bi–Te–B–Si–P–O glass frit powders. | |
Table 2 Vibration types of different IR wave numbers
| Wave number (cm−1) |
Vibration types |
| 420–520 |
Bi–O–Bi in the [BiO6] octahedral units27–29 |
| 440–470 |
Bridging oxygen bending in the Si network30 |
| 680–720 |
Bending vibration of B–O–B in [BO3] triangles28,29 |
| Around 900 |
Symmetric stretching vibrations of [BiO3] and [BiO6] polyhedral29 |
| Around 1080 |
Stretching vibration of [BO4] tetrahedron33 |
| 1310–1340 |
[BO3] vibration29 |
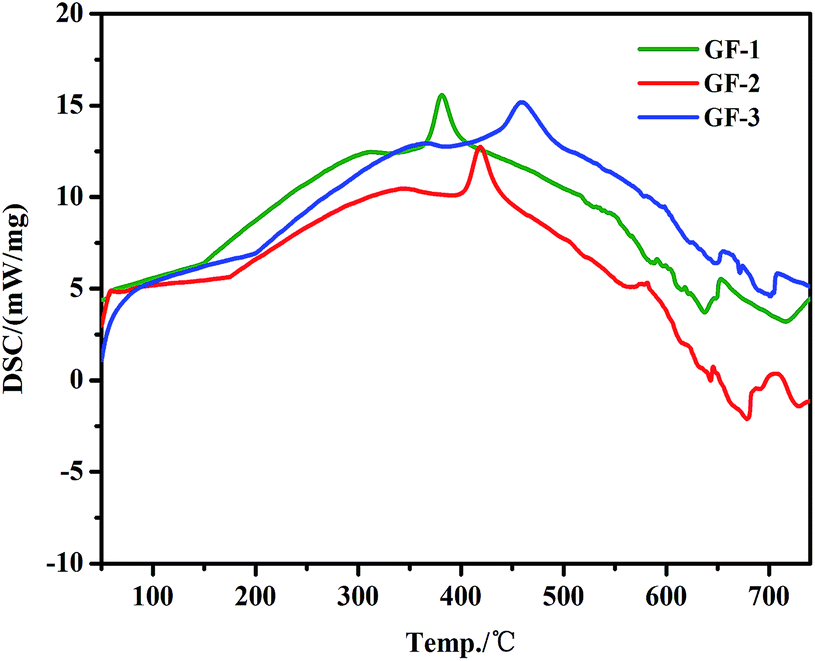
The DSC curves of GF-1, GF-2, and GF-3 samples were showed in Fig. 4. The onset point of the first large peak represented the Tg of glass frit, which were summarized in Table 1. The range of Tg for glass frits was changed from 311 °C to 366 °C by decreasing the content of B2O3. The data in Table 1 and Fig. 3 show that, by changing B2O3/SiO2 ratio, the Tg of glass frit gradually increased as decreasing the content of B2O3. The major reason is that, with increasing the content of B2O3, [BO3] gradually was replaced. As [BO3] has relatively poor stability, it is easy to be destroyed, which caused the reduction of the Tg of the glass frits. However, expansion coefficient of the glass frit will increase with B2O3 massive introduction, which lead to not matching with expansion coefficient of the wafer and wafer burst ultimately.
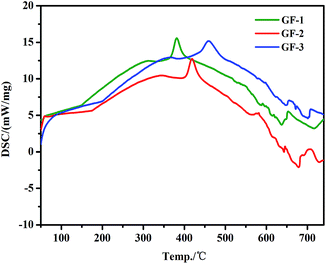 |
| | Fig. 4 DSC curve of the Bi–Te–B–Si–P–O glass frit. | |
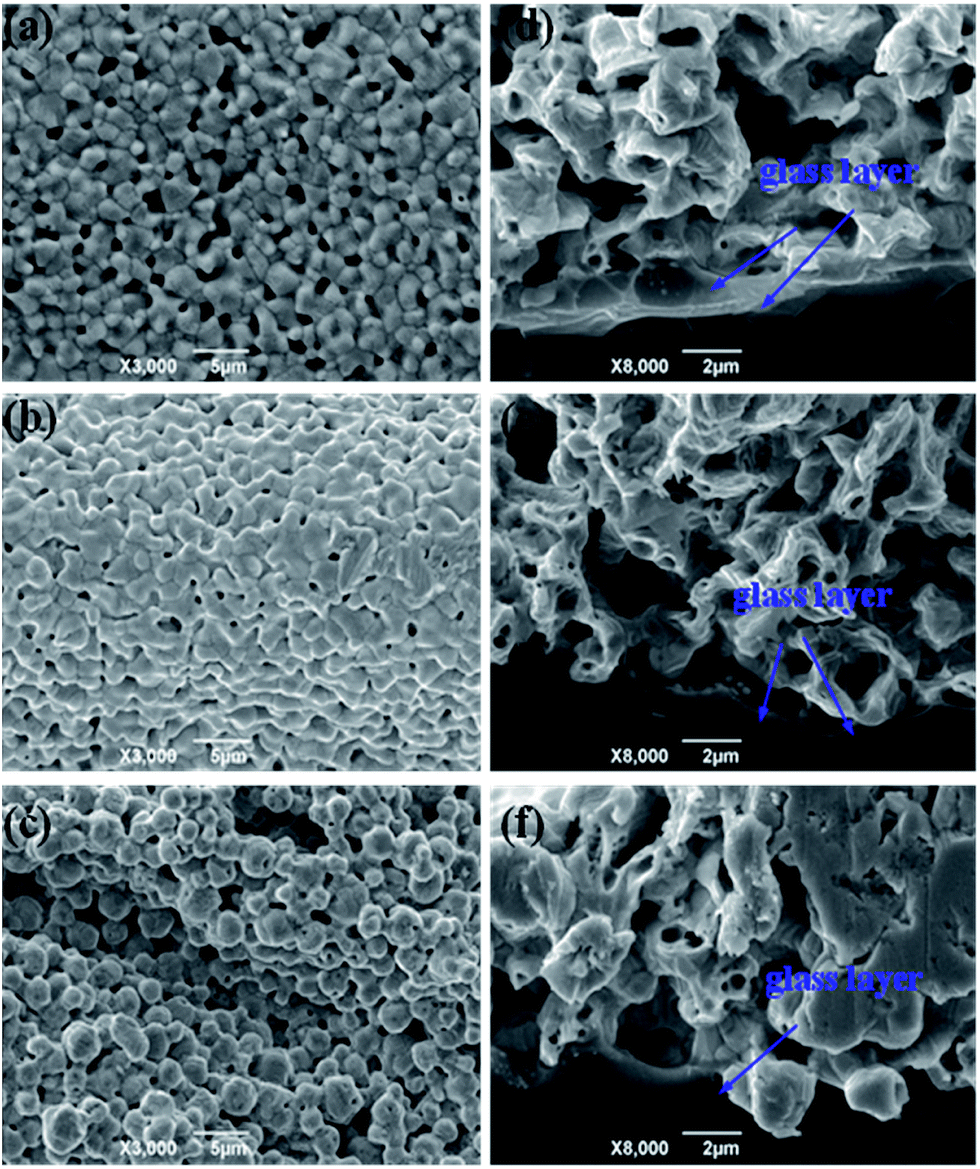
The effect of properties of glass frit on etching ARC and Si substrate
The cross-section SEM images of the glass fingers deposited by screen printing on silicon wafer with SiNx coating are shown in Fig. 5 (denoted as GP1, GP2, and GP3). During the rapid sintering of the glass paste, the glass frit begin getting fluid phase to wet and corrupt ARC on the surface of the Si wafer, then a few pores and small precipitates were observed in Fig. 5, followed by etching on silicon wafer, which indicated that the glass frit showed excellent wetting behavior and etching effect on SiNx coating and silicon substrate. The small precipitates should be Bi and few pores should generate N2, which can be explained by the following deduced redox reactions2,7:| | |
2Bi2O3-glass + 3SiNx → 4Bi + 3SiO2 + 3x/2N2
| (1) |
| | |
2Bi2O3-glass + 3Si → 4Bi + 3SiO2
| (2) |
 |
| | Fig. 5 Cross-section SEM images of the glass fingers deposited on silicon wafer with SiNx coating by screen printing: (a) GP1; (b) GP2; (c) GP3. | |
As showed in Fig. 5, many large precipitates and pores could be observed in glass paste (Fig. 5a), probably due to the higher content of B2O3, during sintering, the viscosity of glass frit with lower Tg decreases dramatically, which reacted with SiNx coating and silicon substrate for a very long time, contributing to the formation of large pores. A few holes could be noticed using the GF-3 sample (Fig. 5c), as Tg of GF-3 was higher, the glass frit not easily wetted SiNx coating, as a result, the glass frit not corrupt SiNx coating completely, which in turn lead to poor contact with Si substrate. The glass frit using the GF-2 sample with moderate Tg (Fig. 5b) relatively glossy and denser. Finally, the glass frit etched the SiNx layer and formed compact contact with Si substrate. In summary, the content of B2O3 affected the Tg of glass frit, and then influence on etching SiNx coating and Si substrate.
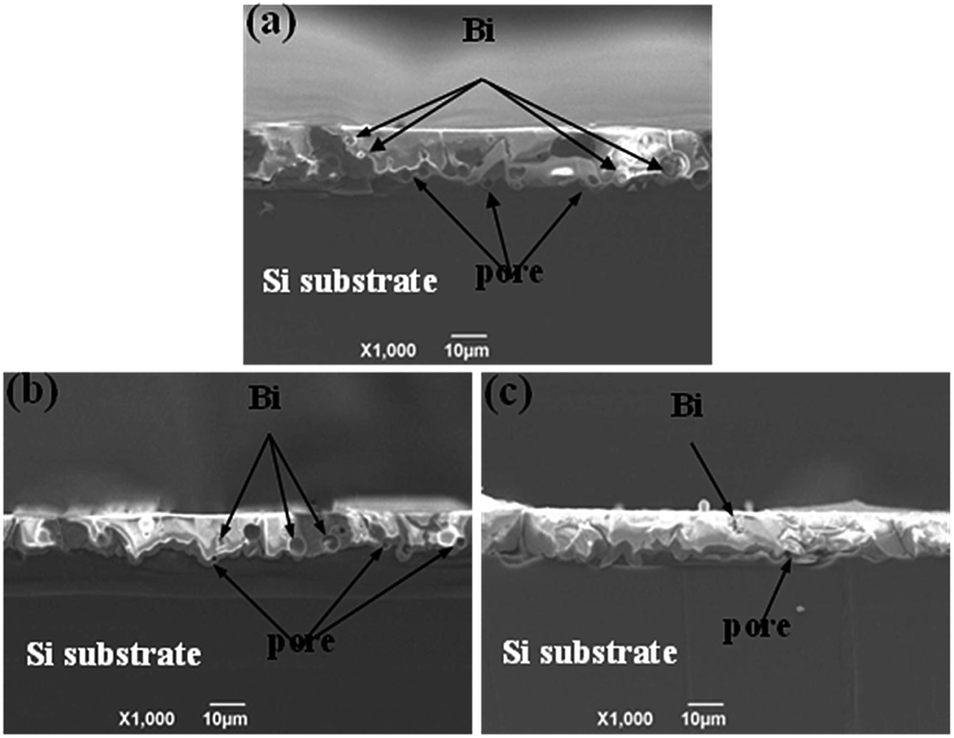
The effect of the Tg on the morphology of Ag electrode
The Tg of the glass frit is crucial for the contact ohmicity of the thick-film Ag grid. Fig. 6 shows the surface morphology and cross-sectional SEM images of three silver electrode after firing to further understand the effect of Tg on the contact formation using GF-1, GF-2 and GF-3, respectively (denoted as SP1, SP2 and SP3). During fast sintering stage, lower Tg of the lead-free glass powder could be melted in a short time, liquid glass powder along the gap between the silver flow to the silicon surface to play the role of corroding anti-reflective film, result in formation of many holes (Fig. 6a). However, the lead-free glass powder do not completely melt with higher Tg, silver particles could not well-distributed and silver particles are still very obvious (Fig. 6c). In comparison to the SP2 paste (Fig. 6b), the surface morphology of silver electrode after firing is relatively compact and denser. Therefore, as an inorganic binder, the Tg of the glass frit affects largely the sintering quality of silver metal electrode and the metallization of contact formation.
 |
| | Fig. 6 The surface morphology and cross-sectional SEM images of three silver electrode after firing: top view (a–c), cross-section images (d–f). | |
Through the observation of cross-section images (d, e and f), in the SEM image (Fig. 6d), the glass frit with lower Tg generally results in a thicker glass layer between the Ag bulk of the grid and the Si emitter, which could cause higher contact resistance. SEM image (Fig. 6f) shows that the bulk of the Ag grid and the Si emitter surface are separated by a thinner glass layer. Nevertheless, the high Tg glass frits can not easily wetted SiNx coating and have insufficient time to wet the Si surface because of the quite short time of during fast sintering stage, which causes eqn (1) and (2) can not timely reaction, because the sinter temperature must be high adequately to melt the glass frit during the firing cycle. SEM image (Fig. 6e) shows uniform and quasi-continuous glass layer. The thickness of glass layer should be suitable for the derivation of photoelectrons with enough energy, which leads to tunneling effect.34 Therefore, the solar cells could achieve good ohmic contact and a lower contact resistance.35,36
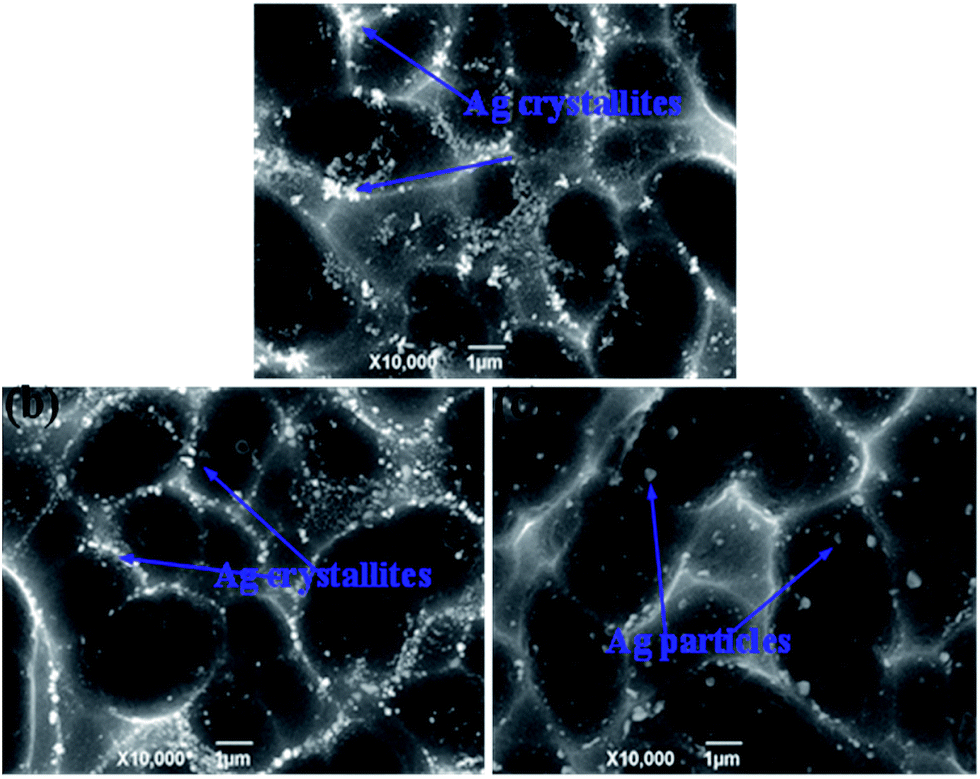
The effect of the Tg on Ag crystallites grown Si substrate
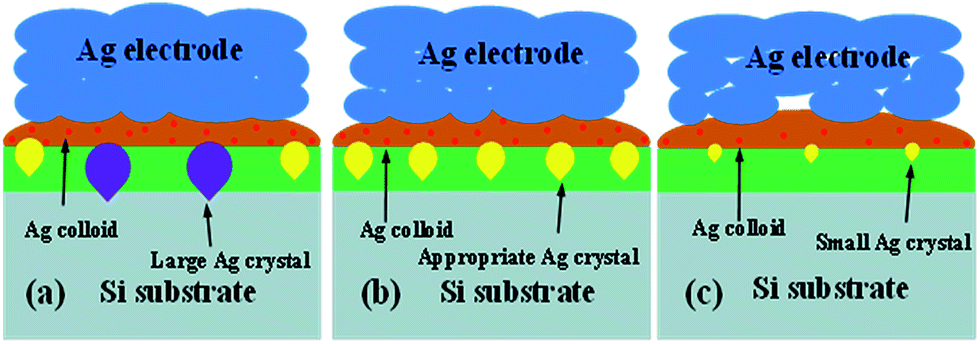
The effects of the Tg on the Ag crystallites distribution in the glass layer and Si substrate were investigated and explored. As shown in Fig. 7, the glass frit and Ag bulks were selectively etched-off before taking the images using a sequence of aqua regia for etching the Ag bulks, followed by 3% HF solution for etching the glass frit to expose the Ag particles and Ag crystallites in the Si substrate. The dissolved Ag in the glass layer was deposited on the silicon surface, during cooling, Ag crystallites were formed on the Si substrate surface. Fig. 7 shows that the glass frit with lower Tg (Fig. 7a) led to larger and more frequent distribution of Ag crystallites compared with the glass frit with higher Tg (Fig. 7c). The glass frit with lower Tg earlier started to flow during the firing cycle, which allows the glass to interact with the Ag particles for a longer time during firing, resulting in dissolving more Ag particles before completely sintering. Dissolved Ag particles would preferentially nucleate into Ag crystallites, which would possibly break-down the p–n junction and lead to lower electric properties,37 however, Ag particles (Fig. 7c) did not have sufficient time for nucleation. In comparison to Fig. 7b, Ag crystallites on the Si substrate surface were uniform and moderate size. In addition, more homogeneous Ag crystallites on the silicon surface could help in forming good ohmic contacts. A simple schematic illustration for the formation was given in Fig. 8.
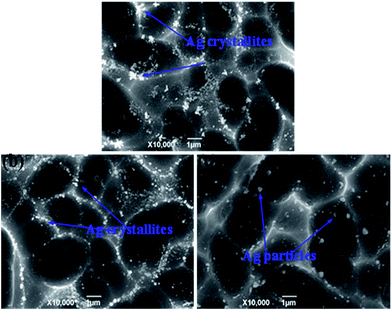 |
| | Fig. 7 Top SEM images of the crystalline Si solar cells that have been chemically etched: (a) Tg = 311 °C, (b) Tg = 347 °C, and (c) Tg = 366 °C. | |
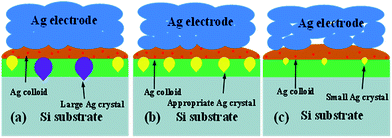 |
| | Fig. 8 Schematic diagram of the effect of Tg from low to high on the solar cells: (a) Tg = 311 °C, (b) Tg = 347 °C, and (c) Tg = 366 °C. | |
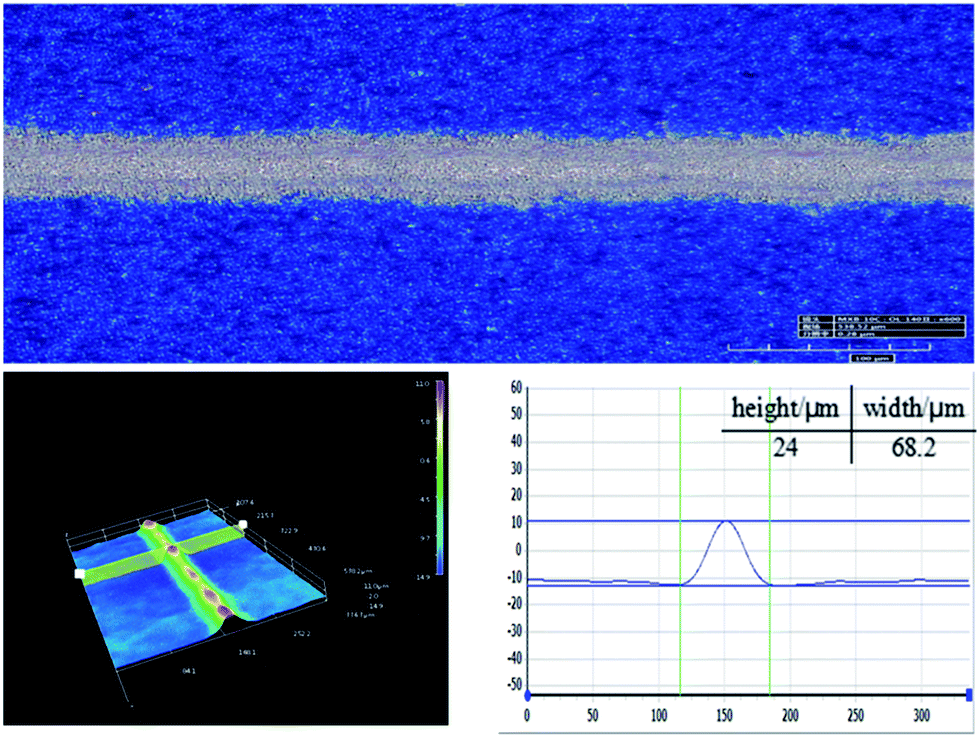
The electrical performance parameters of solar cells that have been printed using silver pastes of PS1, PS2, PS3 and PS4 (denoted as SC1, SC2, SC3 and SC4) were shown in Table 3. The fabricated solar cell (SC2) based on the GF-2 glass frit (Tg = 347 °C) provided with the highest conversion efficiency and FF, in summary, which could be lead to the Tg of glass frit, attributing to the effect on the front metallization contact of thick-film metal grid. Therefore, the Tg of glass frit is either too high or too low for the front contact paste of polycrystalline silicon solar cells, should be controlled in a optimum range. Besides, the fabricated solar cell (SC2) showed higher electrical conversion efficiency when compared with SC4 using classical Pb-based glass frit, which could be explained by comparison of the series resistance (Rs). The lower conversion efficiency should be due to the poor Rs. Owing to all other factors being equal except for the inorganic binder source, this degradation may due to the poor metallization contact. Therefore, the result indicated the designed lead-free glass frit could be a suitable substitute for Pb-based glass frit for preparing environmentally friendly front-side silver paste for crystalline silicon solar cells. These results are similar to the report by Che et al.7 Fig. 9 shows microscopic pictures of a conductive silver line printed on a textured multi-crystalline silicon surface using the GF-2 glass frit. As can be seen from the graph, the front electrode grid line smooth and homogeneous, in addition, which showed a appropriate 3D morphology and aspect ratio.
Table 3 Electrical performance parameters of solar cells SC1, SC2, and SC3
| Paste |
Cell |
Electrical performance parameters |
| Voc (V) |
Isc (A) |
Rs (Ω) |
FF (%) |
Eff (%) |
| SP1 |
SC1 |
0.629 |
8.928 |
0.0019 |
79.425 |
18.146 |
| SP2 |
SC2 |
0.631 |
8.937 |
0.0017 |
79.584 |
18.260 |
| SP3 |
SC3 |
0.625 |
8.902 |
0.0021 |
78.808 |
18.012 |
| SP4 |
SC3 |
0.634 |
8.899 |
0.0018 |
79.526 |
18.230 |
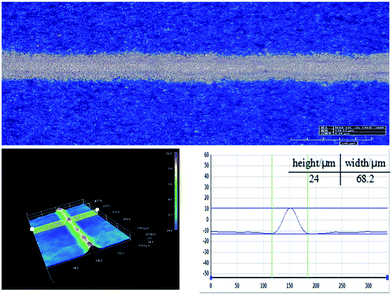 |
| | Fig. 9 3D micrographs of the front electrode grid line of SC2. | |
Conclusions
An environmentally friendly Bi–Te–B–Si–P–O lead-free glass frit with different transition temperature (Tg) by changing B2O3/SiO2 mass fraction ratios for the front contact paste in polycrystalline silicon solar cells were prepared by melt cooling route. The Tg of the glass frit is one of the most significant properties that determine the glass behavior, which would effect on the Ag–Si contact of thick-film silver grid. The cross-sectional microstructures of the front-silver electrodes and the Ag crystallites distribution on Si substrate were observed by SEM, through SEM observations, the glass frit with appropriate Tg (347 °C) could control the growth and homogeneous distribution of silver crystallites in the glass layer and silicon substrate, which contributed to form good ohmic contacts and tunneling effect with enough energy photoelectrons. Therefore, the Tg of glass frit is either too high or too low for the front contact paste of polycrystalline silicon solar cells, should be controlled in a optimum range. Through screen printing technology, which showed excellent aspect ratio by 3D digital microscope with GF-2 glass frit. The fabricated solar cell (SC2) based on the GF-2 glass frit (Tg = 347 °C) provided with the highest conversion efficiency (18.260%) and the lowest series resistance (0.0017 Ω). The result was compared with the solar cell fabricated with classical Pb-based glass frit with the conversion efficiency (18.230%) using the same device configuration, which indicated the designed lead-free glass frit could be a suitable substitute for Pb-based glass frit for preparing environmentally friendly front-side silver paste for crystalline silicon solar cells.
Conflicts of interest
There are no conflicts to declare.
Acknowledgements
The authors are grateful to the financial supports of the National Hi-Tech Research and Development Program (863) Key Project of China (No. 2012AA050301-SQ2011GX01D01292), Key Science and Technology Innovation Team Project of Natural Science Foundation of Shaanxi Province (2017KCT-0) and Xi'an Industrial Technology Innovation Project-technology transfer promoting program (No. CXY1412, CX1242 and CXY1511 (9)). This work was also supported by Key Project of Industrial Science and Technology of Shaanxi Province (No. 2016GY-090 and 2016GY-196).
Notes and references
- G. Zheng, Y. Tai, H. Wang and J. Bai, J. Mater. Sci.: Mater. Electron., 2014, 25, 3779–3786 CrossRef CAS.
- Q. Che, H. Yang, L. Lu and Y. Wang, Appl. Energy, 2013, 112, 657–662 CrossRef CAS.
- F. Sarhaddi, S. Farahat, H. Ajam, A. Behzadmehr and M. M. Adeli, Appl. Energy, 2010, 87, 2328–2339 CrossRef.
- D. Erath, A. Filipović, M. Retzlaff, A. K. Goetz, F. Clement, D. Biro and R. Preu, Sol. Energy Mater. Sol. Cells, 2010, 94, 57–61 CrossRef CAS.
- R. J. S. Young and A. F. Carroll, Advances in front-side thick film metallisation for silicon solar cells, in Proc. 16th EC PVSEC, Glasgow, Great Britain, 2000, p. VD3.63 Search PubMed.
- J. Qin, W. Zhang, S. Bai and Z. Liu, Appl. Surf. Sci., 2016, 376, 52–61 CrossRef CAS.
- Q. Che, H. Yang, L. Lu and Y. Wang, J. Alloys Compd., 2013, 549, 221–225 CrossRef CAS.
- Z. Liu, X. Qi and H. Wang, Adv. Powder Technol., 2012, 23, 250–255 CrossRef CAS.
- J. Zhou, N. Xu, H. Yang and Q. Zhang, Procedia Eng., 2014, 94, 1–5 CrossRef CAS.
- S. Rane, T. Seth, G. Phatak, D. Amalnerkar and M. Ghatpande, J. Mater. Sci.: Mater. Electron., 2004, 15, 103–106 CrossRef CAS.
- C. Ballif, D. Huljić, G. Willeke and A. Hessler-Wyser, Appl. Phys. Lett., 2003, 82, 1878–1880 CrossRef CAS.
- J.-T. Tsai and S.-T. Lin, J. Alloys Compd., 2013, 548, 105–109 CrossRef CAS.
- Y. Zhang, Y. Yang, J. Zheng, W. Hua and G. Chen, Mater. Chem. Phys., 2009, 114, 319–322 CrossRef CAS.
- S. Choi, S. Cho, J. Lee, D.-Y. Jeong and H. Kim, Met. Mater. Int., 2015, 21, 686–691 CrossRef CAS.
- J. M. Park, K. H. Park, E. S. Park, S.-M. Hong, S. Y. Kim, S. S. Jee, E. S. Lee, S. J. Kim, K. B. Kim and D. H. Kim, Metall. Mater. Trans. A, 2015, 46, 2443–2448 CrossRef CAS.
- G. Schubert, F. Huster and P. Fath, Sol. Energy Mater. Sol. Cells, 2006, 90, 3399–3406 CrossRef CAS.
- K.-K. Hong, S.-B. Cho, J. S. You, J.-W. Jeong, S.-M. Bea and J.-Y. Huh, Sol. Energy Mater. Sol. Cells, 2009, 93, 898–904 CrossRef CAS.
- X.-X. Pi, X.-H. Cao, Z.-X. Fu, L. Zhang, P.-D. Han, L.-X. Wang and Q.-T. Zhang, Acta Metall. Sin., 2015, 28, 223–229 CrossRef CAS.
- J. H. Yi, H. Y. Koo, J. H. Kim, Y. N. Ko, Y. J. Hong, Y. C. Kang and H. M. Lee, J. Alloys Compd., 2011, 509, 6325–6331 CrossRef CAS.
- D. Seo, S. Park and J. Lee, Curr. Appl. Phys., 2009, 9, S72–S74 CrossRef.
- D. Kim, S. Hwang and H. Kim, J. Korean Phys. Soc., 2009, 55, 1046–1050 CrossRef CAS.
- S. H. Park, D. S. Seo and J. K. Lee, J. Nanosci. Nanotechnol., 2008, 8, 5331–5336 CrossRef CAS PubMed.
- S. J. Jeon, S. M. Koo and S. Am Hwang, Sol. Energy Mater. Sol. Cells, 2009, 93, 1103–1109 CrossRef CAS.
- J. H. Kim, H. Y. Koo, Y. N. Ko and Y. C. Kang, J. Alloys Compd., 2010, 497, 259–266 CrossRef CAS.
- J. Jiang, Y. He, Z. Zhang, J. Wei and L. Li, J. Alloys Compd., 2016, 689, 662–668 CrossRef CAS.
- J. D. Fields, M. I. Ahmad, V. L. Pool, J. Yu, D. G. Van Campen, P. A. Parilla, M. F. Toney and M. F. Van Hest, Nat. Commun., 2016, 7, 11143–11150 CrossRef CAS PubMed.
- E. R. Shaaban, M. Shapaan and Y. B. Saddeek, J. Phys.: Condens. Matter, 2008, 20, 155108 CrossRef.
- Y. Cheng, H. Xiao, W. Guo and W. Guo, Thermochim. Acta, 2006, 444, 173–178 CrossRef CAS.
- Y. Zhang, Y. Yang, Y. Ou, W. Hua, J. Zheng and G. Chen, J. Am. Ceram. Soc., 2009, 92, 1881–1883 CrossRef CAS.
- X. Zhu, C. Mai and M. Li, J. Non-Cryst. Solids, 2014, 388, 55–61 CrossRef CAS.
- E. Kamitsos, A. Patsis, M. Karakassides and G. D. Chryssikos, J. Non-Cryst. Solids, 1990, 126, 52–67 CrossRef CAS.
- A. Hassan, L. Börjesson and L. Torell, J. Non-Cryst. Solids, 1994, 172, 154–160 CrossRef.
- Y. Cheng, H. Xiao and W. Guo, Mater. Sci. Eng., A, 2008, 480, 56–61 CrossRef.
- C.-H. Lin, S.-Y. Tsai, S.-P. Hsu and M.-H. Hsieh, Sol. Energy Mater. Sol. Cells, 2008, 92, 1011–1015 CrossRef CAS.
- M. M. Hilali, S. Sridharan, C. Khadilkar, A. Shaikh, A. Rohatgi and S. Kim, J. Electron. Mater., 2006, 35, 2041–2047 CrossRef CAS.
- B. Sopori, J. Rand, T. Saitoh, R. Sinton, M. Stavola, D. Swanson, T. Tan, E. Weber, J. Werner and M. Al-Jassim, 13th Workshop on Crystalline Silicon Solar Cell Materials and Processes: Extended Abstracts and Papers, National Renewable Energy Laboratory (NREL), Golden, CO., 2003 Search PubMed.
- Y. Tai, G. Zheng, H. Wang, H. Wang and J. Bai, RSC Adv., 2015, 5, 92515–92521 RSC.
|
| This journal is © The Royal Society of Chemistry 2017 |
Click here to see how this site uses Cookies. View our privacy policy here. 
 Open Access Article
 This Open Access Article is licensed under a Creative Commons Attribution-Non Commercial 3.0 Unported Licence
 *a
*a