
 Open Access Article
 This Open Access Article is licensed under a
 Creative Commons Attribution 3.0 Unported Licence
Insight into the role of bound water of a nucleating agent in polymer nucleation: a comparative study of anhydrous and monohydrated orotic acid on crystallization of poly(L-lactic acid)†
Ping Song *a,
Lin Sangb,
Liuchun Zhengc,
Chao Wanga,
Kankan Liud and
Zhiyong Wei*e
*a,
Lin Sangb,
Liuchun Zhengc,
Chao Wanga,
Kankan Liud and
Zhiyong Wei*e
aSchool of Materials Science and Engineering, North University of China, Taiyuan 030051, China. E-mail: songping@nuc.edu.cn
bSchool of Automotive Engineering, Dalian University of Technology, Dalian 116024, China
cBeijing National Laboratory for Molecular Sciences, Key Laboratory of Engineering Plastics, Institute of Chemistry, Chinese Academy of Sciences, Beijing 100190, China
dSchool of Chemical and Environmental Engineering, North University of China, Taiyuan 030051, China
eSchool of Chemical Engineering, Dalian University of Technology, Dalian 116024, China. E-mail: zywei@dlut.edu.cn
First published on 23rd May 2017
Abstract
To gain an insight into the role of bound water of a nucleating agent in polymer nucleation, a biobased nucleating agent, orotic acid (OA), was selected as a model to investigate the effects on crystallization of poly(L-lactic acid) (PLLA). In such a context, two commercially available types of OA in anhydrous (OA-a) and monohydrated (OA-m) forms were melt mixed with PLLA, and their nucleation effectiveness on nonisothermal and isothermal melt crystallization of PLLA was comparatively studied. Results indicate that both forms of OA can significantly improve nonisothermal crystallization temperature and degree of crystallinity, overall isothermal crystallization rate, as well as nucleation density of PLLA. Interestingly, OA-a shows more prominent nucleation efficiency than OA-m. That is, the bound water of OA-m and its dehydration transition play a negative role in nucleation effects on PLLA crystallization. It is attributed to the deteriorated dispersion and the reduced active concentration of dehydration-transformed OA-a in PLLA/OA-m blends, as compared with pristine OA-a in PLLA/OA-a blends. Furthermore, an epitaxial mechanism is proposed to explain the nucleation phenomenon of PLLA/OA blends.
1. Introduction
Nowadays, biobased and biodegradable polymers have attracted a great deal of attention thanks to their own advantages in terms of material sustainability and environmental protection.1–3 Poly(L-lactic acid) (PLLA) has been the frontrunner in these biopolymers with potential to replace conventional petroleum-based plastics.4 Because of its renewability, biocompatibility, compostability, low carbon footprint, ease of processing, good mechanical properties and competitive price, PLLA exhibits an extensive application range from short-time uses to long-term aspects including medical, packaging, textiles, commodities as well as engineering components for electronics and the automotive industry.5,6 In addition, its characteristics like glossiness, multicolor appearance and lower warp behavior make PLLA one of the important materials for three-dimensional printing.7–9As a semicrystalline polyester with high melting point, however, PLLA has very slow crystallization rate and a low degree of crystallinity in traditional processing such as injection molding and thus poor thermal resistance, with heat deflection temperature (HDT) near its glass transition temperature (∼55 °C).10 This shortcoming has limited the wider utilization of PLLA, especially for durable articles. Therefore, manipulation of crystallization towards high performance is essential for the practical applications of PLLA.11,12 Adding nucleating agents (NAs) is a simple and efficient strategy to reduce the free energy barrier for critical nuclei formation and induce the high crystallization temperature at low supercooling. Until now, diverse inorganic and organic species have been introduced as NAs for PLLA, and their effects on crystallization kinetics and final properties have been investigated in literatures.13–31 In general, inorganic NAs have relative low cost and easy availability, but less efficient nucleation effects due to their poor compatibility with PLLA, as a consequence, often require additional surface treatment via organic modification. In contrast, organic NAs can be well dispersed in PLLA matrix and usually show better nucleation effects, nevertheless most of these chemicals have complicated preparation processes, and even are not biodegradable, bioabsorbable or nontoxic, resulting in that they are undesirable in the utilization related to food, human bodies and ecological environment demand.
In order to promote the crystallization of PLLA without compromising its bio-advantages, several biobased NAs with biodegradability, biocompatibility and nontoxicity like myo-inositol,32 thermoplastic starch,33 orotic acid,34 nucleobases,35 xylan esters,36 cyclodextrin complex,37 lignin,38 nanocelluloses,39,40 amino acids and poly(amino acids)41 have been developed. Among of these biobased NAs, it appears that orotic acid (OA), a naturally occurring substance (e.g., in milk products), is most effective in light of the significant enhancement on crystallization kinetics of PLLA with only 0.3 wt% dosage (crystallization peak temperature is 123.9 °C and crystallization enthalpy is 34.1 J g−1, when nonisothermally crystallized at a cooling rate of 10 °C min−1; crystallization half-time is 0.64 min, when isothermally crystallized at 120 °C).34 Besides, OA has also been shown to be a good nucleating agent for poly(3-hydroxybutyrate) and its copolyesters.42–44
In fact, there are two commercially available types for orotic acid, that is, anhydrous and monohydrated forms, which possess different structural features and properties,45 and may result in discrepant nucleation ability on polymer crystallization. However, previous studies are mainly focused on the nucleation effects of monohydrated form.34,42,43 To our best knowledge, the role of bound water of a hydrated NA and its phase stability and transitions during melt blending process in the nucleation effectiveness for PLLA crystallization are not involved and still unknown, although these understandings are of importance for regulating the crystallization kinetics and the final physical properties of PLLA by reasonable use of orotic acid as an effective nucleating agent.
In this work, to gain insight into the role of bound water of nucleating agent in polymer nucleation, the effects of anhydrous orotic acid (OA-a) and monohydrated orotic acid (OA-m) on the crystallization of PLLA were comparatively investigated. This paper reported on the results about the nonisothermal/isothermal melt crystallization and melting behavior, spherulite morphology and crystal structure. Moreover, their nucleation ability and mechanism were compared and discussed. Some of them are interesting and important, not only for the understanding of the bound water effects in OA, but also for the understanding of the bound water effects in other NAs on polymer crystallization in general. The research reported herein is expected to shed some light on fabricating high-performance PLLA biobased materials.
2. Experimental section
2.1 Materials
PLLA resin (grade: 4032D, comprising around 2% D-isomer) with a weight-average molecular weight (Mw) of 210 kg mol−1 was purchased from NatureWorks LLC (USA). Anhydrous orotic acid and monohydrated orotic acid with purities higher than 98% were obtained from Energy Chemical Co., Ltd. (Shanghai, China).2.2 Sample preparation
The PLLA blends with 0.2–2 wt% of anhydrous and monohydrated orotic acid were prepared by a micro conical twin-screw extruder (SJZS-10A, Wuhan Ruiming Experimental Instrument Co., Ltd., China) under circulated mode for 6 min. The temperature setting of extruder from feeding inlet to extrusion outlet was 170/180/190/180 °C, and the screw rotational speed was 50 rpm. Before mixing, PLLA granules and OA powders were dried under vacuum at 80 °C for 6 h. The blended samples were denoted as OA-ax% and OA-mx%, respectively, where x was the weight percentage of additives. For example, OA-a1% referred to a PLLA sample containing 1 wt% anhydrous orotic acid. A pure PLLA sample was prepared as a control by the same way.2.3 Characterization methods
The crystallization and melting behaviors of pure PLLA and OA-containing samples were measured on a differential scanning calorimeter (DSC, Mettler-Toledo DSC1 STAR® System, Switzerland) under the nitrogen atmosphere at a flow rate of 50 mL min−1. Calibration was performed by means of high-purity indium and zinc standards. About 7 mg samples were weighed and encapsulated in aluminum pans for DSC tests. To investigate the nonisothermal melt crystallization and subsequent melting behavior, the samples were initially heated to 200 °C and held for 3 min to erase thermal history, and then they were cooled down to 25 °C at 10 °C min−1 and reheated to 200 °C at the same rate. For the isothermal crystallization kinetics, the samples were melted at 200 °C for 3 min, followed by a rapidly cooling to a predetermined crystallization temperature at 60 °C min−1. After the completion of crystallization, the samples were reheated to 200 °C at 10 °C min−1 to study the melting behavior.The Fourier transform infrared (FTIR) spectra were collected by using a Nicolet 6700 spectrometer (Thermo Fisher Scientific, America) equipped with a hot stage. The collection was at a resolution of 2 cm−1 by averaging 16 scans. The samples of pure PLLA and its blends with 1 wt% OA-a and OA-m were prepared by solution casting on potassium bromide plates. Each sample was held at 200 °C for 3 min to erase thermal history, and then it was cooled to 140 °C at a rate of 60 °C min−1. When the temperature reached 140 °C, data collection begun and the spectra were collected at 5 min intervals for pure PLLA and 1 min intervals for OA-nucleated PLLA samples.
The crystal morphologies of pure PLLA and PLLA/OA blends were observed by a polarized optical microscope (Leica DM4500P, Germany) equipped with a digital camera and a hot stage (Linkam THMS600, England). The samples were placed between two microscope cover glasses, melted at 200 °C for 3 min, and then quickly cooled down to a predetermined crystallization temperature at 60 °C min−1. The evolution of spherulites during isothermal crystallization was recorded.
Wide-angle X-ray diffraction (WAXD) analysis was taken on an X-ray diffractometer (Rigaku, Japan) with Ni-filtered Cu Kα radiation (λ = 0.154 nm) at a voltage of 40 kV and a current of 40 mA. Pure PLLA and its blends were isothermally melt-crystallized at 130 °C for 1 h before measurements. The diffraction angle (2θ) covered a range of 3–50° for OA powders and 10–30° for PLLA/OA blends at the scanning speed of 1.2° min−1.
Scanning electron microscopy was conducted using a field emission scanning electron microscope (FE-SEM, Hitachi SU8010, Japan) at an accelerating voltage of 10 kV. The samples were coated with a layer of gold beforehand.
3. Results and discussion
3.1 Nonisothermal melt crystallization
Crystallization of semicrystalline polymers can take place from both molten and glassy states, which are normally designated as melt crystallization and cold crystallization, respectively. It is of great significance to investigate the melt-crystallization behavior from both academic and industrial viewpoints, because the processing of thermoplastic polymer is mostly in the molten state. DSC tests were taken to compare the effects of anhydrous and monohydrated orotic acid on the melt-crystallization behavior of PLLA. Fig. 1 shows the DSC curves of nonisothermal melt crystallization and reheating scans for pure PLLA and PLLAs containing different contents of OA-a or OA-m. The evaluated thermal parameters including melt-crystallization temperature (Tc), melt-crystallization enthalpy (ΔHc), cold-crystallization temperature (Tcc) and enthalpy (ΔHcc), melting temperature (Tm), melting enthalpy (ΔHm), as well as degree of crystallinity (Xc) are summarized in Table 1. The values of enthalpy are normalized by the mass of PLLA matrix. Xc is estimated from the equation: Xc = (ΔHm − ΔHcc)/[(1 − x%) × ΔH0m], where x is the weight percentage of OA, and ΔH0m is the melting enthalpy of 100% crystalline polymer (93 J g−1, for PLLA).46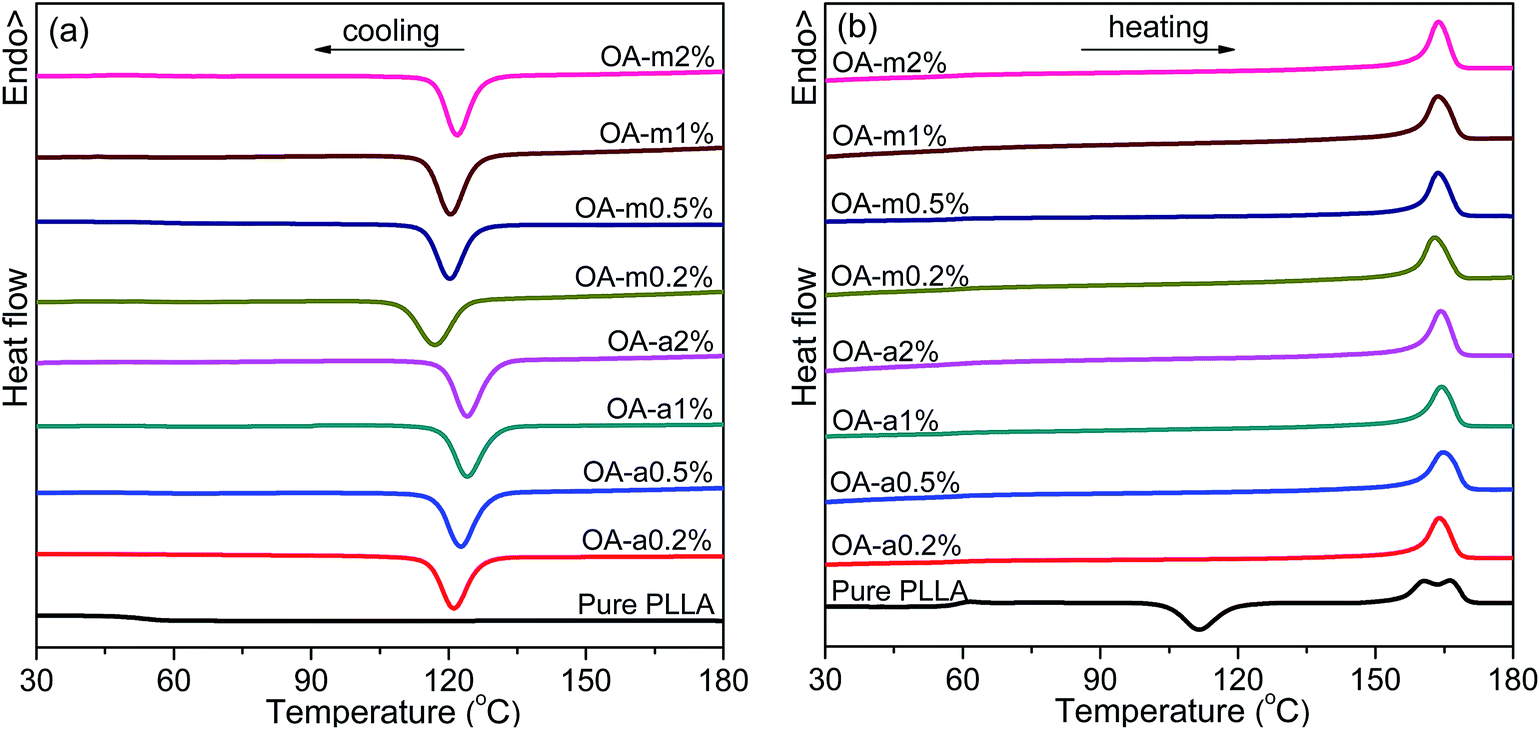 | ||
| Fig. 1 DSC thermograms recorded in (a) nonisothermal melt crystallization and (b) subsequent heating scans for pure PLLA and its blends with two forms of orotic acid. Both the cooling and heating rates are 10 °C min−1. | ||
| Sample | Tc (°C) | ΔHc (J g−1) | Tcc (°C) | ΔHcc (J g−1) | Tm (°C) | ΔHm (J g−1) | Xc (%) | NE (%) |
|---|---|---|---|---|---|---|---|---|
| Pure PLLA | — | 0 | 111.4 | 34.4 | 160.2, 165.7 | 34.5 | 0.1 | 0 |
| OA-a0.2% | 121.5 | 35.6 | — | 0 | 163.4 | 35.9 | 38.7 | 81.4 |
| OA-a0.5% | 123.0 | 35.8 | — | 0 | 164.4 | 35.9 | 38.8 | 83.3 |
| OA-a1% | 124.2 | 35.6 | — | 0 | 163.9 | 35.8 | 38.9 | 84.2 |
| OA-a2% | 124.3 | 35.5 | — | 0 | 163.8 | 35.6 | 39.1 | 83.9 |
| OA-m0.2% | 117.3 | 35.2 | — | 0 | 162.3 | 35.3 | 38.0 | 75.0 |
| OA-m0.5% | 120.5 | 35.5 | — | 0 | 163.3 | 35.4 | 38.3 | 78.6 |
| OA-m1% | 120.8 | 35.4 | — | 0 | 163.1 | 35.6 | 38.7 | 79.7 |
| OA-m2% | 122.2 | 35.6 | — | 0 | 163.2 | 35.5 | 39.0 | 80.8 |
As seen in Fig. 1, the melt-crystallization peak of pure PLLA is almost undetected upon cooling at 10 °C min−1, and a cold-crystallization peak with comparable area to melting peak appears at 111.4 °C after the devitrification at 57.6 °C in the subsequent heating scan, demonstrating that the crystallization of pure PLLA is very slow. Obviously, both the two forms of orotic acid can accelerate the crystallization of PLLA. With the addition of OA-a or OA-m, a sharp crystallization peak is present in the DSC cooling curve and shifts to a higher temperature with increasing the content. The endothermic step of devitrification becomes obscure and the cold-crystallization peak disappears in the following heating process, indicating that these samples crystallize completely during the cooling process. From Fig. 1(b), two melting peaks are observed in the heating scan for pure PLLA, while only one for PLLA/OA blends. The melting behavior of PLLA depends strongly on the crystallization temperature, and the double endothermic peaks can be elucidated by the melt-recrystallization mechanism.47,48 For pure PLLA, the temperature range of cold crystallization (ca. 100–120 °C) is relatively low and less perfect crystals are formed, thus the sample undergoes melting-recrystallization-remelting upon heating. The low-temperature peak is ascribed to the melting of primary crystals produced in cold-crystallization process, and the high-temperature peak is attributed to the melting of reorganized crystals. In the case of OA-containing PLLAs, the Tc is about 10 °C higher than the Tcc of pure PLLA, and relatively perfect crystals are formed. The crystals melt directly without recrystallization, leading to the appearance of a single endothermic peak.
The melt-crystallization temperature (Tc) and degree of crystallinity (Xc) are important indicators to assess the nucleation effects of a nucleating agent on the nonisothermal crystallization of polymers. Generally, a high Tc reflects fast crystallization and a high Xc means strong crystallizability. For clarity, Fig. 2 displays the variation of Tc and Xc with the concentration of anhydrous and monohydrated orotic acid. It is shown that both Tc and Xc increase gradually with an increase of OA content irrespective of its type, and the rising trend becomes inconspicuous when the content is in excess of 1 wt%, especially for OA-a. Besides, the Tc and Xc of PLLAs nucleated by OA-a are on average ∼3 °C and ∼0.4% higher than the ones by OA-m at all compositions, respectively, manifesting that the nucleation ability of OA-a is more efficient than OA-m for the nonisothermal melt crystallization of PLLA.
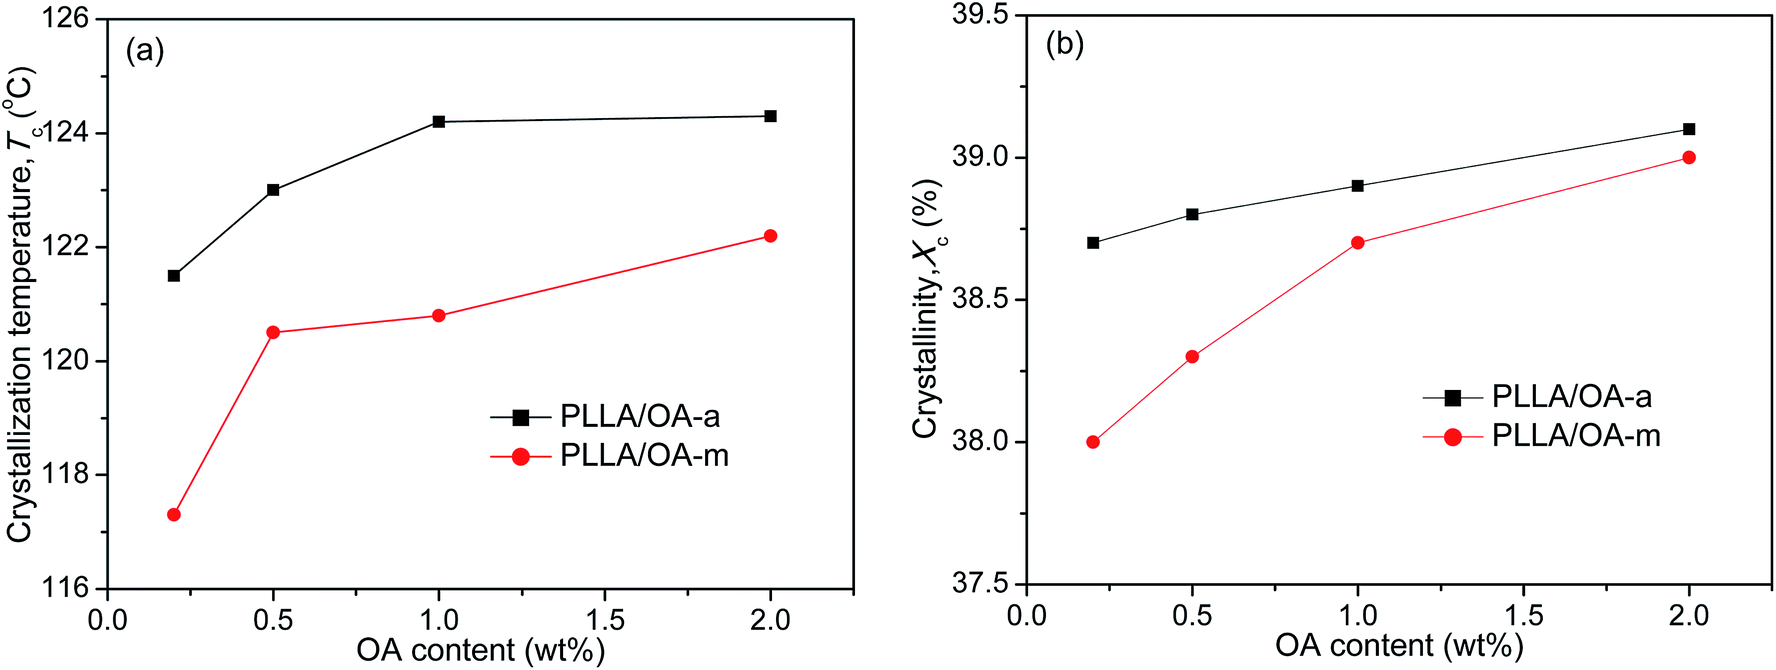 | ||
| Fig. 2 Dependence of (a) crystallization temperature and (b) degree of crystallinity on OA content for PLLA/OA blends in nonisothermal melt-crystallization processes. | ||
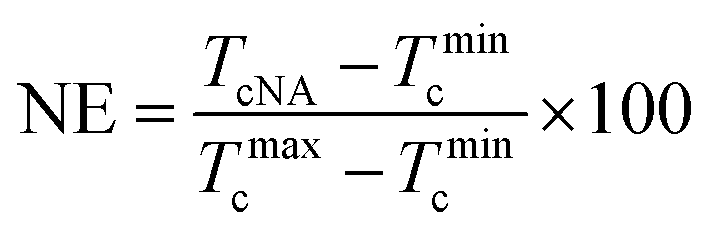
In order to quantitatively analyze the effectiveness of OA-a and OA-m as nucleating agents (NAs), nucleation efficiency (NE) based on the self-nucleation theory is calculated by the following equation:49,50
 | (1) |
3.2 Isothermal crystallization kinetics
Shortening the isothermal crystallization time of thermoplastic polymers with poor crystallization ability inside the preheated mold is crucial for improving their molding efficiency. Taking this into account, the effects of two forms of orotic acid on the isothermal melt-crystallization kinetics of PLLA were further investigated by DSC at a temperature of 130 °C. Fig. 3 exhibits the representative curves of relative crystallinity (Xt) as a function of crystallization time (t) for pure PLLA and OA-containing PLLAs isothermally crystallized at 130 °C. All these curves have similar sigmoid shapes. As shown in the inset of Fig. 3(a), the crystallization rate of pure PLLA is much too slow at such a low supercooling, due to the fact that the sample has finished the isothermal crystallization over 70 min. Clearly, the addition of anhydrous and monohydrated orotic acid speeds up the isothermal crystallization process dramatically, and the effect is even more pronounced for the former. Taking the concentration of 0.2 wt% as an example, it takes the PLLA blend with OA-a ∼2.5 min to finish the crystallization, while ∼4 min is required for the blend with OA-m. Furthermore, the corresponding crystallization time becomes shorter with increasing the content of OA-a or OA-m.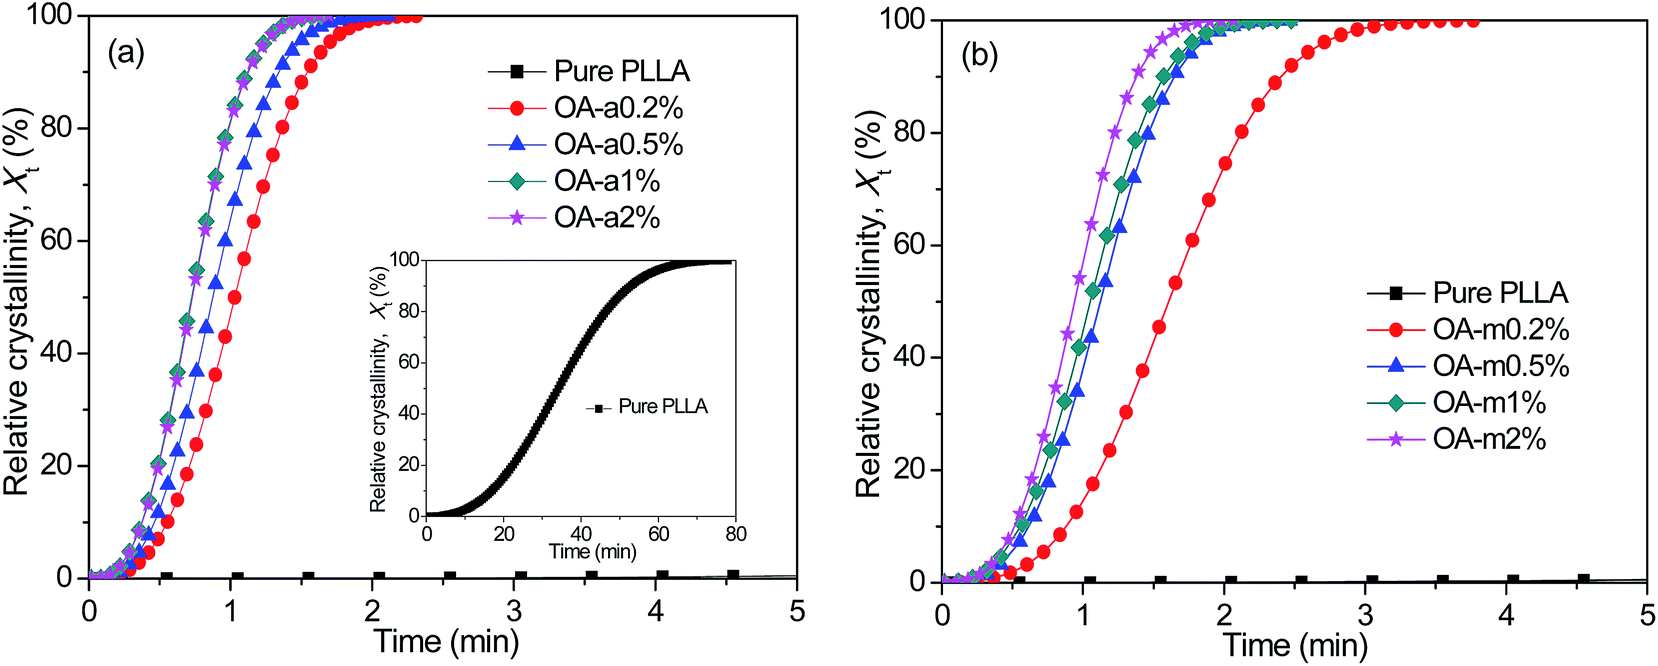 | ||
| Fig. 3 Evolution of relative crystallinity with crystallization time for (a) PLLA/OA-a blends and (b) PLLA/OA-m blends isothermally melt-crystallized at 130 °C. | ||
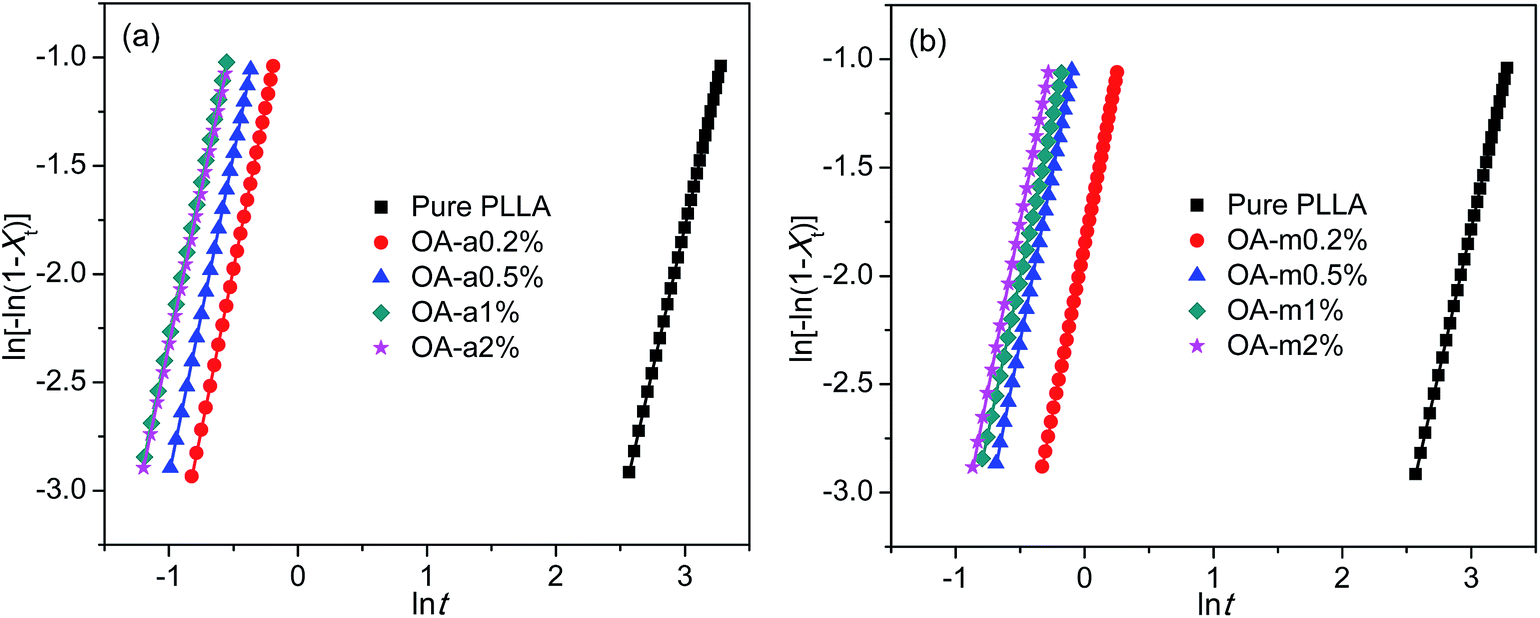
The isothermal crystallization kinetics of pure PLLA and PLLA/OA blends was analyzed in light of the well-known Avrami equation using the double logarithmic form: ln[−ln(1 − Xt)] = ln![[thin space (1/6-em)]](https://www.rsc.org/images/entities/char_2009.gif) k + nlnt, where k is the overall rate constant involving contributions from both nucleation and growth, and n is the Avrami exponent associated to the nature of nucleation and the dimensionality of crystal growth.51,52 The values of k and n can be obtained from the intercept and slope of fitted straight line, respectively, by plotting ln[−ln(1 − Xt)] versus lnt. Fig. 4 shows such plots for pure PLLA and PLLAs containing two forms of orotic acid isothermally crystallized at 130 °C. To reduce the fitting error, only the data of Xt between 5% and 30% were employed, since initial nucleation and secondary crystallization processes always lead to deviation of Avrami plot from linearity in the segments related to the beginning and the ending of crystallization. The obtained n, k, and R2 (square of correlation coefficient) are listed in Table 2. The values of R2 are approximately equal to 1, indicative of very good linear fittings. The values of n are very close to 3 regardless of the addition of OA-a or OA-m, suggesting a three-dimensional crystal growth with simultaneous nucleation.11 Since the unit of k is min−n and n is not identical for different samples, the values of k are not employed directly to compare the overall crystallization rate.
k + nlnt, where k is the overall rate constant involving contributions from both nucleation and growth, and n is the Avrami exponent associated to the nature of nucleation and the dimensionality of crystal growth.51,52 The values of k and n can be obtained from the intercept and slope of fitted straight line, respectively, by plotting ln[−ln(1 − Xt)] versus lnt. Fig. 4 shows such plots for pure PLLA and PLLAs containing two forms of orotic acid isothermally crystallized at 130 °C. To reduce the fitting error, only the data of Xt between 5% and 30% were employed, since initial nucleation and secondary crystallization processes always lead to deviation of Avrami plot from linearity in the segments related to the beginning and the ending of crystallization. The obtained n, k, and R2 (square of correlation coefficient) are listed in Table 2. The values of R2 are approximately equal to 1, indicative of very good linear fittings. The values of n are very close to 3 regardless of the addition of OA-a or OA-m, suggesting a three-dimensional crystal growth with simultaneous nucleation.11 Since the unit of k is min−n and n is not identical for different samples, the values of k are not employed directly to compare the overall crystallization rate.
 | ||
| Fig. 4 Avrami plots for (a) PLLA/OA-a blends and (b) PLLA/OA-m blends isothermally melt-crystallized at 130 °C. | ||
| Sample | n | k (min−n) | R2 | t1/2 (min) |
|---|---|---|---|---|
| Pure PLLA | 2.64 | 6.05 × 10⁻⁵ | 0.99998 | 34.1 |
| OA-a0.2% | 2.99 | 0.62 | 0.99993 | 1.03 |
| OA-a0.5% | 2.96 | 1.03 | 1.00000 | 0.87 |
| OA-a1% | 2.86 | 1.76 | 1.00000 | 0.73 |
| OA-a2% | 2.86 | 1.70 | 1.00000 | 0.73 |
| OA-m0.2% | 3.13 | 0.16 | 0.99998 | 1.61 |
| OA-m0.5% | 3.09 | 0.47 | 0.99989 | 1.13 |
| OA-m1% | 2.90 | 0.57 | 0.99979 | 1.05 |
| OA-m2% | 3.11 | 0.82 | 0.99993 | 0.93 |
The crystallization half-time t1/2, which is defined as the time needed to attain half of the final crystallinity (i.e., Xt = 50%), is introduced to distinguish the nucleation effects of OA-a from OA-m on the isothermal crystallization kinetics of PLLA. Usually, a short t1/2 indicates large overall crystallization rate. The value of t1/2 can be obtained directly from the curve of time dependence of relative crystallinity (as shown in Fig. 3), and the results are also listed in Table 2. For ease of comparison, the t1/2 is plotted as a function of the OA content as shown in Fig. 5. It is seen that the t1/2 decreases from 34.1 min for pure PLLA to 1.03 min and 1.61 min for the blends with 0.2 wt% OA-a and OA-m, respectively, at the isothermal crystallization temperature of 130 °C. The t1/2 further decreases, in other words, the overall crystallization rate increases with additional loading of two forms of OA. Note that the t1/2 levels off for the PLLA blends with OA-a when its content exceeds 1 wt%. Combined the nonisothermal crystallization results as shown in Fig. 2, it is drawn that the optimum dosage of OA-a is around 1 wt%. In comparison, the t1/2 of PLLAs containing OA-a is shorter than the one of OA-m for all contents, confirming that anhydrous orotic acid has a higher nucleation effectiveness.
 | ||
| Fig. 5 Variation of crystallization half-time with OA content for PLLA/OA blends melt-crystallized at 130 °C. | ||
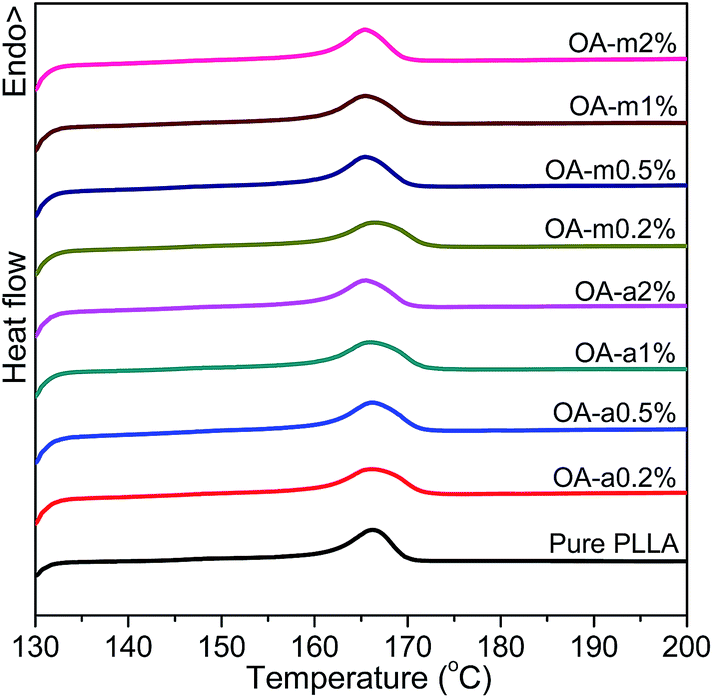
Fig. 6 shows the DSC heating curves of pure PLLA and OA-containing PLLAs at different loadings after isothermally melt-crystallized at 130 °C. It is shown that the addition of OA-a or OA-m has little effect on the melting behavior of PLLA and all the samples have similar melting temperatures at about 166 °C, implying that the crystal stability of PLLA is not influenced significantly by the presence of orotic acid under this crystallization condition.
 | ||
| Fig. 6 DSC thermograms recorded in heating scans at a rate of 10 °C min−1 for pure PLLA and its blends with two forms of orotic acid after isothermal melt crystallization at 130 °C. | ||
3.3 Time-resolved FTIR investigation on isothermal crystallization
FTIR spectroscopy is a useful means to detect the conformational changes and chain packing in polymer crystallization studies. In order to get deep insight into the nucleation effects of the two forms of orotic acid, the isothermal crystallization behavior of PLLA/OA blends was investigated by time-resolved FTIR. The spectral evolution of OA-a1% and OA-m1% during isothermal crystallization at 140 °C is shown in Fig. 7(a and b). To observe the peak intensity changes and peak position shifts visually, the difference spectra obtained by subtracting the initial spectrum from the successive ones in Fig. 7(a and b) are shown in Fig. 7(c and d). The peaks in the positive regions are crystalline-dependent, while those in the negative regions are amorphous-dependent. According to the previous studies,53–55 the IR bands at 1458 and 1211 cm−1, which can be ascribed to the asymmetric CH3 deformation vibrations (δasCH3) and the asymmetric stretching vibrations of C–O–C groups linked with asymmetric CH3 rocking vibrations (νasCOC + rasCH3), respectively, are conformation-sensitive and represent the interchain interactions. The crystalline-specific band at 920 cm−1 is sensitive to 103 helix formation of PLLA α crystals and reveals the intrachain interactions. | ||
| Fig. 7 Time-resolved FTIR spectra of (a) OA-a1% and (b) OA-m1% isothermally melt-crystallized at 140 °C, and the corresponding difference spectra of (c) OA-a1% and (d) OA-m1%. The spectra of OA-a1% are stacked every 2 min, while the spectra of OA-m1% are stacked every 3 min. | ||
Fig. 8 shows the normalized intensities of the bands at 920, 1211 and 1458 cm−1 over the course of crystallization for PLLA blends with 1 wt% OA-a and OA-m. The normalized intensities of the band at 920 cm−1 is used to probe the kinetics of 103 helix formation, while the bands at 1211 and 1458 cm−1 are used to follow the conformational changes in the backbone. The related results of pure PLLA are not given in the present study, because it is quite difficult to crystallize for pure PLLA at such a high crystallization temperature (140 °C) and almost no peak changes can be observed even if the time is increased to 240 min (see Fig. S3 in ESI†). In Fig. 8, it is clear that the induction time and t1/2 of OA-a1% is much shorter than the ones of OA-m1%, proving that OA-a is more effective as compared with OA-m. On the other hand, for either OA-a1% or OA-m1%, the sequence of intensity changes for the three bands at the early nucleation stages is as follows: 1458 cm−1 > 1211 cm−1 > 920 cm−1. This means that the interchain interactions corresponding to skeletal vibrations (δasCH3 and νasCOC + rasCH3) precede the intrachain 103 helix formation, which is similar to the situation of pure PLLA as reported in literatures.23,53,54 Therefore, OA-a and OA-m do not alter the sequence of interchain and intrachain interactions, but accelerate the skeletal conformational ordering and 103 helix formation of PLLA.
 | ||
| Fig. 8 Normalized peak intensities at 920, 1211, and 1458 cm−1 as a function of crystallization time for (a) OA-a1% and (b) OA-m1%. | ||
3.4 Spherulite morphology and crystal structure
In order to further compare the nucleation effects of anhydrous and monohydrated orotic acid on the crystallization behavior of PLLA, the crystal morphology of pure PLLA and its blends was examined by polarized optical microscopy (POM). Fig. 9 presents the POM images of the samples after isothermal melt crystallization at 130 °C. Despite the incorporation of OA-a or OA-m, PLLA displays the characteristic Maltese cross extinction pattern of spherulite. For pure PLLA, the spherulite size is very large with the maximum over 200 μm. The spherulite size decreases, and meanwhile the spherulite number increases with increasing the OA content. Upon addition of 1 wt% OA, large quantities of tiny crystals with fuzzy boundaries are observed. Compared to PLLA/OA-m blends at the same concentration, the nucleation density of PLLA/OA-a blends is higher and the size distribution of spherulite is more uniform, indicating that OA-a can provide more active nuclei for the crystallization of PLLA. These results confirm again that OA-a has a better nucleation ability than OA-m, which is in agreement with above DSC analysis. | ||
| Fig. 9 POM micrographs of pure PLLA and PLLA/OA blends isothermally melt-crystallized at 130 °C. | ||
The effects of two forms of OA on the crystalline structure of PLLA were investigated by wide-angle X-ray diffraction (WAXD) measurements. Fig. 10 shows the WAXD profiles of pure PLLA and its blends with 0.5 wt% OA-a or OA-m melt-crystallized at 130 °C for 1 h. For all the three samples, the main diffraction peaks appear at the 2θ of 14.7°, 16.6°, 19.0°, and 22.2°, which are assigned to the (010), (200)/(110), (203), and (015) reflections of the PLLA α crystal.55 The locations of characteristic diffraction peaks are not shifted, implying that the crystalline structure of PLLA is not altered by the incorporation of OA. The intensity of diffraction peaks of pure PLLA is relatively weak, because the isothermal crystallization has not been completed within 1 h at 130 °C, as revealed in the inset of Fig. 3(a).
 | ||
| Fig. 10 WAXD patterns of pure PLLA and PLLA/OA blends isothermally melt-crystallized at 130 °C. | ||
3.5 Nucleation analysis
To disclose the origin of the discrepant nucleation ability as for the two forms of orotic acid, the morphology of OA particles was firstly investigated by scanning electron microscopy (SEM). Fig. 11 shows the SEM images of OA-a and OA-m, respectively. As can be seen from Fig. 11, both the two forms of OA possess layer structures. However, it seems that the layer structures of OA-a peel off and become fragile after removal of water molecules, resulting in that OA-a has a much smaller size than OA-m.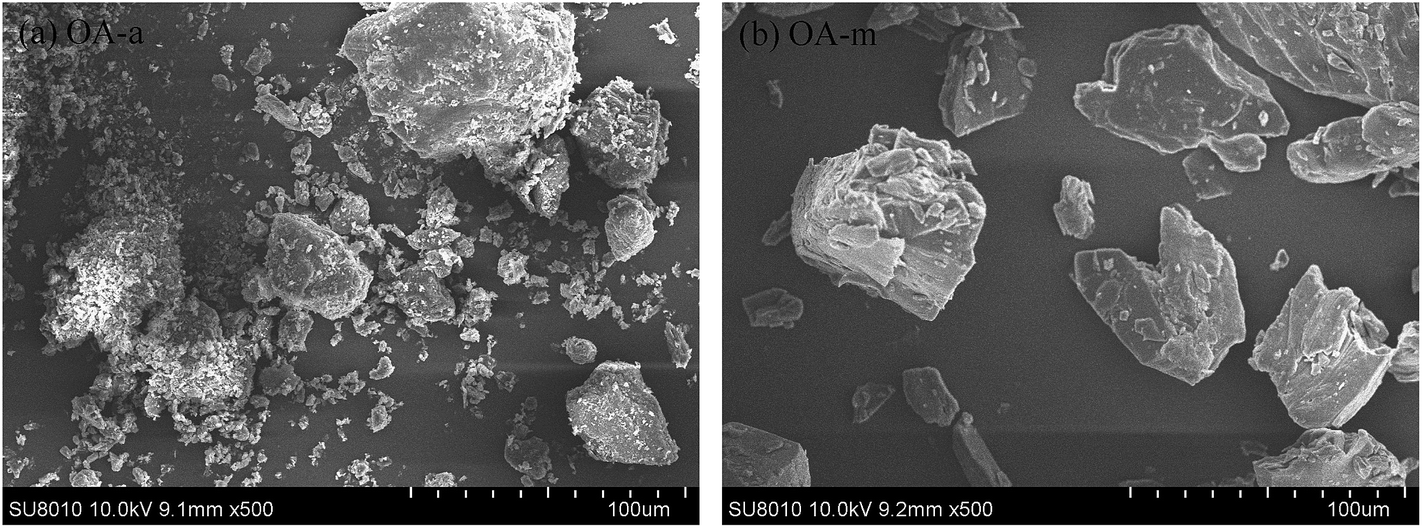 | ||
| Fig. 11 SEM images of (a) OA-a and (b) OA-m particles. | ||
The structural features of OA-a and OA-m were then characterized by WAXD. Fig. 12 shows the resulting diffraction profiles. A strong diffraction peak is observed at 2θ = 28.8° for both of the two samples, which corresponds to the stacking reflection of layer structures.45 In contrast to OA-m, a broadened diffraction peak appears at 2θ around 20° for OA-a, indicating that OA-a has a lower degree of long-range order. Recently, it has been found that orotic acid and water molecules are linked by strong hydrogen bonds in nearly perfectly planar layers in OA-m, and the stacked layers are maintained in the dehydration product (i.e., OA-a), whereas their lattice parameters are different (a = 5.456 Å, b = 5.964 Å, c = 9.043 Å, α = 95.41°, β = 94.28°, γ = 97.18° for OA-a; a = 5.949 Å, b = 6.836 Å, c = 9.480 Å, α = 73.62°, β = 72.16°, γ = 68.93° for OA-m). Notably, this literature has also pointed out that OA-m loses the bound water and dissociates into OA-a when it is heated above 135 °C under normal or hermetically sealed high-pressure atmospheric conditions.45 In addition, it has been reported that an endothermic peak, which is attributed to the evaporation of the water associated with OA-m, appears at 144 °C before the melting peak of poly(hydroxybutyrate-co-hydroxyvalerate) (PHBV) at 171 °C in the first heating DSC curve of PHBV solvent-cast film containing 5 wt% OA-m.44 In this work, considering the blended samples were prepared in the temperature range of 170–190 °C for 6 min, it is reasonable to conclude that OA-m is transformed into OA-a during the melt extrusion processes, and finally, OA-a acts as the true nucleating agent in PLLA/OA-m blends.
 | ||
| Fig. 12 WAXD patterns of OA-a and OA-m particles. | ||
Fig. 13 shows the POM images of PLLA blends with 1 wt% OA-a and OA-m in the molten state. The bright spots in OA-a1% and OA-m1% indicate the pristine OA-a and dehydration-transformed OA-a, respectively, and their size distribution histograms are displayed in Fig. S4.† In contrast to the pristine OA-a in OA-a1% with a particle size of 2.67 ± 1.39 μm, the dehydration-transformed OA-a in OA-m1% tends to agglomerate together and has a larger particle size of 4.95 ± 4.33 μm, showing a uneven dispersion in the PLLA melt. On the other hand, from Fig. 13, it can be seen that the amount of dehydration-transformed OA-a in OA-m1% is smaller than that of pristine OA-a in OA-a1%. This fact is due to the loss of 1 mol water per mol of OA-m. The final concentration of dehydration-transformed OA-a is theoretically ∼10.3% lower than that of pristine OA-a at the same loading level. It is worth stressing that the poor dispersion and the less nucleation sites for PLLA/OA-m blends can also be evidenced by Fig. 9. Consequently, the negative role of bound water of OA-m and its dehydration transition in nucleation effects on PLLA crystallization is attributed to the deteriorated dispersion and the reduced active concentration of dehydration-transformed OA-a in PLLA/OA-m blends, as compared with pristine OA-a in PLLA/OA-a blends.
 | ||
| Fig. 13 POM micrographs of molten PLLA containing 1 wt% (a) OA-a and (b) OA-m. | ||
Up to date, the nucleation phenomena of polymer crystallization induced by NAs have been successfully elucidated by chemical or epitaxial nucleation mechanisms. With regard to the chemical nucleation, NA dissolves in the polymer melt and reacts with it through chain scission, giving rise to the formation of a new nucleating substance which can induce the nucleation of other polymer chains.56 According to the POM results illustrated in Fig. 13, it is observed that the pristine OA-a and dehydration-transformed OA-a almost do not dissolve in the PLLA melt. What's more, it has been identified that no chemical reaction occurs between OA-m and poly(3-hydroxybutyrate), a bacterial polyester which has similar chain structure to PLLA.43 Therefore, the nucleation of PLLA/OA blends should not be caused by chemical nucleation.
In the case of epitaxial nucleation, the existence of crystallographic relationships and the ability of forming favorable interactions between polymer and NA are the two key factors for the epitaxial growth of polymer chains on the NA surface.19 Taking into account the PLLA spherulite growing along the a-axis of unit cell,57 it thus appears that the b-axis and/or c-axis of PLLA may have the structural relation with OA unit cell. In view of the lattice parameters of PLLA α-form crystal: a = 10.78 Å, b = 6.04 Å, c = 28.73 Å, α = β = γ = 90°,55 indeed, a good matching can be found between the b-axis of PLLA (6.04 Å) and the b-axis of OA-a (5.964 Å) with a misfit of only 1.3%, suggesting a possible crystallographic relationship of [010]PLLA//[010]OA. On the other hand, earlier studies have reported that uracil and cyanuric acid can also act as efficient NAs for PLLA.26,35 Judging from the same groups of the three NAs as shown in Scheme 1, it can be deduced that the potential hydrogen bond interaction between the carbonyl groups in PLLA chains and the imino groups (in keto form) or the hydroxyl groups (in enol form) of OA molecules could stabilize the epitaxial growth process. Based on the above analysis, epitaxial nucleation is likely responsible for the accelerated effects of OA-a and OA-m on the crystallization of PLLA, but more in-depth research is still required to understand the exact mechanism.
 | ||
| Scheme 1 Chemical structures of (a) orotic acid, (b) uracil and (c) cyanuric acid. | ||
4. Conclusions
PLLA blends with anhydrous and monohydrated orotic acid were prepared via a melt-extruding method, and their nonisothermal crystallization behavior, isothermal crystallization kinetics, spherulite morphology and crystal structure from molten state were systematically investigated. Both the two forms of OA exhibit excellent nucleation effects on PLLA crystallization. With the incorporation of 0.2 wt% OA-a or OA-m, PLLA can finish the crystallization under cooling at 10 °C min−1, and the crystallization half-time as well as spherulite size decreases greatly, with these effects being more pronounced as increasing OA content up to 1 wt%. The bound water in OA does affect the nucleation effectiveness for PLLA crystallization, and OA-a shows a better nucleation ability than OA-m. Time-resolved FTIR results indicate that OA-a and OA-m accelerate the formation of both skeletal conformational-ordered structure and 103 helix structure of PLLA rather than alter the sequence of interchain and intrachain interactions. The poor dispersion state and the lowered concentration of dehydration-transformed OA-a are the two main reasons for the negative role of bound water of OA-m in PLLA crystallization. Through analysis of crystal lattice parameters and potential hydrogen bonds between PLLA and OA-a, it is suggested that the nucleation mechanism of PLLA/OA blends is epitaxial nucleation. In consideration of the higher nucleation efficiency of OA-a and the susceptibility to hydrolysis of PLLA, it is concluded that OA in the anhydrous form is more suitable to serve as a nucleating agent for fabricating high-performance PLLA biomaterials.Acknowledgements
This work was financially supported by the Scientific Research Funds of North University of China (No. 2015110246) and the Fundamental Research Funds for the Central Universities (No. DUT16QY38).References
- L. Shen, E. Worrell and M. Patel, Biofuels, Bioprod. Biorefin., 2010, 4, 25–40 CrossRef CAS.
- M. M. Reddy, S. Vivekanandhan, M. Misra, S. K. Bhatia and A. K. Mohanty, Prog. Polym. Sci., 2013, 38, 1653–1689 CrossRef CAS.
- S. S. Bari, A. Chatterjee and S. Mishra, Polym. Rev., 2016, 56, 287–328 CrossRef CAS.
- J. M. Raquez, Y. Habibi, M. Murariu and P. Dubois, Prog. Polym. Sci., 2013, 38, 1504–1542 CrossRef CAS.
- I. Armentano, N. Bitinis, E. Fortunati, S. Mattioli, N. Rescignano, R. Verdejo, M. A. Lopez-Manchado and J. M. Kenny, Prog. Polym. Sci., 2013, 38, 1720–1747 CrossRef CAS.
- G. Koronis, A. Silva and M. Fontul, Composites, Part B, 2013, 44, 120–127 CrossRef CAS.
- R. A. Giordano, B. M. Wu, S. W. Borland, L. G. Cima, E. M. Sachs and M. J. Cima, J. Biomater. Sci., Polym. Ed., 1996, 8, 63–75 CrossRef CAS PubMed.
- S. Z. Guo, M. C. Heuzey and D. Therriault, Langmuir, 2014, 30, 1142–1150 CrossRef CAS PubMed.
- E. Castro-Aguirre, F. Iniguez-Franco, H. Samsudin, X. Fang and R. Auras, Adv. Drug Delivery Rev., 2016, 107, 333–366 CrossRef CAS PubMed.
- V. Nagarajan, A. K. Mohanty and M. Misra, ACS Sustainable Chem. Eng., 2016, 4, 2899–2916 CrossRef CAS.
- S. Saeidlou, M. A. Huneault, H. Li and C. B. Park, Prog. Polym. Sci., 2012, 37, 1657–1677 CrossRef CAS.
- G. Liu, X. Zhang and D. Wang, Adv. Mater., 2014, 26, 6905–6911 CrossRef CAS PubMed.
- M. Naffakh, C. Marco and G. Ellis, CrystEngComm, 2014, 16, 5062–5072 RSC.
- H. Zhao, Y. Bian, M. Xu, C. Han, Y. Li, Q. Dong and L. Dong, CrystEngComm, 2014, 16, 3896–3905 RSC.
- F. De Santis and R. Pantani, J. Polym. Res., 2015, 22, 242 CrossRef.
- J. Wu, X. Zou, B. Jing and W. Dai, Polym. Eng. Sci., 2015, 55, 1104–1112 CAS.
- X. Gong, L. Pan, C. Y. Tang, L. Chen, C. Li, C. Wu, W.-C. Law, X. Wang, C. P. Tsui and X. Xie, Composites, Part B, 2016, 91, 103–110 CrossRef CAS.
- J. Jia, J. Yang, Y. Zhao, H. Liang and M. Chen, RSC Adv., 2016, 6, 43855–43863 RSC.
- S. Ouchiar, G. Stoclet, C. Cabaret and V. Gloaguen, Macromolecules, 2016, 49, 2782–2790 CrossRef CAS.
- N. Kawamoto, A. Sakai, T. Horikoshi, T. Urushihara and E. Tobita, J. Appl. Polym. Sci., 2007, 103, 198–203 CrossRef CAS.
- P. Pan, Z. Liang, A. Cao and Y. Inoue, ACS Appl. Mater. Interfaces, 2009, 1, 402–411 CAS.
- H. Nakajima, M. Takahashi and Y. Kimura, Macromol. Mater. Eng., 2010, 295, 460–468 CAS.
- Q. Xing, X. Zhang, X. Dong, G. Liu and D. Wang, Polymer, 2012, 53, 2306–2314 CrossRef CAS.
- W. C. Lai and J. P. Liao, Mater. Chem. Phys., 2013, 139, 161–168 CrossRef CAS.
- Y. Xu and L. Wu, Eur. Polym. J., 2013, 49, 865–872 CrossRef CAS.
- M. Weng and Z. Qiu, Thermochim. Acta, 2014, 577, 41–45 CrossRef CAS.
- Y. H. Cai, Y. H. Zhang and L. S. Zhao, J. Polym. Res., 2015, 22, 246 CrossRef.
- P. Ma, Y. Xu, T. Shen, W. Dong, M. Chen and P. J. Lemstra, Eur. Polym. J., 2015, 70, 400–411 CrossRef CAS.
- V. Nagarajan, A. K. Mohanty and M. Misra, J. Appl. Polym. Sci., 2016, 133, 43673 CrossRef.
- T. Shen, Y. Xu, X. Cai, P. Ma, W. Dong and M. Chen, RSC Adv., 2016, 6, 48365–48374 RSC.
- Q. Xing, Z. Wang, R. Li, X. Dong and D. Wang, RSC Adv., 2016, 6, 113377–113389 RSC.
- Y. Tachibana, T. Maeda, O. Ito, Y. Maeda and M. Kunioka, Polym. Degrad. Stab., 2010, 95, 1321–1329 CrossRef CAS.
- J. Cai, M. Liu, L. Wang, K. Yao, S. Li and H. Xiong, Carbohydr. Polym., 2011, 86, 941–947 CrossRef CAS.
- Z. Qiu and Z. Li, Ind. Eng. Chem. Res., 2011, 50, 12299–12303 CrossRef CAS.
- P. Pan, J. Yang, G. Shan, Y. Bao, Z. Weng and Y. Inoue, Macromol. Mater. Eng., 2012, 297, 670–679 CrossRef CAS.
- N. G. V. Fundador, Y. Enomoto-Rogers, A. Takemura and T. Iwata, Polym. Degrad. Stab., 2013, 98, 1064–1071 CrossRef CAS.
- R. Zhang, Y. Wang, K. Wang, G. Zheng, Q. Li and C. Shen, Polym. Bull., 2013, 70, 195–206 CrossRef CAS.
- W. Yang, E. Fortunati, F. Dominici, J. M. Kenny and D. Puglia, Eur. Polym. J., 2015, 71, 126–139 CrossRef CAS.
- P. Dhar, S. M. Bhasney, A. Kumar and V. Katiyar, Polymer, 2016, 101, 75–92 CrossRef CAS.
- F. Lu, H. Yu, C. Yan and J. Yao, RSC Adv., 2016, 6, 46008–46018 RSC.
- M. J. Carbone, M. Vanhalle, B. Goderis and P. Van Puyvelde, J. Polym. Eng., 2015, 35, 169–180 CrossRef CAS.
- N. Jacquel, K. Tajima, N. Nakamura, T. Miyagawa, P. Pan and Y. Inoue, J. Appl. Polym. Sci., 2009, 114, 1287–1294 CrossRef CAS.
- N. Jacquel, K. Tajima, N. Nakamura, H. Kawachi, P. Pan and Y. Inoue, J. Appl. Polym. Sci., 2010, 115, 709–715 CrossRef CAS.
- A. Tsui and C. W. Frank, Polymer, 2014, 55, 6364–6372 CrossRef CAS.
- D. E. Braun, K. P. Nartowski, Y. Z. Khimyak, K. R. Morris, S. R. Byrn and U. J. Griesser, Mol. Pharm., 2016, 13, 1012–1029 CrossRef CAS PubMed.
- E. W. Fischer, H. J. Sterzel and G. Wegner, Kolloid Z. Z. Polym., 1973, 251, 980–990 CAS.
- P. Pan, W. Kai, B. Zhu, T. Dong and Y. Inoue, Macromolecules, 2007, 40, 6898–6905 CrossRef CAS.
- R. Androsch, E. Zhuravlev and C. Schick, Polymer, 2014, 55, 4932–4941 CrossRef CAS.
- B. Fillon, J. C. Wittmann, B. Lotz and A. Thierry, J. Polym. Sci., Part B: Polym. Phys., 1993, 31, 1383–1393 CrossRef CAS.
- B. Fillon, B. Lotz, A. Thierry and J. C. Wittmann, J. Polym. Sci., Part B: Polym. Phys., 1993, 31, 1395–1405 CrossRef CAS.
- M. Avrami, J. Chem. Phys., 1939, 7, 1103–1112 CrossRef CAS.
- M. Avrami, J. Chem. Phys., 1940, 8, 212–224 CrossRef CAS.
- V. Krikorian and D. J. Pochan, Macromolecules, 2005, 38, 6520–6527 CrossRef CAS.
- X. Hu, H. An, Z. M. Li, Y. Geng, L. Li and C. Yang, Macromolecules, 2009, 42, 3215–3218 CrossRef CAS.
- T. Miyata and T. Masuko, Polymer, 1997, 38, 4003–4009 CrossRef CAS.
- R. Legras, J. P. Mercier and E. Nield, Nature, 1983, 304, 432–434 CrossRef CAS.
- M. Gazzano, M. L. Focarete, C. Riekel and M. Scandola, Biomacromolecules, 2004, 5, 553–558 CrossRef CAS PubMed.
Footnote |
| † Electronic supplementary information (ESI) available. See DOI: 10.1039/c7ra02617j |
| This journal is © The Royal Society of Chemistry 2017 |