 Open Access Article
Creative Commons Attribution 3.0 Unported Licence
Binding of Euplotes octocarinatus centrin to peptide from xeroderma pigmentosum group C protein (XPC)†
Enxian Shiab,
Wenlong Zhanga,
Yaqin Zhao a and
Binsheng Yang
 *a
*a
aInstitute of Molecular Science, Key Laboratory of Chemical Biology of Molecular Engineering of Education Ministry, Shanxi University, Taiyuan 030006, PR China. E-mail: yangbs@sxu.edu.cn; Fax: +86-351-7016358
bDepartment of Pharmacy, Shanxi Medical University, Taiyuan 030001, PR China
First published on 22nd May 2017
Abstract
Centrins are Ca2+-binding proteins that belong to the EF-hand (or calmodulin) superfamily, which are highly conserved among eukaryotes. To probe whether Euplotes octocarinatus centrin (EoCen) could replace human centrin 2 (HsCen2), herein, we chose a 22-residue peptide (K842–R863) from the human xeroderma pigmentosum group C protein (XPC), a dominant component of the nuclear excision repair (NER) pathway, and investigated the detailed structural and energetic characterization of the interaction with EoCen using spectrophotometric methods, native PAGE and isothermal titration calorimetry (ITC). Fluorescence and UV difference spectroscopy revealed that the well-conserved tryptophan residue was buried in the hydrophobic pocket exposed by the C-terminal domain of EoCen. The native PAGE indicated that a new band appeared corresponding to a complex which was exclusively mediated by C-terminal domain of EoCen. Circular dichroism (CD) showed that peptide underwent a random coil-to-helix structural transition upon binding to the centrin, and ITC suggested centrin–peptide interactions were driven by an enthalpic contribution, which compensated for the unfavorable (negative) entropy term. Also, the affinity reduced by a factor of 4.67 compared with HsCen2, mainly due to V108 of the EoCen substitution for L112 of HsCen2.
1. Introduction
Centrins are small (∼20 kDa), acidic, Ca2+-binding proteins that belong to the EF-hand calmodulin (CaM) superfamily. The first members of centrins to be discovered were in the unicellular green algae Tetraselmis striata1 and Chlamydomonas reinhardtii, as major components of the Ca2+-sensitive contracting fibers associated with the basal bodies.2,3 Afterwards orthologous centrins were also observed in many eukaryotes, e.g. yeast,4 higher plants,5 invertebrates6 and humans.7,8 Only one isoform existed in the lower eukaryotes, such as green algae and yeast; however, four isoforms have been discovered in the higher eukaryotes. Only about 10% (ref. 9) of the centrins are concentrated on the microtubule organizer centers (MTOC), which are structurally and functionally similar to basal bodies in ciliated and flagellated cells, the spindle pole bodies (SPB) in yeast and the centrosome in higher eukaryotes. Centrins regulate the duplication and segregation of MTOC during the cell cycle.10,11 In addition, the majority of centrins are localized in the nucleus region, where they play diverse roles. HsCen2 has been demonstrated to participate in the nuclear excision repair (NER) inside the nucleus,12,13 and in the export of mRNA from the nucleus.14 Other possible implications were also found in the regulation of the G-protein transducin (Gt) in photoreceptor cells15 or in the activity of the paramecium ciliary reversal-coupled voltage-gated Ca2+ channels.16The biological functions of centrins require an association with diverse protein targets in various cellular processes. In yeast SPB, centrins interact with three proteins in the half-bridge, Kar1p,4 Mps3p17 and Sfi1.18 Kar1p and Mps3p has a transmembrane domain and are likely involved with the lipid bilayer of the half-bridge. However, Sfi1, which plays a critical role in SPB duplication and has ∼20 centrin-binding motifs, does not have a transmembrane domain. XPC,12 which possesses only one centrin-binding site, triggers NER and recognizes bulk DNA lesions. The yeast complex of Sac3 (ref. 19) with Sus1 and Cdc31 promotes nuclear pore association and mRNA export. Transducin, a G-protein from visual signal transduction, is also a potential centrin target in mammalian photoreceptor cells.15 Furthermore, HsCen2, HsCen3 and EoCen can bind to melittin, a natural peptide from bee venom mimicking CaM targets.20–23 Centrins bind targets mainly through the hydrophobic triad W1xxL4xxxL8, which was first identified in XPC. However, the binding motif is in the opposite orientation, L8xxxL4xxW1, in centrin's other targets (Sac3, Sfi1 and transducin).
Ciliate Euplotes octocarinatus centrin (EoCen) was first reported by our laboratory,24 and is cloned from E. octocarinatus; the precise biological functions remain to be determined. EoCen is a protein of 168 residues, which shares about 60, 62 and 66% sequence identity with HsCen1, HsCen2 and HsCen3, respectively, and shares approximately 50% sequence identity with the well-studied EF-hand protein CaM. Like CaM, centrin is organized into two independent domains tethered by a central linker, each domain consisting of a pair of EF-hand motifs of helix-loop-helix that can potentially bind two Ca2+ ions.25 Sequence analysis and the available experimental data suggest that the diversity among various centrins stems from the first 20-residue fragment and this stretch is absent in standard CaM.26 Earlier biochemical and physicochemical experiments have demonstrated that the N-terminal fragment plays a critical role in self-assembly,27–30 whereas the C-terminal fragment is strongly conserved and contributes to the target recognition of centrin.31–33 Our group have reported that the melittin binding is mainly mediated by the C-terminal fragment of EoCen (Ka ∼ 106 M−1).22,23,34
Human heterodimer XPC/hHR23B behaved as a damage detector that initiated the global genome NER,35 and centrin 2 interacts with the heterodimer physically and stimulates the NER process.13 In Arabidopsis thaliana, the homolog of Atcen2 and AtRad4 interacted to modulate the repair efficiency of bulk DNA lesions.36 Also, the yeast ortholog Rad4–Rad23 and human XPC–Rad23B showed almost equal binding affinities to the damaged DNA duplex, and recognized DNA lesions in analogous methods.37 The NER protein Rad33 showed a functional resemblance to the centrin homologue Cdc31.38 However, the XPC homologue in Euplotes octocarinatus has not been identified yet. The centrin-binding motif of XPC homologs from species were strongly conserved (see Fig. 6B), so we chose a 22-residue synthetic peptide derived from human XPC to study the peptide recognition of EoCen. Whether P22-XPC could substitute Euplotes octocarinatus XPC protein or EoCen could substitute HsCen2 may be the first step to understand the possibility of NER in Euplotes octocarinatus. We characterized the structural and energetic aspects of the interaction and explained the lower affinity compared with HsCen2 from the amino acid sequence. Our results revealed biochemical features of centrin binding to XPC and provide insights into the molecular mechanism of centrin functions in the cellular context.
2. Experimental
2.1 Reagents
Ethylene diamine tetraacetic acid (EDTA), 4-(2-hydroxyethyl)-1-piperazineethane sulfonic acid (Hepes), potassium chloride and other solvents were all analytic grade reagents. L-Tryptophan was chromatographically pure.2.2 Protein expression and purification
For the expression and purification of intact Euplotes octocarinatus centrin, the N-terminal domain and C-terminal domains were carried out according to our previous publications.24 After purification, the proteins were kept at −20 °C, and the stock protein solutions were conserved in 10 mM Hepes, 100 mM KCl, pH 7.4.2.3 Peptide synthesis
The peptide derived from human xeroderma pigmentosum group C (P22-XPC; KRALGNWKLLAKGLLIRERLKR), Lys842–Arg863 (ref. 31 and 39) covering the crucial centrin-binding region was synthesized by Wuhan Fine Peptide Co., Ltd. The purity of the XPC peptide was greater than 98%, as indicated by HPLC. The molecular mass was verified by microelectrospray ionization mass spectrometry.2.4 UV spectroscopy
UV spectra were recorded using a Varian Cary 50 Bio UV-Visible Spectrophotometer. Each decalcified protein was diluted to 10 mM Hepes, 100 mM KCl, pH 7.4. The peptide concentration was assessed spectrophotometrically using an extinction coefficient of 5500 M−1 cm−1 at 280 nm. The protein concentration was determined using an extinction coefficients of 5600 (EoCen) M−1 cm−1 and of 1400 (C-EoCen) and 4350 (N-EoCen) M−1 cm−1 at 280 nm. The sample included 77.4 μM of individual compounds or of the equimolar mixtures. The concentration of tryptophan in different solvents was 55 μM.2.5 Fluorescence emission spectroscopy
Binding of the XPC peptide to EoCen, N-EoCen, and C-EoCen was monitored by fluorescence spectroscopy. The experiments were performed on a Fluoromax-4 spectrofluorometer (HORIBA Jobin Yvon, France). The excitation wavelength was set at 280 nm, and fluorescence emission spectra were recorded from 295 to 450 nm, with all slit widths set to 5 nm, using quartz cuvettes. The sample buffer contained 10 mM Hepes, 100 mM KCl, pH 7.4. The sample included 8 μM of individual compounds or of equimolar mixtures. To attenuate the interference from the tyrosine residue in EoCen, the excitation wavelength was set at 295 nm in the titration experiments. Aliquots of a 480 μM protein sample were added into an XPC peptide solution 8 μM (initial concentration) and incubated for 3 min. The emission spectrum was recorded over the range 305–450 nm. About 20 data points were collected per titration over protein–peptide molar ratios of 0–2. To correct the dilution effect, the fluorescence intensity was converted to molar fluorescence intensity by dividing the fluorescence intensity by the analytical concentration of the XPC peptide. Also, changes in the fluorescence intensity at 331 nm were assigned to the complex and the data were fitted to a single-site binding model using SigmaPlot 10.0 (shown in ESI†).2.6 Gel electrophoresis
The electrophoretic mobility of the protein was evaluated by nondenaturing polyacrylamide gel electrophoresis (PAGE) under discontinuous conditions as a modified technique described by Beckingham.40 Polyacrylamide gels contained 390 mM Tris (pH 8.8), 0.1% ammonium persulfate, and 15% acrylamide/bis (29![[thin space (1/6-em)]](https://www.rsc.org/images/entities/char_2009.gif) :
:![[thin space (1/6-em)]](https://www.rsc.org/images/entities/char_2009.gif) 1). To induce polymerization, 0.1% TEMED was added. A tris-glycine electrophoresis running buffer was composed of 25 mM Tris (pH 8.3) and 250 mM glycine. All electrophoreses were performed at room temperature. The gels were run at a constant current of 11–12 mA for 2 h. The gels were stained with Coomassie blue R-250 for 5 min, and washed in distilled water for 2 h.
1). To induce polymerization, 0.1% TEMED was added. A tris-glycine electrophoresis running buffer was composed of 25 mM Tris (pH 8.3) and 250 mM glycine. All electrophoreses were performed at room temperature. The gels were run at a constant current of 11–12 mA for 2 h. The gels were stained with Coomassie blue R-250 for 5 min, and washed in distilled water for 2 h.
2.7 Isothermal titration calorimetry (ITC)
The thermodynamic parameters of the molecular interactions between EoCen (intact EoCen and two isolated domains) and target peptide (P22-XPC) at 30 °C were investigated by ITC using a MicroCal iTC200 instrument (Malvern Instruments Ltd. UK). The proteins and peptide in the presence of EDTA were equilibrated in the same buffer (10 mM Hepes, 100 mM KCl, pH 7.4). The centrins (77.1 μM) in the calorimeter cell were titrated with the target peptide (1540 μM) by successive automatic injections of 0.5 μL each. The first injection of 0.2 μL was ignored in the final data analysis. Integration of the peaks corresponding to each injection and a correction for baseline were performed using the Origin-based software provided by the manufacturer. The data were fit to an interaction model to generate the stoichiometry (n), equilibrium binding constant (Ka), and enthalpy of complex formation (ΔH). The free energy (ΔG) was determined using the following equations: ΔG = −RT![[thin space (1/6-em)]](https://www.rsc.org/images/entities/char_2009.gif) ln(Ka), where R (1.987 cal mol−1) is the gas constant and T (303.15 K) is the absolute temperature, and ΔG = ΔH − TΔS. The following units were used: affinity constant (Ka) M−1; Gibbs energy change (ΔG) kcal mol−1; enthalpy change (ΔH) kcal mol−1; and entropy change (ΔS) kcal (mol K)−1. Titrations were performed in triplicate. To determine the dilution/mixing heat, control experiments was performed by injecting the peptide solution into the buffer.
ln(Ka), where R (1.987 cal mol−1) is the gas constant and T (303.15 K) is the absolute temperature, and ΔG = ΔH − TΔS. The following units were used: affinity constant (Ka) M−1; Gibbs energy change (ΔG) kcal mol−1; enthalpy change (ΔH) kcal mol−1; and entropy change (ΔS) kcal (mol K)−1. Titrations were performed in triplicate. To determine the dilution/mixing heat, control experiments was performed by injecting the peptide solution into the buffer.
2.8 Far-UV circular dichroism (CD)
CD experiments were performed on a Chirascan spectrometer (Applied Photophysics Ltd. UK) continuously purged by N2 and equipped with a temperature-control system. Far-UV spectra were recorded between 200 and 250 nm using 1 mm quartz cells. The spectra were collected as an average of three scans with a step size of 1 nm and a bandwidth of 1 nm. The samples were dissolved in 10 mM Hepes, and 100 mM KCl (pH 7.4). The concentrations of the full-length EoCen, C-terminal domain and N-terminal domain were all 7.84 μM. The buffer signal was digitally subtracted using software provided by the manufacturer. For the P22-XPC titration, small aliquots of 0.47 mM peptide solution were added to achieve an XPC peptide to proteins molar ratio of 0.25–2. To correct for dilution and to normalize the results from different titrations, the CD data were converted to molar ellipticity by dividing the analytical concentration of protein.3. Results and discussion
3.1 Interaction with XPC peptide monitored by micro-environment change of Trp
In proteins, the Trp residue is often regarded as an intrinsic fluorescent probe to monitor protein conformational change, because the indole chromophore is very sensitive to changes in the surrounding microenvironment.41 The XPC peptide contains only one tryptophan residue, whereas EoCen includes no tryptophan and has four tyrosine residues which are not sensitive to the micro-environment. The maximum emission wavelength of the peptide alone was situated at 356 nm (line b in Fig. 1A–C), reflecting the exposure of the indole moiety to the highly polar environment. Adding 1 equivalent of XPC peptide to the intact protein or its C-terminal fragment solution resulted in 1.65-fold and 1.40-fold increases in intensity, respectively, accompanied by a blue-shift (from 356 to 331 nm) of the emission maximum, which manifested that the complex was formed in the absence of Ca2+ ion (that is, in the presence of EDTA). At the same time, fluorescence spectra of the intact protein as well as the C-terminal fragment were scanned as a control (line a in Fig. 1A and B), respectively. However, for the N-terminal fragment, the maximum emission of the equimolar mixture remained unchanged, which suggested that the N-terminal was not significantly engaged in peptide binding. The environmental sensitivity of the fluorescence parameters of the peptide binding to centrin strongly suggested that the indole fluorophore was oriented in a hydrophobic cavity exposed by the protein, resembling other Trp-containing target peptides bound to CaM42 or centrin.20,43–45 Moreover, the fluorescence intensity and the shape of the emission spectra still kept unchanged even when the salt concentrations reached 2 M (Fig. S1C†), which implied that the complex formation was mainly mediated by a hydrophobic interaction and the electrostatic interaction played negligible role.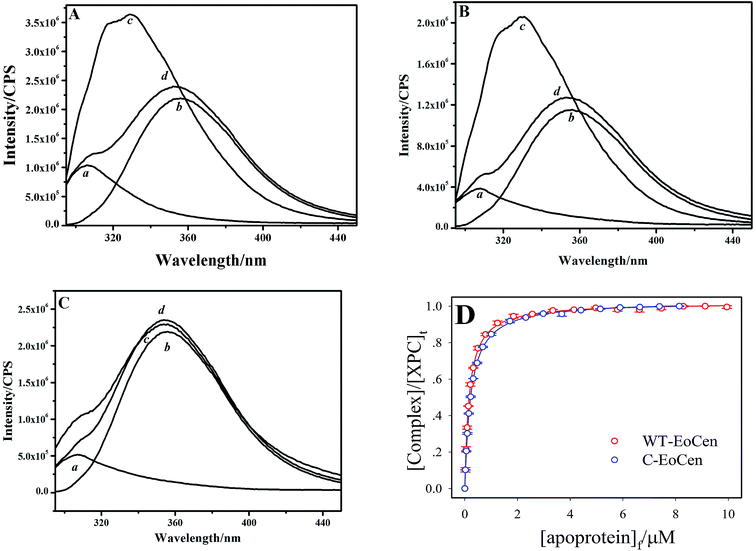 | ||
| Fig. 1 Interaction between the XPC peptide and apoprotein measured by the Trp fluorescence of XPC in 10 mM Hepes, 100 mM KCl (pH 7.4) in the presence of EDTA for WT-EoCen (A), C-EoCen (B), and N-EoCen (C). Samples contain 2 mL of 8 μM of the individual compounds or of the equimolar mixture. (a) Protein, (b) XPC peptide, (c) complex of protein/XPC, (d) the calculated sum spectra of same concentrations of protein and XPC peptide. Binding isotherms for the interaction of XPC peptide with EoCen (red) and C-EoCen (blue) (D). Data points are an average of three experiments. Solid lines represent the best fits, according to eqn (4) in ESI.† | ||
Successive titration proteins to XPC peptide solution resulted in an increase in intensity at 331 nm and an isosbestic point appeared at 378 and 367 nm for EoCen and C-EoCen, respectively (Fig. S1A and B†). The isosbestic point indicated that there were only two distinct species in the system, namely the XPC peptide and complex. The Trp fluorescence change represented the formation of a 1![[thin space (1/6-em)]](https://www.rsc.org/images/entities/char_2009.gif) :
:![[thin space (1/6-em)]](https://www.rsc.org/images/entities/char_2009.gif) 1 complex (inset of Fig. S1A and B†). The binding isotherms were obtained by changes in intensity at 331 nm vs. the free concentrations of protein (Fig. 1D) and were well fitted to a one-site model using an iteration method (Fig. S2†) and produced a dissociation constant Kd of (0.22 ± 0.01) and (0.17 ± 0.01) μM for the C-terminal fragment and intact protein, respectively (see ESI†), almost in agreement with the values obtained by calorimetry titrations (Table 2).
1 complex (inset of Fig. S1A and B†). The binding isotherms were obtained by changes in intensity at 331 nm vs. the free concentrations of protein (Fig. 1D) and were well fitted to a one-site model using an iteration method (Fig. S2†) and produced a dissociation constant Kd of (0.22 ± 0.01) and (0.17 ± 0.01) μM for the C-terminal fragment and intact protein, respectively (see ESI†), almost in agreement with the values obtained by calorimetry titrations (Table 2).
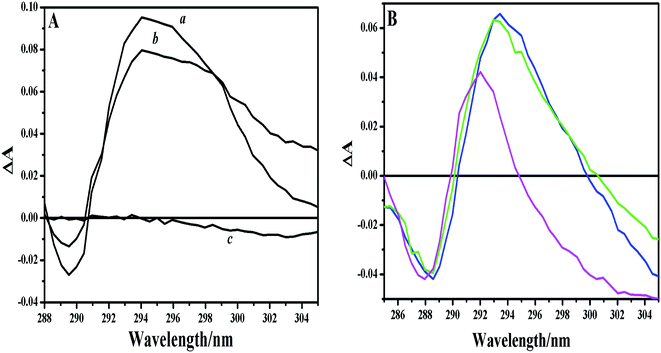
Additional support for this structural detail was provided by UV difference spectra of tryptophan residue. EoCen contains no cysteine or tryptophan and has four tyrosine residues and ten phenylalanine residues, so UV spectra of intact and isolated fragments of EoCen were characteristic of tyrosine and phenylalanine (line b in Fig. S3A–C†). The absorption bands at 253, 259, 265 and 269 nm were due to the absorption by Phe,20 and those at 279 and 286 nm were attributed to the absorption of Tyr.46,47 The XPC peptide contains only one tryptophan, so the peptide showed the representative profile of tryptophan (the absorption wavelengths were at 280 and 290 nm) (line c in Fig. S3A–C†). It is important to emphasize that absorption at about 290 nm is only for the tryptophan residue and ruled out contributions from phenylalanines or tyrosines in protein. However, there were no apparent differences between the spectra of equimolar mixtures and the sum of the spectra of individual components. To highlight the alteration to the environment of tryptophan in the peptide, UV difference spectra were obtained by subtracting the calculated sum from experimental values (Fig. 2A). A positive peak can be seen centered about 294 nm and a negative peak situated at 289 nm for the intact protein and the C-terminal domain, indicating the change of environment around Trp. To verify the effect, UV spectra of tryptophan in different solvents were performed (Fig. S3D†). The absorption wavelength of tryptophan in H2O was located at 288 nm, and shifted to 291 nm in each of DMSO, DMF, and dioxane. The UV difference spectra of tryptophan in different solvents showed an increase in absorbance as the positive peaks centered at about 293 nm and a decrease in absorbance as the negative peaks situated at 289 nm (Fig. 2B). The control experiment demonstrated that the shifts of peaks resulted from the increase in apolarity of the micro-environment around Trp. This was firstly demonstrated by our group although UV spectra were less sensitive than fluorescence spectra.41 In contrast, there was no change when the N-terminal fragment was incubated with XPC peptide, indicating no measurable interaction. So, a conclusion can also be drawn that the micro-environment around the Trp residue in the peptide changed from a polar water solvent to a more hydrophobic interface upon complex formation.
3.2 Native PAGE assay
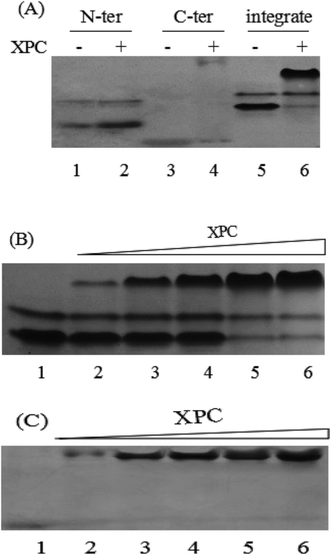
In our research, the complex formation of EoCen with the peptide was monitored on the native PAGE, which is possibly the most highly resolving electrophoretic method yet established for separating proteins. The centrin superfamily is characterized by an additional N-terminal segment of about 20 residues with a basic property and high sequence diversity, which are absent in calmodulin and other Ca2+-binding proteins.26 It is the distinction between centrin and CaM that result in the centrins' unique character, namely aggregation, as has been corroborated by our group.29,30 From Fig. 3A (lane 1 and lane 5), two bands with different mobilities for the full length and N-terminal domain of EoCen could be observed, which implied two distinct conformations of the protein. The bottom band that migrated faster contributed to the monomers, and the top clear band that migrated more slowly corresponded to the multimers. By contrast, the C-terminal domain had less tendency to self-association and possessed a smaller molecule weight and exhibited a much more negative net charge among these proteins, so the position of it was much closer to the bottom of the gel (the positive pole) (Fig. 3A lane 3).After apoprotein was incubated with the XPC peptide with a ratio of 1![[thin space (1/6-em)]](https://www.rsc.org/images/entities/char_2009.gif) :
:![[thin space (1/6-em)]](https://www.rsc.org/images/entities/char_2009.gif) 1 at 4 °C overnight, the sample was analyzed by native PAGE. It could be seen that a clear new band appeared with a mobility slightly slower than that of EoCen, indicating the formation of the peptide–centrin complex, among which the positively charged XPC peptide alone could not migrate to the anode in this native system. And the band of monomers and multimers faded simultaneously (Fig. 3A lane 6), suggesting the addition of the peptide inhibited the centrin's aggregation. Similar observations occurred for the C-terminal domain of EoCen. The complex of C-EoCen and the XPC peptide with increasing molecule weight and decreasing negative net charge from 8 to 1 comparing with C-EoCen, was positioned at the top of the gel, migrating most slowly. In addition, the interaction between the XPC peptide and N-EoCen was also investigated. As shown in Fig. 3A (lane 2), no new complex band could be observed even though the ratio of XPC peptide to N-EoCen reached 5.0 and the reaction time extended to 48 h (data not shown). The parameters of EoCen and its complex are listed in Table 1. EoCen and C-EoCen were acidic proteins, having a lower pI value (between 4.40 and 4.90), and the XPC peptide contained 8 basic residues, having a higher pI value (12.02). As alluded to above, the interaction between EoCen and XPC was mediated exclusively by the C-terminal domain. Although the net charge of the N-terminal domain is −6, no complex formed with the XPC peptide, proving that the hydrophobic interaction dominated without a significant electrostatic component. With the increasing ratio of peptide to apoprotein, the complex band became highlighted and the monomers and multimers faded away gradually (Fig. 3B and C). The new band reached a maximal intensity at an equimolar mixture of both proteins. Native PAGE was a visual inspection to detect the existence of the complex.
1 at 4 °C overnight, the sample was analyzed by native PAGE. It could be seen that a clear new band appeared with a mobility slightly slower than that of EoCen, indicating the formation of the peptide–centrin complex, among which the positively charged XPC peptide alone could not migrate to the anode in this native system. And the band of monomers and multimers faded simultaneously (Fig. 3A lane 6), suggesting the addition of the peptide inhibited the centrin's aggregation. Similar observations occurred for the C-terminal domain of EoCen. The complex of C-EoCen and the XPC peptide with increasing molecule weight and decreasing negative net charge from 8 to 1 comparing with C-EoCen, was positioned at the top of the gel, migrating most slowly. In addition, the interaction between the XPC peptide and N-EoCen was also investigated. As shown in Fig. 3A (lane 2), no new complex band could be observed even though the ratio of XPC peptide to N-EoCen reached 5.0 and the reaction time extended to 48 h (data not shown). The parameters of EoCen and its complex are listed in Table 1. EoCen and C-EoCen were acidic proteins, having a lower pI value (between 4.40 and 4.90), and the XPC peptide contained 8 basic residues, having a higher pI value (12.02). As alluded to above, the interaction between EoCen and XPC was mediated exclusively by the C-terminal domain. Although the net charge of the N-terminal domain is −6, no complex formed with the XPC peptide, proving that the hydrophobic interaction dominated without a significant electrostatic component. With the increasing ratio of peptide to apoprotein, the complex band became highlighted and the monomers and multimers faded away gradually (Fig. 3B and C). The new band reached a maximal intensity at an equimolar mixture of both proteins. Native PAGE was a visual inspection to detect the existence of the complex.
| Proteins | Number of amino acids | MW (kDa) | pI | Number of positively charged residues | Number of negatively charged residues | Total charge |
|---|---|---|---|---|---|---|
| a Data available on the web site http://web.expasy.org/protparam/. | ||||||
| XPC | 22 | 2.6 | 12.02 | 1 | 8 | +7 |
| Cen | 168 | 19.7 | 4.65 | 39 | 26 | −13 |
Cen–XPC (1![[thin space (1/6-em)]](https://www.rsc.org/images/entities/char_2009.gif) : :![[thin space (1/6-em)]](https://www.rsc.org/images/entities/char_2009.gif) 1) 1) |
190 | 22.3 | 5.15 | 40 | 34 | −6 |
| C-Cen | 79 | 9.2 | 4.47 | 20 | 12 | −8 |
C-Cen–XPC (1![[thin space (1/6-em)]](https://www.rsc.org/images/entities/char_2009.gif) : :![[thin space (1/6-em)]](https://www.rsc.org/images/entities/char_2009.gif) 1) 1) |
101 | 11.8 | 5.60 | 21 | 20 | −1 |
| N-Cen | 101 | 11.9 | 4.87 | 23 | 17 | −6 |
| N-Cen + XPC | 123 | 14.5 | 7.87 | 24 | 25 | +1 |
3.3 High-affinity binding of XPC peptide to EoCen
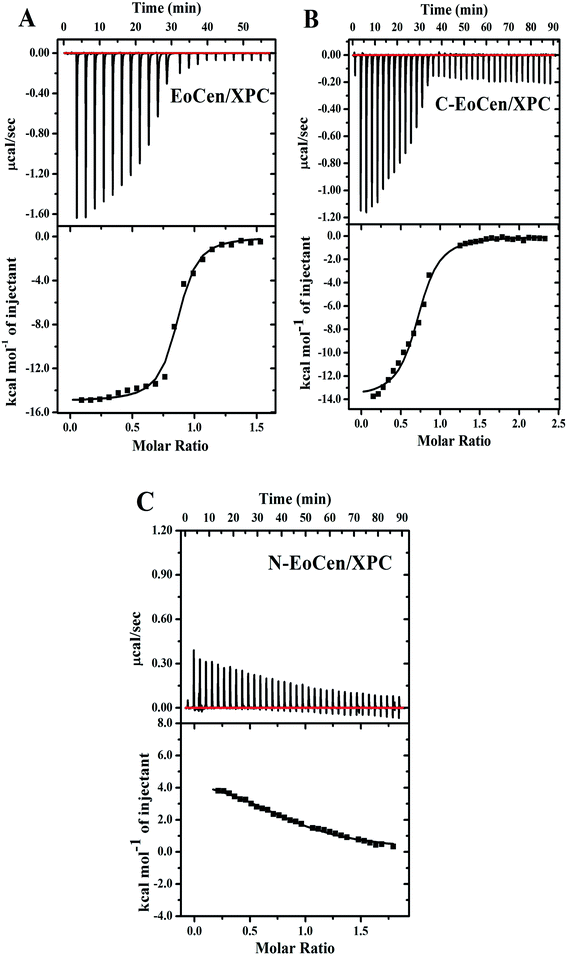
The binding properties of the P22-XPC peptide to EoCen were investigated using ITC, an efficient method for the determination of the affinity constant and the energetic balance of molecular interactions. The raw ITC data and the binding isotherms corresponding to the interaction of the XPC peptide with apoEoCen and its two isolated domains are shown in Fig. 4, and the total thermodynamics parameters for the three proteins are presented in Table 2. For the integral protein, the change in enthalpy (ΔH) was negative, indicating that the binding reaction was exothermic. Under the experimental conditions (in the presence of EDTA), the isotherm for the integral protein indicated a single binding event with a stoichiometry of 1![[thin space (1/6-em)]](https://www.rsc.org/images/entities/char_2009.gif) :
:![[thin space (1/6-em)]](https://www.rsc.org/images/entities/char_2009.gif) 1 and a high affinity Ka = (1.67 ± 0.35) × 106 M−1. The large reaction enthalpy change greatly overcame the entropy component to the free energy of interaction. The metal-free form of C-EoCen interacted with the peptide with a similar affinity ((0.46 ± 0.09) × 106 M−1) and the binding was enthalpically driven (ΔH = −13.88 kcal mol−1, at 30 °C). The association constant for the isolated C-EoCen was 3.6-fold smaller than that of the high-affinity site in the integral protein in the present conditions. The stoichiometry was also one, meaning that the C-terminal domain of EoCen had only one site for XPC. These results confirmed that the C-terminal domain of EoCen could bind the target even in the absence of Ca2+ ions. Indeed, the free energy of the peptide binding to C-EoCen contributed 92% of that of the integral protein.
1 and a high affinity Ka = (1.67 ± 0.35) × 106 M−1. The large reaction enthalpy change greatly overcame the entropy component to the free energy of interaction. The metal-free form of C-EoCen interacted with the peptide with a similar affinity ((0.46 ± 0.09) × 106 M−1) and the binding was enthalpically driven (ΔH = −13.88 kcal mol−1, at 30 °C). The association constant for the isolated C-EoCen was 3.6-fold smaller than that of the high-affinity site in the integral protein in the present conditions. The stoichiometry was also one, meaning that the C-terminal domain of EoCen had only one site for XPC. These results confirmed that the C-terminal domain of EoCen could bind the target even in the absence of Ca2+ ions. Indeed, the free energy of the peptide binding to C-EoCen contributed 92% of that of the integral protein.
| Protein | N | Ka(error) (106 M−1) | ΔH(error) (kcal mol−1) | TΔS (kcal mol−1) | ΔG (kcal mol−1) |
|---|---|---|---|---|---|
| a NB = no binding measured in the present conditions. | |||||
| EoCen | 0.84 | 1.67(0.35) | −14.98(0.25) | −6.61 | −8.37 |
| C-EoCen | 0.97 | 0.46(0.09) | −13.88(0.42) | −6.15 | −7.73 |
| N-EoCen | NB | ||||
In the case of N-EoCen, the heating rate was very small, and remained nearly constant during the titration, failing to show a detectable interaction in the present conditions. ITC measurements revealed again that the unique binding site in apoEoCen was situated in the C-terminal domain and the centrin–peptide interactions were driven by the enthalpy contribution, which compensated for the unfavorable (negative) entropy component.
3.4 Conformational change of the interaction
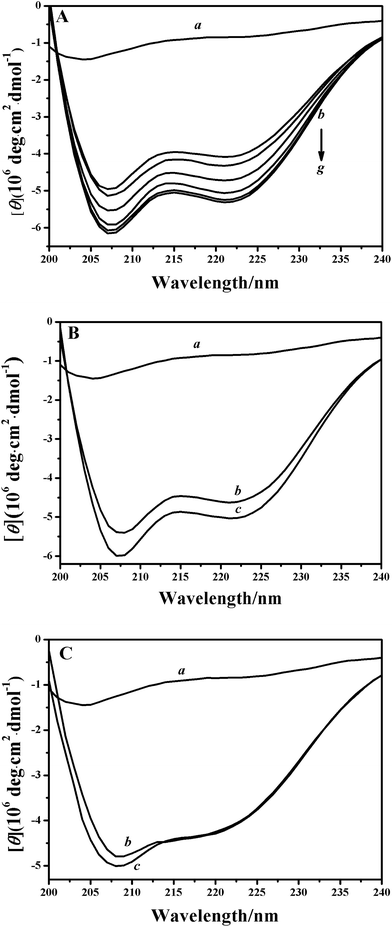
CD spectroscopy was used as an elementary investigation tool to characterize the conformation properties of the EoCen/peptide interaction. As shown in Fig. 5, the far-UV CD spectrum of apoproteins showed two negative bands at 222 and 208 nm,48 which is typical for a well-folded protein with an α-helical secondary structure. As anticipated, the free peptide in the aqueous solution had a random coil-type spectrum, with a negative peak at 203 nm.21,31,44,46 Adding 1 equivalent of XPC to the C-EoCen solution induced a moderate enhancement (by 26%) in the molar ellipticity, which suggested that the peptide underwent a random coil-to-helix transition upon binding to the protein. Doubling the peptide-to-protein ratio (2![[thin space (1/6-em)]](https://www.rsc.org/images/entities/char_2009.gif) :
:![[thin space (1/6-em)]](https://www.rsc.org/images/entities/char_2009.gif) 1) was not accompanied by obvious CD changes, in perfect agreement with the ITC-obtained 1
1) was not accompanied by obvious CD changes, in perfect agreement with the ITC-obtained 1![[thin space (1/6-em)]](https://www.rsc.org/images/entities/char_2009.gif) :
:![[thin space (1/6-em)]](https://www.rsc.org/images/entities/char_2009.gif) 1 stoichiometry. The restricted conformational freedom associated with the peptide transition should overcome the dehydration effect (related to an increase in water entropy), and accounted for the overall negative (unfavorable) entropy contribution to the free energy of interaction (Table 2).
1 stoichiometry. The restricted conformational freedom associated with the peptide transition should overcome the dehydration effect (related to an increase in water entropy), and accounted for the overall negative (unfavorable) entropy contribution to the free energy of interaction (Table 2).
In the case of the integral protein (Fig. 5B), the addition of the peptide led to a slightly smaller (by ∼10%) increase in intensity. In contract, there was negligible change when the peptide was added into the N-EoCen solution (Fig. 5C). So, the interaction of EoCen with the XPC peptide was predominantly mediated by the C-terminal fragment while the N-terminal was not involved in complex formation. These findings indicated that the centrin–peptide interaction resulted in well organized, ordered and stable structures.
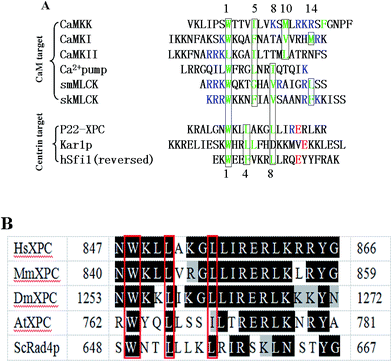
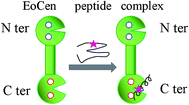
Base on certain physicochemical techniques, we characterized the peptide binding properties of the highly purified EoCen. Exposure of the hydrophobic surface is instrumental for peptide binding. Contrary to CaM, the C-terminal domain of centrin adopted the open conformation even in the absence of Ca2+,49,50 the N-terminal occupied a closed conformation in the metal-free form and adopted open conformation only in metal-saturated form. Consequently, this may explain the high affinity of C-EoCen to XPC in a metal-free state, while the N-terminal domain is not engaged in peptide recognition. In other words, the binding of EoCen to peptide is Ca2+-independent, although Ca2+ ions could enhance the affinity (unpublished result). This means EoCen can bind to XPC in the absence of a Ca2+ ion, and trigger the NER system. In the light of the position of the bulk hydrophobic residues that anchor the surface (Fig. 6A), the CaM binding motifs have been grouped into four categories: 1-5-10, 1-8-14, 1-16 and IQ motifs.42,51,52 The binding modes of the CaM interaction with its target are described as the canonical wrap-around mode, extended mode and dimerization mode. The centrin-binding sequence of XPC is categorized as a 1-4-8 motif (Fig. 6B), a subclass of the 1-14 motif. In addition to the difference in structure between CaM and centrin, the binding sequence of XPC is not long enough to span the two terminals. According to previous work56,57 and the data reported in the work, the binding mode of EoCen to P22-XPC is in the extended mode (Fig. 8).
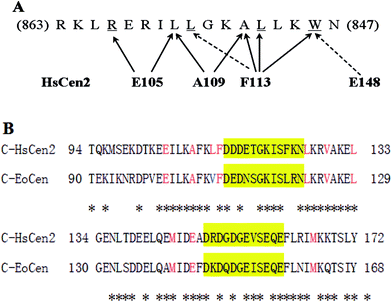
From fluorescence and UV difference spectra, Trp, which is highly conserved and critical anchoring residue, transfers from the polar water solvent to the apolar hydrophobic surroundings. A complex still could form even in conditions with a high salt concentration. Native PAGE analysis also reflects that the electrostatic component is not a primary force. Two crystal structures of the full-length (2ggm.pdb)53 and truncated HsCen2 in complex with an XPC peptide (2obh.pdb),54 and NMR structure of C-HsCen2 complexed with XPC peptide (2a4j.pdb)55 have been reported. The structure from ref. 53 shows that nine non-polar residues of HsCen2 (L133, L112, M145, F113, M166, L126, A109, E105 and V129) contact with the triad of the XPC peptide (W1xxL4xxxL8) and the Trp residue is buried in the hydrophobic pocked created by the C-terminal and two EF-hand motifs (Fig. 7A). Besides, the carboxyl group of E148 established a hydrogen bond with the Trp residue of the XPC peptide.33 Sequence analysis shows that C-EoCen (90T-168Y) shares 71% sequence identity with C-HsCen2 (94T-172Y), and, what is more, eight non-polar residues that bind to the XPC peptide and E144 residue (corresponding to the E148 residue in HsCen2) are completely conserved (Fig. 7B), so we surmise that the force between EoCen and the XPC peptide is predominantly a hydrophobic interaction.
The XPC peptide, which is an amphiphilic molecule and exhibits a disordered structure in the absence of the protein, folds into an α helix upon binding to centrin, which induces the structural rearrangement and decrease in flexibility, giving a negative entropic term to the free energy of interaction. The centrin/XPC peptide interaction is driven by a negative enthalpy change. The affinity constants are 1.67 × 10⁶ M−1 and 0.46 × 10⁶ M−1 for EoCen and C-EoCen, respectively, by ITC. While the constants are 5.88 × 10⁶ M−1 and 4.55 × 10⁶ M−1 for EoCen and C-EoCen, respectively, by spectrofluorimetric titration. There is little difference in the constants by the two measurement methods. Fluorescence spectroscopy is very sensitive for the tryptophan residue and requires a lower concentration of the sample, whereas ITC needs a higher concentration of the sample and is imprecise during the fitness of data. The reduced affinity by a factor of 4.67 by comparison with HsCen2 obtained from ITC is the result of at least two main reasons. One is related to the amino acid sequence difference, V108 in EoCen vs. L112 in HsCen2. Holes formed by the Val residue in EoCen differ from those formed by the Leu residue in HsCen2, so the affinity constants vary. In other words, the fitness of interfaces between the key and hole causes the difference in the binding affinity. The side chain of the Val residue lacks one methylene by comparison with the Leu residue. The difference between the Val and Leu residues results in the distinct interface hydrophobicities. The other reason is that the human XPC peptide is not a native target molecule of EoCen. There is only one centrin isoform in Euplotes octocarinatus, so EoCen must participate in the duplication and separation of MTOCs and in the NER process. We offer a glimpse into the centrin function in the cell process with the aid of the human XPC peptide and infer the possibility of NER throughout the lower eukaryotic kingdom, which will motivate us to explore the mechanism further.
4. Conclusions
The work represents a structural and thermodynamic characterization of a 22-residue peptide (K842–R863) from human XPC binding to Euplotes octocarinatus centrin using spectroscopic methods, native PAGE, and ITC. Comparisons of the corresponding results for integral protein and isolated fragments show that the residues of the C-terminal are critical for the interaction with the XPC peptide, and the N-terminal domain is structurally independent from the peptide-bound C-terminal domain. Fluorescence and UV difference spectra of the intrinsic Trp manifest the highly conserved Trp residue deeply embed in the hydrophobic cavity formed by the C-terminal domain. CD and ITC suggest that the complex formation results in a more helical content, and a well-organized structure. The new complex was visualized by native PAGE. The affinity decreases 4.67 fold in comparison with that of HsCen2. The amino acids that contact with the XPC peptide and the binding mode both resemble those of HsCen2. The only difference lies in V108 in the EoCen substitution for L112 in HsCen2. The distinction of the interface hydrophobicity and the fitness of interfaces between the key and hole causes the difference in the binding affinity.Acknowledgements
The work was supported by the National Natural Science Foundation of the PR China (No. 21571117) and the Ph.D. Programs Foundation of the Ministry of Education of China (20131401110011). We thank Scientific Instrument Center of Shanxi University for the help with ITC measurements.References
- J. L. Salisbury, A. Baron, B. Surek and M. Melkonian, J. Cell Biol., 1984, 99, 962–970 CrossRef CAS PubMed
.
- B. Huang, A. Mengersen and V. D. Lee, J. Cell Biol., 1988, 107, 133–140 CrossRef CAS PubMed
.
- M. A. Sanders and J. L. Salisbury, J. Cell Biol., 1994, 124, 795–805 CrossRef CAS PubMed
.
- P. Baum, C. Furlong and B. Byers, Proc. Natl. Acad. Sci. U. S. A., 1986, 83, 5512–5516 CrossRef CAS
.
- J. K. Zhu, R. A. Bressan and P. M. Hasegawa, Plant Physiol., 1992, 99, 1734–1735 CrossRef CAS PubMed
.
- U. Wolfrum, Biol. Cell., 1992, 76, 373–381 CrossRef CAS PubMed
.
- V. D. Lee and B. Huang, Proc. Natl. Acad. Sci. U. S. A., 1993, 90, 373–381 CrossRef
.
- R. Errabolu, M. A. Sanders and J. L. Salisbury, J. Cell Sci., 1994, 107, 9–16 CAS
.
- A. Paoletti, M. Moudjou, M. Paintrand, J. L. Salisbury and M. Bornens, J. Cell Sci., 1996, 109, 3089–3102 CAS
.
- J. L. Salisbury, K. M. Suino, R. Busby and M. Springett, Curr. Biol., 2002, 12, 1287–1292 CrossRef CAS PubMed
.
- S. Middendorp, T. Küntziger, Y. Abraham, S. Holmes, N. Bordes, M. Paintrand, A. Paoletti and M. Bornens, J. Cell Biol., 2000, 148, 405–416 CrossRef CAS PubMed
.
- M. Araki, C. Masutani, M. Takemura, A. Uchida, K. Sugasawa, J. Kondoh, Y. Ohkuma and F. Hanaoka, J. Biol. Chem., 2001, 276, 18665–18672 CrossRef CAS PubMed
.
- R. Nishi, Y. Okuda, E. Watanabe, T. Mori, S. Iwai, C. Masutani, K. Sugasawa and F. Hanaoka, Mol. Cell. Biol., 2005, 25, 5664–5674 CrossRef CAS PubMed
.
- T. Fischer, S. Rodríguez-Navarro, G. Pereira, A. Rácz, E. Schiebel and E. Hurt, Nat. Cell Biol., 2004, 6, 840–848 CrossRef CAS PubMed
.
- A. Giessl, A. Pulvermüller, P. Trojan, J. H. Park, H. W. Choe, O. P. Ernst, K. P. Hofmann and U. Wolfrum, J. Biol. Chem., 2004, 279, 51472–51481 CrossRef CAS PubMed
.
- K. Gonda, A. Yoshida, K. Oami and M. Takahashi, Biochem. Biophys. Res. Commun., 2004, 323, 891–897 CrossRef CAS PubMed
.
- S. L. Jaspersen, T. H. Giddings and M. Winey, J. Cell Biol., 2002, 159, 945–956 CrossRef CAS PubMed
.
- J. V. Kilmartin, J. Cell Biol., 2003, 162, 1211–1221 CrossRef CAS PubMed
.
- D. Jani, S. Lutz, N. J. Marshall, T. Fischer, A. Köhler, A. M. Ellisdon, E. Hurt and M. Stewart, Mol. Cell, 2009, 33, 727–737 CrossRef CAS PubMed
.
- I. Durussel, Y. Blouquit, S. Middendorp, C. T. Craescu and J. A. Cox, FEBS Lett., 2000, 472, 208–212 CrossRef CAS PubMed
.
- J. A. Cox, F. Tirone, I. Durussel, C. Firanescu, Y. Blouquit, P. Duchambon and C. T. Craescu, Biochemistry, 2005, 44, 840–850 CrossRef CAS PubMed
.
- Y. Q. Zhao, J. Y. Feng, A. H. Liang and B. S. Yang, Chin. Sci. Bull., 2007, 52, 3216–3220 CrossRef CAS
.
- Y. Q. Zhao, J. Y. Feng, Z. J. Wang, A. H. Liang and B. S. Yang, Spectrochim. Acta, Part A, 2008, 70, 884–887 CrossRef PubMed
.
- X. J. He, J. Y. Feng, W. Wang, B. F. Chai, B. S. Yang and A. H. Liang, Acta Zool. Sin., 2004, 50, 447–451 CAS
.
- C. Weber, V. D. Lee, W. J. Chazin and B. Huang, J. Biol. Chem., 1994, 269, 15795–15802 CAS
.
- A. Yang, S. Miron, P. Duchambon, L. Assairi, Y. Blouquit and C. T. Craescu, Biochemistry, 2006, 45, 880–889 CrossRef CAS PubMed
.
- M. Tourbez, C. Firanescu, A. Yang, L. Unipan, P. Duchambon, Y. Blouquit and C. T. Craescu, J. Biol. Chem., 2004, 279, 47672–47680 CrossRef CAS PubMed
.
- H. Wiech, B. M. Geier, T. Paschke, A. Spang, K. Grein, J. Steinkötter, M. Melkonian and E. Schiebel, J. Biol. Chem., 1996, 271, 22453–22461 CrossRef CAS PubMed
.
- L. Duan, Y. Q. Zhao, Z. J. Wang, G. T. Li, A. H. Liang and B. S. Yang, J. Inorg. Biochem., 2008, 102, 268–277 CrossRef CAS PubMed
.
- Y. Q. Zhao, L. Song, A. H. Liang and B. S. Yang, J. Photochem. Photobiol., B, 2009, 95, 26–32 CrossRef CAS PubMed
.
- A. Popescu, S. Miron, Y. Blouquit, P. Duchambon, P. Christova and C. T. Craescu, J. Biol. Chem., 2003, 278, 40252–40261 CrossRef CAS PubMed
.
- H. T. Hu and W. J. Chazin, J. Mol. Biol., 2003, 330, 473–484 CrossRef CAS PubMed
.
- J. Martinez-Sanz, F. Kateb, L. Assairi, Y. Blouquit, G. Bodenhausen, D. Abergel, L. Mouawad and C. T. Craescu, J. Mol. Biol., 2010, 395, 191–204 CrossRef CAS PubMed
.
- Y. Q. Zhao, X. L. Diao, J. Yan, Y. N. Feng, Z. J. Wang, A. H. Liang and B. S. Yang, J. Lumin., 2012, 132, 924–930 CrossRef CAS
.
- K. Sugasawa, J. M. Ng, C. Masutani, S. Iwai, P. J. van der Spek, A. P. Eker, F. Hanaoka, D. Bootsma and J. H. J. Hoeijmakers, Mol. Cell, 1998, 2, 223–232 CrossRef CAS PubMed
.
- L. Liang, S. Flury, V. Kalck, B. Hohn and J. Molinier, Plant Mol. Biol., 2006, 61, 345–356 CrossRef CAS PubMed
.
- Y. S. Krasikova, N. I. Rechkunova, E. A. Maltseva, P. E. Pestryakov, I. O. Petruseva, K. Sugasawa, X. J. Chen, J.-H. Min and O. I. Lavrik, J. Biol. Chem., 2013, 288, 10936–10947 CrossRef CAS PubMed
.
- B. den Dulk, P. van Eijk, M. de Ruijter, J. A. Brandsma and J. Brouwer, DNA Repair, 2008, 7, 858–868 CrossRef CAS PubMed
.
- J. H. Park, A. Pulvermüller, P. Scheerer, S. Rausch, A. Gießl, W. Höhne, U. Wolfrum, K. P. Hofmann, O. P. Ernst, H.-W. Choe and N. Krauß, Vision Res., 2006, 46, 4568–4574 CrossRef CAS PubMed
.
- B. Wang, S. R. Martin, R. A. Newman, S. L. Hamilton, M. A. Shea, P. M. Bayley and K. M. Beckingham, Protein Sci., 2004, 13, 3285–3297 CrossRef CAS PubMed
.
- E. A. Burstein, N. S. Vedenkina and M. N. Ivkova, Photochem. Photobiol., 1973, 18, 263–279 CrossRef CAS PubMed
.
- A. Crivici and M. Ikura, Annu. Rev. Biophys. Biomol. Struct., 1995, 24, 85–116 CrossRef CAS PubMed
.
- B. M. Geier, H. Wiech and E. Schiebel, J. Biol. Chem., 1996, 271, 28366–28374 CrossRef CAS PubMed
.
- J. Martinez-Sanz, A. Yang, Y. Blouquit, P. Duchambon, L. Assairi and C. T. Craescu, FEBS J., 2006, 273, 4504–4515 CrossRef CAS PubMed
.
- H. T. Hu, J. H. Sheehan and W. J. Chazin, J. Biol. Chem., 2004, 279, 50895–50903 CrossRef CAS PubMed
.
- J. F. Maune, C. B. Klee and K. Beckingham, J. Biol. Chem., 1992, 267, 5286–5295 CAS
.
- Z. J. Wang, Y. Q. Zhao, L. X. Ren, G. T. Li, A. H. Liang and B. S. Yang, J. Photochem. Photobiol., A, 2007, 186, 178–186 CrossRef CAS
.
- W. C. Johnson, Proteins: Struct., Funct., Genet., 1999, 35, 307–312 CrossRef CAS
.
- E. Matei, S. Miron, Y. Blouquit, P. Duchambon, I. Durusse, J. A. Cox and C. T. Craescu, Biochemistry, 2003, 42, 1439–1450 CrossRef CAS PubMed
.
- S. Veeraraghavan, P. A. Fagan, H. T. Hu, V. Lee, J. F. Harper, B. Huang and W. J. Chazin, J. Biol. Chem., 2002, 277, 28564–28571 CrossRef CAS PubMed
.
- A. R. Rhoads and F. Friedberg, FASEB J., 1997, 11, 331–340 CAS
.
- K. L. Yap, J. Kim, K. Truong, M. Sherman, T. Yuan and M. Ikura, J. Struct. Funct. Genomics, 2000, 1, 8–14 CrossRef CAS PubMed
.
- J. R. Thompson, Z. C. Cyan, J. L. Salisbury and R. Kumar, J. Biol. Chem., 2006, 281, 18746–18752 CrossRef CAS PubMed
.
- J. B. Charbonnier, E. Renaud, S. Miron, M. H. Le Du, Y. Blouquit, P. Duchambon, P. Christova, A. Shosheva, T. Rose, J. F. Angulo and C. T. Craescu, J. Mol. Biol., 2007, 373, 1032–1046 CrossRef CAS PubMed
.
- A. Yang, S. Miron, L. Mouawad, P. Duchambon, Y. Blouquit and C. T. Craescu, Biochemistry, 2006, 45, 3653–3663 CrossRef CAS PubMed
.
- L. X. Ren, Y. Q. Zhao, J. Y. Feng, X. J. He, A. H. Liang and B. S. Yang, Chin. J. Inorg. Chem., 2006, 22, 87–90 CAS
.
- Y. Q. Zhao, J. Y. Feng, A. H. Liang and B. S. Yang, Spectrochim. Acta, Part A, 2009, 71, 1756–1761 CrossRef PubMed
.
Footnote |
| † Electronic supplementary information (ESI) available. See DOI: 10.1039/c7ra03079g |
| This journal is © The Royal Society of Chemistry 2017 |

