Bubble-template-assisted synthesis of hollow fullerene-like MoS2 nanocages as a lithium ion battery anode material†
Xiaoxia
Zuo‡
a,
Kun
Chang‡
*ab,
Jing
Zhao
c,
Zhengzheng
Xie
a,
Hongwei
Tang
a,
Bao
Li
a and
Zhaorong
Chang
*a
aCollaborative Innovation Center of Henan Province for Green Manufacturing of Fine Chemicals, School of Chemistry and Chemical Engineering, Henan Normal University, Xinxiang 453007, PR China. E-mail: czr_56@163.com
bNational Institute for Materials Science (NIMS), 1-1 Namiki, Tsukuba, Ibaraki 305-0044, Japan. E-mail: chang.kun@nims.go.jp
cBiomedical Research Institute, National Institute of Advanced Industrial Science and Technology (AIST), 1-1-1 Higashi, Tsukuba 305-8566, Japan
First published on 25th September 2015
Abstract
Inorganic fullerene (IF)-like structured materials have attracted considerable attention for electrochemical energy storage and conversion. In this report, we describe a facile method of synthesizing IF-MoS2 hollow structures with a diameter of ∼100 nm by a facile solution-phase reduction process to obtain a hollow MoSx precursor under ambient pressures before subsequent annealing of the material at high temperatures to form IF-MoS2 nanocages. TEM images at different reaction stages reveal the hollow structure spontaneously arising in the novel “close-edge” nanocages under the assistance of an ammonia cation bubble template. When evaluated as an anode material for lithium ion batteries, ex situ characterization indicates that these IF-MoS2 hollow nanocages can provide large expandable spaces for volume changes occurring during the cycles. Such a highly desired structure offers remarkably improved lithium storage performance including high reversible capacity and good cycling behavior and high rate capability.
Introduction
Hollow-structured materials are of great interest due to their electrochemical properties when used as electrodes in lithium ion batteries (LIBs) as a result of their unique structural features, stabilities and enhanced kinetics.1–3 During the past several decades, various approaches have focused on different types of hollow structures fabricated using different synthesis routes, including soft- or hard-template and self-assembly template-free methods.4–9 Most previous studies on preparing hollow-structured materials have focused on metal oxides, whereas the literature contains only a few reports of layered metal sulfides with intriguing hollow structures.10,11As a typical layered transition-metal sulfide, molybdenum disulfide (MoS2) has a structure analogous to that of graphite and is formed by van der Waals stacking of covalently bonded S–Mo–S layers into a close-packed hexagonal lattice.12–14 Being chemically and electronically active, MoS2 has shown great potential for use in electronic devices and in electrocatalysis, sensor and energy-storage applications.15–20 MoS2 occurs in nature predominantly in the form of a two-dimensional layered structure; in recent years, ultrathin, few-layer, and single-layer MoS2 structures have been extensively investigated.21–25 Actually, in the early 1990s, after the discovery of C60 (buckminsterfullerene) by Kroto et al. in 1985,26 Tenne et al. first reported on transition-metal dichalcogenides MX2 (X = Ti, Nb, Mo; X = S, Se) nanoparticles exhibiting layer-like structures, including MoS2 and WS2 nanoparticles, that can form closed-cage structures with polyhedral or nanotubular shapes.27–29 These new materials received the generic name “inorganic fullerene-like structures,” abbreviated as “IF”.30,31 Later, with the synthesis and characterization of MoS2 and WS2 fullerenes and nanotubes, inorganic fullerene-like materials began to constitute an important family of nanostructures with interesting properties and potential applications.32–34
However, previous reports on the synthesis of IF-MoS2 or WS2 describe hazardous or complicated routes, such as using H2S as a heat treatment,35 chemical vapor deposition (CVD),36 and a seed-assisted solution route followed by annealing,37 among others; the nature of these routes greatly restricts the development and applications of IF materials. Thus, the development of a new and facile synthesis method for IF materials is an important but underexplored topic.
Therefore, in this work, we present a facile process for the synthesis of hollow-structured IF-MoS2 nanocages with a diameter of ∼100 nm. The synthesis involves the facile reduction of (NH4)2MoS4 in an N-methyl-2-pyrrolidone (NMP) solution by an N2H4 aqueous solution to obtain the hollow MoSx precursor under ambient pressure, followed by an annealing process at high temperatures to form the IF-MoS2 nanocage. When used as an electrode material in LIB anodes, the proposed hollow IF-MoS2 nanocages deliver a high reversible capacity and stable cycling performance.
Results and discussion
Characterization of morphology and structure
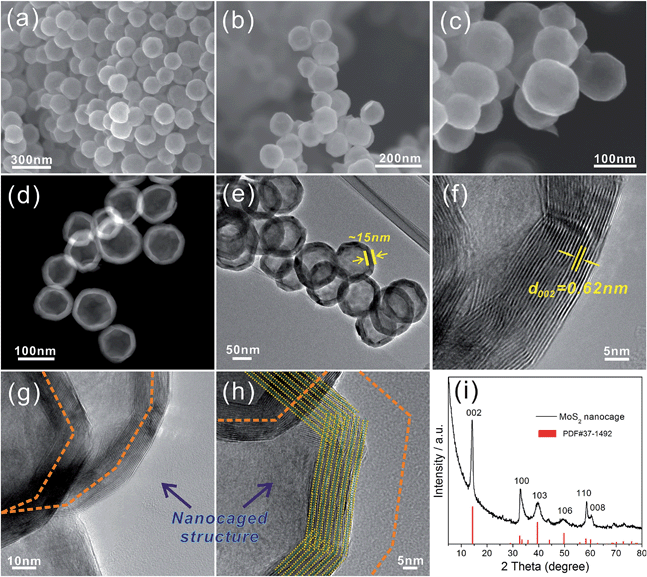
Fig. 1a to c show the general views of the obtained MoS2 nanoparticles at different magnifications. The proposed MoS2 particles exhibit a uniform polyhedral structure with a relatively smooth surface and a diameter of ∼100 nm. The STEM (Fig. 1d) and TEM (Fig. 1e) images indicate that the MoS2 exhibits a hollow structure with a thickness of ∼15 nm. Because the annealing was performed at 800 °C for 2 h under N2 gas protection, the MoS2 shell exhibits a well-established layered structure with an interlayer distance of 0.62 nm (Fig. 1f). The HRTEM images (Fig. 1g and h) show that the MoS2 shells actually consist of numerous nanosheets that spontaneously arise in the novel “close-edge” nanocages. The schematic of the microstructures of the MoS2 in Fig. 1h simulates the shell structure of an IF-MoS2 nanocage. Fig. 1i shows the XRD pattern, which indicates that the proposed MoS2 is a typical hexagonal structure and is in accordance with the structure established by PDF card number 37-1492. The primary (002) diffraction peak appears at 2θ = 14.2°, with a d-spacing of 0.62 nm, indicating that the layered MoS2 grows well along the c-axis, consistent with the measurement obtained from the HRTEM image in Fig. 1f.To determine the valence state of the elements, XPS measurements were carried out in the region from 0 to 1200 eV. As shown in Fig. 2a, the signal of Mo and S atoms could be indexed clearly. Fig. 2b shows a high-resolution Mo 3d spectrum, which contains the Mo 3d3/2 and 3d5/2 peaks at 232.38 eV and 229.24 eV, respectively, as the only two peaks, indicating the existence of only Mo(IV) in the compound. The peak at 226.40 eV is attributed to S 2s. Moreover, as shown in Fig. 2c, the high-resolution S 2p spectrum contains the S 2p1/2 peak at 163.20 eV and the S 2p3/2 peak at 162.09 eV, indicating that the products are stoichiometric MoS2. In addition, the EDX analysis of the products is shown in Fig. S1.† The calculated Mo-to-S atomic ratio is approximately 1![[thin space (1/6-em)]](https://www.rsc.org/images/entities/char_2009.gif) :
:![[thin space (1/6-em)]](https://www.rsc.org/images/entities/char_2009.gif) 2.08, which is approaching the theoretical value of MoS2.
2.08, which is approaching the theoretical value of MoS2.
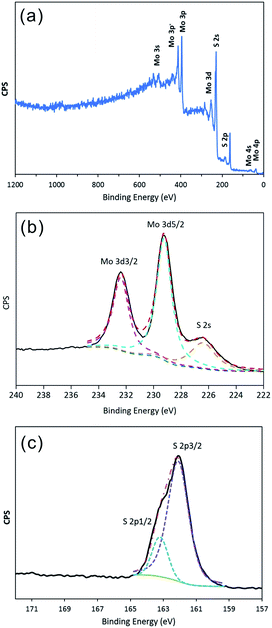 | ||
| Fig. 2 XPS spectrum of IF-MoS2 nanocages after annealing at 800 °C for 2 h under a N2 atmosphere: (a) survey spectra, and high-resolution of (b) Mo 3d and (c) S 2p. | ||
Analysis of growth mechanism
To determine the formation process for the hollow IF-MoS2 nanocages, the as-prepared molybdenum sulfide precursors were characterized using FESEM and TEM prior to annealing, as shown in Fig. 3. The precursor delivers uniform spherical nanoparticles with a diameter of ∼150 nm (Fig. 3a). The TEM images (Fig. 3b and c) indicate a hollow structure with a shell thickness of ∼20 nm. Compared with the size of the IF-MoS2 nanocages shown in Fig. 1, the diameter and shell thickness of the as-prepared MoSx precursor are significantly bigger, likely because of shrinkage during calcination. The HRTEM image (Fig. 3d) of a partial enlargement of the shell indicates amorphous MoSx in the precursor. This amorphous character was also demonstrated in the XRD pattern, as no obvious diffraction peak was observed (see Fig. S2†). Therefore, the valence state of the MoSx precursor was analyzed by XPS; the resulting spectra are shown in Fig. 4. Compared with the IF-MoS2 material, two new strong XPS peaks of C1s and O1s are detected in the survey scan of Fig. 4a. It might be attributed to the impurity of unwashed NMP and the carbon substrate of the XPS test. After high temperature treatment, the impurity can be removed. As evident in Fig. 4b, the high-resolution XPS spectrum of the Mo contains a Mo 3d3/2 peak at 231.80 eV and a Mo 3d5/2 peak at 228.78 eV as two rough peaks; these peaks were deconvoluted into several fine peaks of Mo(IV), Mo(V) and Mo(VI), where the MoSx precursor did not reduce thoroughly during the solution-phase reaction. Moreover, in the XPS spectrum of the S (as shown in Fig. 4c), with the exception of two peaks at 162.70 eV and 161.30 eV, which correspond to S 2p1/2 and S 2p3/2, other peaks are observed at approximately 168 eV. These peaks are attributed to S–N and S–O bonds, indicating that the precursor contains impurities. After the high-temperature treatment, the as-prepared MoSx precursor transforms into MoS2.38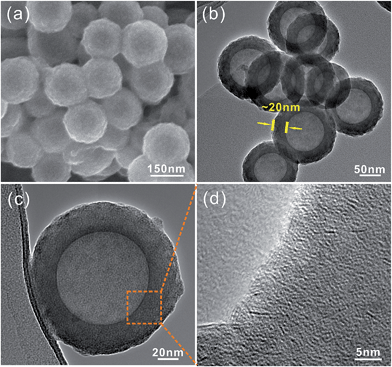 | ||
| Fig. 3 (a) FESEM image of the as-prepared MoSx; (b) and (c) TEM images of the MoSx; (d) HRTEM image of a partial enlargement of (c). | ||
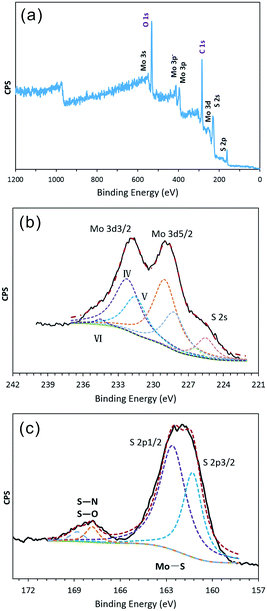 | ||
| Fig. 4 XPS spectrum of the as-prepared MoSx: (a) survey spectra, and high-resolution of (b) Mo 3d and (c) S 2p. | ||
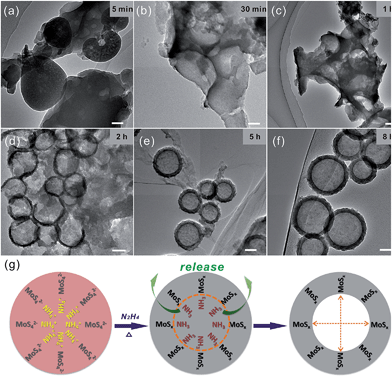
To illustrate the formation mechanism of the hollow-structured MoSx precursor, we conducted investigations using TEM to monitor the morphological evolution at different reaction stages. Fig. 5a shows that the MoSx precursor, which exhibits an irregular and amorphous morphology, is produced at the beginning of the reaction. Upon close observation, the products contain a large amount of pores, which are attributable to the release of NH3 gas produced during the reaction. As the reaction time increases, more (NH4)2MoS4 is reduced, causing more NH3 gas to be released, increasing the size of the pores. The MoSx precursor grows gradually around the NH3 bubbles, which serve as a template. In Fig. 5b and c, we observe that semi-finished hollow MoSx precursors with large pores form after 30 min and 1 h. When the reaction time increases to 2 h, as shown in Fig. 3d, regions of the MoSx precursor are observed to form hollow spherical structures with non-closed edges. Increasing the reaction time to 5 h and 8 h, we find that the shell edges of the MoSx precursor close and that the hollow spheres become discernible (Fig. 5e and f). On the basis of the aforementioned phenomenon, we conclude that the formation of the hollow structure of the MoSx precursor is caused by the generation of NH3 gas during the solution-phase reaction, which provides a bubble template for the growth of the MoSx before being released to form the hollow structure. The formation mechanism is illustrated in Fig. 5g. The selection of the reaction solvent is also important for preparing the hollow-structured MoSx spheres. In this work, NMP was used as the solvent. However, water, ethanol and other solvents do not result in hollow-structured MoSx spheres. The amorphous MoSx in the hollow spherical precursor is recrystallized at high temperatures and simultaneously reduced to layered MoS2. Finally, hollow IF-MoS2 nanocages are obtained after the high-temperature heat treatment.
Electrochemical performance
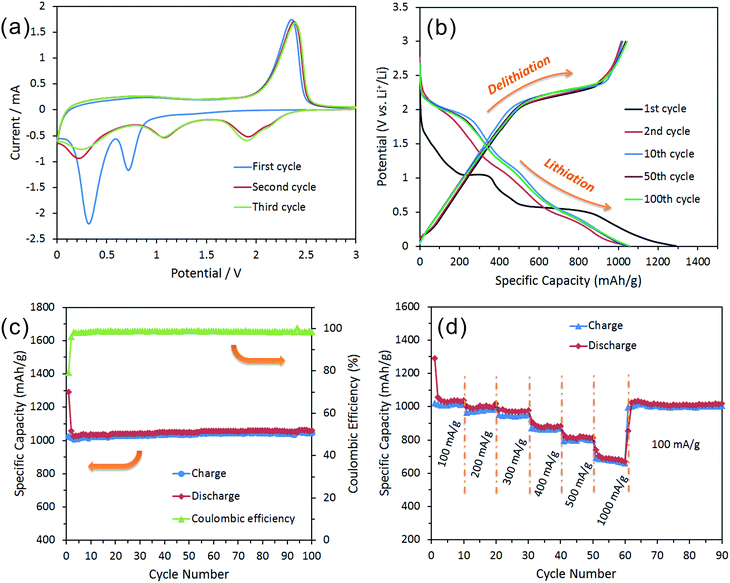
To demonstrate the advantages of these hollow IF-MoS2 nanocages, we investigated their electrochemical lithium storage properties as an anode material for LIBs and compared their performance to that of commercial MoS2. Fig. 6 shows the electrochemical performance of the hollow IF-MoS2 nanocage electrodes. The CV results of the proposed IF-MoS2 nanocages (Fig. 6a) are consistent with those of the commercial MoS2 (Fig. S3†) and with previously reported data.39–41 The first cycle shows two reduction peaks at approximately 0.8 and 0.4 V and one oxidation peak at approximately 2.3 V vs. Li/Li+. The reduction peak at 0.8 V is attributed to Li insertion into the interlayers of MoS2, accompanied by a phase transformation from the 2H to the 1T structure of LixMoS2.42 The second pronounced reduction peak is ascribed to the reduction of LixMoS2 to metallic Mo and Li2S via a conversion reaction, which is followed by the formation of a gel-like polymeric layer resulting from electrochemically driven electrolyte degradation.43 The oxidation peak at 2.3 V is attributed to the delithiation of Li2S: Li2S → S + 2Li.41,44 During the subsequent cathodic sweep, three other peaks appear at 2.0, 1.1 and 0.3 V. However, the peaks located at 0.8 and 0.4 V disappear, indicating that the lithiation and delithiation reaction of MoS2 are irreversible processes. To further illustrate this fact, the ex situ XRD analysis of the IF-MoS2 electrode was carried out after 100 cycles of charge and discharge (Fig. S4†). As shown in Fig. S4,† it can be seen that all the characteristic diffraction peaks of MoS2 had disappeared indicating that the amorphous products are generated. According to a previous report,45,46 the lithium storage mechanism in MoS2 can be expressed as:| First cycle: MoS2 + xLi+ + xe− → LixMoS2, | (1) |
| LixMoS2 + (4 − x)Li+ + (4 − x)e− → Mo + 2Li2S, | (2) |
| Subsequent cycles: Li2S ↔ 2Li + S. | (3) |
Fig. 6b shows the representative charge and discharge voltage profiles of the IF-MoS2 nanocages at a current density of 100 mA h g−1 within a cut-off window of 0.005–3.0 V. Consistent with the CV results, the first discharge curve shows two major plateau regions at approximately 1.0 and 0.5 V vs. Li/Li+; these results are approximately similar to those of the commercial MoS2 (Fig. S5†) and also agree with the results reported for other well-crystallized MoS2 electrodes.44,47 The initial discharge (lithiation) process leads to a very high specific capacity of 1289.7 mA h g−1, which greatly exceeds the capacity of the commercial MoS2, which has a capacity of 753.5 mA h g−1 (Fig. S5†). This high capacity of IF-MoS2 nanocages might be related to their hollow structure, which provides more surface active sites for lithium storage.3,10 The IF-MoS2 nanocage electrodes exhibit a high delithiation (charge) capacity of 1021.4 mA h g−1, which corresponds to a small irreversible capacity loss of 20.8%. Generally, the initial capacity loss is caused mainly by the incomplete conversion reaction and by irreversible lithium loss due to the formation of a solid electrolyte interphase (SEI) layer, where the decomposition of the electrolyte on the surface of the MoS2 forms a passivation layer on the electrode.48,49 After the first cycle, the specific capacity of the IF-MoS2 nanocage electrode stabilizes. All the subsequent cycles deliver an approximate overlap of the profiles associated with the lithiation and delithiation processes.
Fig. 6c shows the cycling behavior and coulombic efficiency of the IF-MoS2 nanocage electrode. A comparison of the cycling stability of the commercial MoS2 electrode (as shown in Fig. S6†) with that of the hollow-structured IF-MoS2 nanocages reveals that the nanocages exhibit a more stable cycling life, where the reversible capacity is as high as 1043.7 mA h g−1 after 100 cycles. This good capacity retention is likely related to the hollow nanocage structure, which provides a robust “skeleton” to avoid structural damage to the electrode during the cycling process. By contrast, the cyclic stability of the commercial MoS2 electrode (Fig. S6†) is so poor that the reversible capacity decreases from 632.4 mA h g−1 to 158.2 mA h g−1 after 75 cycles. In addition, the IF-MoS2 nanocage electrode also exhibits a high initial coulombic efficiency of 79.2%, which increases to almost 100% and after several cycles. Fig. 6d shows the rate cycling behavior of the IF-MoS2 nanocage electrode material. The high reversible capacity and excellent cycling behavior of the IF-MoS2 nanocages are reflected in their superior rate capability. The average specific capacities for the hollow IF-MoS2 nanocages are 1008, 987, 945, 862, 796, and 680 mA h g−1 at current densities of 100, 200, 300, 400, 500, and 1000 mA g−1, respectively. Remarkably, after cycling at 1000 mA g−1, a stable capacity of ∼1005 mA h g−1 is still delivered when the current density is reduced back to 100 mA g−1, indicating high cycling stability.
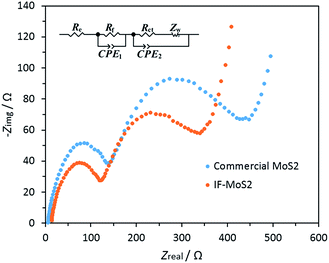
In general capacity fading is caused by expansive volume excursions in the active electrode material during charging and discharging; leading to the pulverization of material and loss of electrical connectivity. The IF-MoS2 electrode was therefore examined by ex situ SEM and TEM after 100 cycles of charge and discharge (Fig. 7). As shown in Fig. 7a and b, it can be seen that after 100 cycles the morphology of the IF-MoS2 hollow structure is basically retained, whereas the nanocaged structure changes into a nanosphere, indicating the formation of amorphous products after cycling, which is in agreement with the ex situ XRD analysis in Fig. S4.† Comparing with the Fig. 1e, as shown in Fig. 7b, it can be observed that the shell thickness of IF-MoS2 increases from ∼15 nm to ∼40 nm. This fact indicates that a large volume change (∼267%) of MoS2-based materials occurs during the charge and discharge process. The reason why the IF-MoS2 electrode can exhibit stable properties is therefore schematically illustrated in Fig. 7c. During the lithiation and delithiation process, MoS2 was transferred into amorphous Mo and S which is simultaneously accompanied by a large volume change. The proposed hollow-structured IF-MoS2 electrode provides enough expandable space to avoid the damage of the electrode, so that it can deliver a good cycling stability and high rate capability. Fig. 8 shows the electrochemical impedance spectrum (EIS) and the equivalent circuit model for both the IF-MoS2 nanocage and commercial MoS2 electrode materials. The kinetic differences in the IF-MoS2 nanocage and the commercial MoS2 electrode materials were further investigated by EIS modeling based on the modified equivalent circuit,50 using the fitted impedance parameters listed in Table 1. In this model system, Re represents the internal resistance of the test battery, Rf and CPE1 are associated with the resistance and constant phase element of the SEI film, Rct and CPE2 are associated with the charge-transfer resistance and constant phase element of the electrode/electrolyte interface, Zw is associated with the Warburg impedance corresponding to the lithium-diffusion process. In Fig. 8, the high frequency semicircle corresponds to the resistance Rf and CPE1 of the SEI film, the semicircle in the medium frequency region is assigned to the charge-transfer resistance Rct and CPE2 of the electrode/electrolyte interface. The inclined line corresponds to the lithium-diffusion process within bulk of the electrode material. From the analysis results, it is known that the SEI film resistance Rf and charge-transfer resistance Rct of the IF-MoS2 nanocage electrode material are 155.1 and 75.4 Ω, respectively, which are significantly lower than those of the commercial MoS2 (206.9 and 117.8 Ω). These results confirm that the hollow-nanocage structural MoS2 can provide more active sites and greater electrolyte–electrode contact area for lithium ion insertion and extraction compared to the bulk MoS2, indicating that this novel structural IF-MoS2 nanocage is a promising anode material for high-performance LIBs used in a wide range of applications.
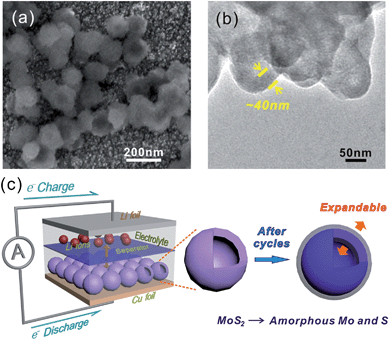 | ||
| Fig. 7 Ex situ SEM (a) and TEM (b) images of the IF-MoS2 electrode after 100 cycles, (c) schematic illustration of IF-MoS2vs. Li half-cell, before and after cycles of the IF-MoS2 electrode. | ||
| Electrodes | R e (Ω) | R f (Ω) | Q CPE1 (μF) | R ct (Ω) | Q CPE2 (μF) |
|---|---|---|---|---|---|
| c-MoS2 | 8.6 | 206.9 | 33.1 | 117.8 | 98.1 |
| IF-MoS2 | 17.2 | 155.1 | 39.3 | 75.4 | 254.6 |
Conclusions
In summary, we have developed a new and facile strategy for the synthesis of hollow IF-MoS2 nanocages with a uniform particle size of ∼100 nm. This method first involves the synthesis of hollow MoSx spheres by a facile solution-phase route and subsequent annealing of the obtained precursors at 800 °C for 2 h in an N2 atmosphere. TEM images collected at different reaction steps revealed the formation mechanism of the MoSx hollow structural precursor, which is caused by the generation of NH3 gas during the solution-phase reaction. This gas provides a bubble-like template for the growth of MoSx spheres and is subsequently released to form the hollow structures. After being annealed at a high temperature, the hollow MoSx precursor changes into hollow MoS2 consisting of numerous nanosheets, which spontaneously appear in the novel “close-edge” nanocages. The IF-MoS2 nanocages contain numerous active sites and exhibit a large electrolyte–electrode contact area and robust structure. As a result, when this material was evaluated as an anode material for LIBs, the hollow-structured IF-MoS2 nanocage could provide a large expandable space for volume changes occurring during the cycles, and therefore exhibited not only a high reversible capacity but also a remarkably stable capacity retention for 100 cycles and an enhanced rate capability at current densities as high as 1000 mA g−1.Experimental
Synthesis of hollow IF-MoS2 nanocages
All chemical reagents used in this work were of analytical grade. First, 0.5 mmol of ammonium tetrathiomolybdate ((NH4)2MoS4) was added to a 200 mL beaker with 80 mL of NMP. After sonicating and stirring for 3 h, the obtained clear solution was transferred into a 250 mL three-necked flask. Then, 5.0 mL of N2H4·H2O was added to the flask dropwise under magnetic stirring. Afterwards, the flask was heated to 80 °C in an oil bath and constantly stirred for 12 h under gentle reflux. After being naturally cooled, the black-brown precipitates were collected by centrifugation at 8000 rpm, washed sequentially with ethanol and deionized (DI) water, and then dried in a vacuum chamber at 80 °C overnight. The as-prepared MoSx was placed into a porcelain boat and kept in the center of a quartz tube placed inside a typical tubular furnace; the tube was then purged with nitrogen (N2) for 20 min to remove oxygen. The porcelain boat was subsequently heated to 800 °C at 5 °C min−1 under nitrogen flowing at 100 mL min−1. Two hours later, the furnace was allowed to cool to room temperature. The resulting black powder was used for further tests and characterization.Characterization
The samples were characterized using X-ray diffraction (XRD, RINT-2000, Rigaku Corp., Japan) with Cu-Kα1 radiation, field-emission scanning electron microscopy (FESEM, Hitachi S-4800), transmission electron microscopy (TEM, TECNAI G2 F30, Japan), and energy-dispersive X-ray spectroscopy (EDX, GENESIS 4000). The X-ray photoelectron spectroscopy (XPS) data were collected using a PHI Quantera SXM (ULVAC-PHI, Japan).Electrochemical measurements
The negative electrodes for the battery tests were composed of MoS2, acetylene black, and polyvinylidene fluoride (PVDF) in a weight ratio of 75![[thin space (1/6-em)]](https://www.rsc.org/images/entities/char_2009.gif) :
:![[thin space (1/6-em)]](https://www.rsc.org/images/entities/char_2009.gif) 10
10![[thin space (1/6-em)]](https://www.rsc.org/images/entities/char_2009.gif) :
:![[thin space (1/6-em)]](https://www.rsc.org/images/entities/char_2009.gif) 15. The mixture of the active material, acetylene black and PVDF was ground for 2 h in an agate mortar. The mixture was then dried in a vacuum oven at 80 °C for 4 h to remove any moisture. Afterwards, the NMP was injected to form a slurry, which was subsequently spread onto a copper foil with a thickness of 0.1 mm and a diameter of 12 mm, dried at 80 °C in a drying oven for 2 h, compacted using a hydraulic press and then dried again at 120 °C for 12 h in a vacuum drying chamber. Button cells (2025R) containing Li foil as a counter electrode, a polypropylene film (Celgard 2400) as a separator, and 1 M (mol L−1) LiPF6 in a mixture of ethylene carbonate/dimethyl carbonate/diethyl carbonate (EC/DMC/DEC 1
15. The mixture of the active material, acetylene black and PVDF was ground for 2 h in an agate mortar. The mixture was then dried in a vacuum oven at 80 °C for 4 h to remove any moisture. Afterwards, the NMP was injected to form a slurry, which was subsequently spread onto a copper foil with a thickness of 0.1 mm and a diameter of 12 mm, dried at 80 °C in a drying oven for 2 h, compacted using a hydraulic press and then dried again at 120 °C for 12 h in a vacuum drying chamber. Button cells (2025R) containing Li foil as a counter electrode, a polypropylene film (Celgard 2400) as a separator, and 1 M (mol L−1) LiPF6 in a mixture of ethylene carbonate/dimethyl carbonate/diethyl carbonate (EC/DMC/DEC 1![[thin space (1/6-em)]](https://www.rsc.org/images/entities/char_2009.gif) :
:![[thin space (1/6-em)]](https://www.rsc.org/images/entities/char_2009.gif) 1
1![[thin space (1/6-em)]](https://www.rsc.org/images/entities/char_2009.gif) :
:![[thin space (1/6-em)]](https://www.rsc.org/images/entities/char_2009.gif) 1 by volume) as an electrolyte were assembled in an argon-filled glovebox. Constant-current charge and discharge tests were performed on a cell test system (Land CT2001A) at potentials between 0.005 and 3.0 V. Cyclic voltammetry (CV) tests were carried out using an electrochemical workstation (CHI 660C) over a potential range from 0.005 to 3.0 V at a scan rate of 0.1 mV s−1. Electrochemical impedance tests were also performed using an electrochemical workstation (CHI 660C) over the frequency range from 0.01 Hz to 100 kHz and at an amplitude of 5 mV.
1 by volume) as an electrolyte were assembled in an argon-filled glovebox. Constant-current charge and discharge tests were performed on a cell test system (Land CT2001A) at potentials between 0.005 and 3.0 V. Cyclic voltammetry (CV) tests were carried out using an electrochemical workstation (CHI 660C) over a potential range from 0.005 to 3.0 V at a scan rate of 0.1 mV s−1. Electrochemical impedance tests were also performed using an electrochemical workstation (CHI 660C) over the frequency range from 0.01 Hz to 100 kHz and at an amplitude of 5 mV.
Acknowledgements
This work is financially supported by the Natural Science Foundation of China (No. 21071046), the Natural Science Foundation of China for Young (No. 21303042, No. 21203056), and the Program for Innovative Research Team in University of Henan Province (No. 14IRTSTHN005).References
- X. W. Lou, L. A. Archer and Z. C. Yang, Adv. Mater., 2008, 20, 3987–4019 CrossRef CAS.
- L. F. Shen, L. Yu, X. Y. Yu, X. G. Zhang and X. W. Lou, Angew. Chem., Int. Ed., 2015, 54, 1868–1872 CrossRef CAS PubMed.
- Z. Y. Wang, L. Zhou and X. W. Lou, Adv. Mater., 2012, 24, 1903–1911 CrossRef CAS PubMed.
- J. B. Joo, Q. Zhang, I. Lee, M. Dahl, F. Zaera and Y. D. Yin, Adv. Funct. Mater., 2012, 22, 166–174 CrossRef CAS.
- J. H. Sun, J. S. Zhang, M. W. Zhang, M. Antonietti, X. Z. Fu and X. C. Wang, Nat. Commun., 2012, 3, 1139 CrossRef.
- L. Yu, L. Zhang, H. B. Wu and X. W. Lou, Angew. Chem., Int. Ed., 2014, 53, 3711–3714 CrossRef CAS PubMed.
- H. Hu, B. Y. Guan, B. Y. Xia and X. W. Lou, J. Am. Chem. Soc., 2015, 137, 5590–5595 CrossRef CAS PubMed.
- L. F. Shen, L. Yu, H. B. Wu, X. Y. Yu, X. G. Zhang and X. W. Lou, Nat. Commun., 2015, 6, 6694 CrossRef CAS PubMed.
- L. N. Ye, C. Z. Wu, W. Guo and Y. Xie, Chem. Commun., 2006, 4738–4740, 10.1039/b610601c.
- X. Y. Yu, H. Hu, Y. W. Wang, H. Y. Chen and X. W. Lou, Angew. Chem., Int. Ed., 2015, 54, 7395–7398 CrossRef CAS PubMed.
- M. Wang, G. D. Li, H. Y. Xu, Y. T. Qian and J. Yang, ACS Appl. Mater. Interfaces, 2013, 5, 1003–1008 CAS.
- B. Radisavljevic, A. Radenovic, J. Brivio, V. Giacometti and A. Kis, Nat. Nanotechnol., 2011, 6, 147–150 CrossRef CAS PubMed.
- S. S. Chou, Y. K. Huang, J. Kim, B. Kaehr, B. M. Foley, P. Lu, C. Dykstra, P. E. Hopkins, C. J. Brinker, J. X. Huang and V. P. Dravid, J. Am. Chem. Soc., 2015, 137, 1742–1745 CrossRef CAS PubMed.
- C. L. Tan and H. Zhang, Chem. Soc. Rev., 2015, 44, 2713–2731 RSC.
- Y. G. Li, H. L. Wang, L. M. Xie, Y. Y. Liang, G. S. Hong and H. J. Dai, J. Am. Chem. Soc., 2011, 133, 7296–7299 CrossRef CAS PubMed.
- B. Mahler, V. Hoepfner, K. Liao and G. A. Ozin, J. Am. Chem. Soc., 2014, 136, 14121–14127 CrossRef CAS PubMed.
- M. A. Lukowski, A. S. Daniel, F. Meng, A. Forticaux, L. S. Li and S. Jin, J. Am. Chem. Soc., 2013, 135, 10274–10277 CrossRef CAS PubMed.
- Z. Hu, L. X. Wang, K. Zhang, J. B. Wang, F. Y. Cheng, Z. L. Tao and J. Chen, Angew. Chem., Int. Ed., 2014, 53, 12794–12798 CrossRef CAS PubMed.
- K. Chang and W. X. Chen, ACS Nano, 2011, 5, 4720–4728 CrossRef CAS PubMed.
- H. J. Tang, J. Y. Wang, H. J. Yin, H. J. Zhao, D. Wang and Z. Y. Tang, Adv. Mater., 2015, 27, 1117–1123 CrossRef CAS PubMed.
- L. Cai, J. F. He, Q. H. Liu, T. Yao, L. Chen, W. S. Yan, F. C. Hu, Y. Jiang, Y. D. Zhao, T. D. Hu, Z. H. Sun and S. Q. Wei, J. Am. Chem. Soc., 2015, 137, 2622–2627 CrossRef CAS PubMed.
- Y. W. Tan, P. Liu, L. Y. Chen, W. T. Cong, Y. Ito, J. H. Han, X. W. Guo, Z. Tang, T. Fujita, A. Hirata and M. W. Chen, Adv. Mater., 2014, 26, 8023–8028 CrossRef CAS PubMed.
- J. Z. Chen, X. J. Wu, L. S. Yin, B. Li, X. Hong, Z. X. Fan, B. Chen, C. Xue and H. Zhang, Angew. Chem., Int. Ed., 2015, 54, 1210–1214 CrossRef CAS PubMed.
- K. Chang, D. S. Geng, X. F. Li, J. L. Yang, Y. J. Tang, M. Cai, R. Y. Li and X. L. Sun, Adv. Energy Mater., 2013, 3, 839–844 CrossRef CAS.
- Z. Y. Lu, W. Zhu, X. Y. Yu, H. C. Zhang, Y. J. Li, X. M. Sun, X. W. Wang, H. Wang, J. M. Wang, J. Luo, X. D. Lei and L. Jiang, Adv. Mater., 2014, 26, 2683–2687 CrossRef CAS PubMed.
- H. W. Kroto, J. R. Heath, S. C. Obrien, R. F. Curl and R. E. Smalley, Nature, 1985, 318, 162–163 CrossRef CAS.
- R. Tenne, L. Margulis, M. Genut and G. Hodes, Nature, 1992, 360, 444–446 CrossRef CAS.
- L. Margulis, G. Salitra, R. Tenne and M. Talianker, Nature, 1993, 365, 113–114 CrossRef CAS.
- R. Rosentsveig, A. Margolin, A. Gorodnev, R. Popovitz-Biro, Y. Feldman, L. Rapoport, Y. Novema, G. Naveh and R. Tenne, J. Mater. Chem., 2009, 19, 4368–4374 RSC.
- R. Tenne, Nat. Nanotechnol., 2006, 1, 103–111 CrossRef CAS PubMed.
- R. Tenne and C. N. R. Rao, Philos. Trans. R. Soc., A, 2004, 362, 2099–2125 CrossRef CAS PubMed.
- J. Etzkorn, H. A. Therese, F. Rocker, N. Zink, U. Kolb and W. Tremel, Adv. Mater., 2005, 17, 2372–2375 CrossRef CAS.
- X. L. Li and Y. D. Li, J. Phys. Chem. B, 2004, 108, 13893–13900 CrossRef CAS.
- J. Chen and F. Wu, Appl. Phys. A: Mater. Sci. Process., 2004, 78, 989–994 CrossRef CAS.
- A. Margolin, F. L. Deepak, R. Popovitz-Biro, M. Bar-Sadan, Y. Feldman and R. Tenne, Nanotechnology, 2008, 19, 9 CrossRef PubMed.
- X. L. Li, J. P. Ge and Y. D. Li, Chem.–Eur. J., 2004, 10, 6163–6171 CrossRef CAS PubMed.
- E. Blanco, D. Uzio, G. Berhault and P. Afanasiev, J. Mater. Chem. A, 2014, 2, 3325–3331 CAS.
- G. Alonso, M. Del Valle, J. Cruz, A. Licea-Claverie, V. Petranovskii and S. Fuentes, Catal. Lett., 1998, 52, 55–61 CrossRef CAS.
- L. Zhang and X. W. Lou, Chem.–Eur. J., 2014, 20, 5219–5223 CrossRef CAS PubMed.
- L. C. Yang, S. N. Wang, J. J. Mao, J. W. Deng, Q. S. Gao, Y. Tang and O. G. Schmidt, Adv. Mater., 2013, 25, 1180–1184 CrossRef CAS PubMed.
- H. Liu, D. W. Su, R. F. Zhou, B. Sun, G. X. Wang and S. Z. Qiao, Adv. Energy Mater., 2012, 2, 970–975 CrossRef CAS.
- K. Chang and W. X. Chen, Chem. Commun., 2011, 47, 4252–4254 RSC.
- C. F. Zhang, Z. Y. Wang, Z. P. Guo and X. W. Lou, ACS Appl. Mater. Interfaces, 2012, 4, 3765–3768 CAS.
- F. Zhou, S. Xin, H. W. Liang, L. T. Song and S. H. Yu, Angew. Chem., Int. Ed., 2014, 53, 11552–11556 CrossRef CAS PubMed.
- X. P. Fang, C. X. Hua, X. W. Guo, Y. S. Hu, Z. X. Wang, X. P. Gao, F. Wu, J. Z. Wang and L. Q. Chen, Electrochim. Acta, 2012, 81, 155–160 CrossRef CAS.
- Y. L. Liang, H. D. Yoo, Y. F. Li, J. Shuai, H. A. Calderon, F. C. R. Hernandez, L. C. Grabow and Y. Yao, Nano Lett., 2015, 15, 2194–2202 CrossRef CAS PubMed.
- Y. X. Wang, K. H. Seng, S. L. Chou, J. Z. Wang, Z. P. Guo, D. Wexler, H. K. Liu and S. X. Dou, Chem. Commun., 2014, 50, 10730–10733 RSC.
- J. W. Zhou, J. Qin, X. Zhang, C. S. Shi, E. Z. Liu, J. J. Li, N. Q. Zhao and C. N. He, ACS Nano, 2015, 9, 3837–3848 CrossRef CAS PubMed.
- S. Hu, W. Chen, J. Zhou, F. Yin, E. Uchaker, Q. F. Zhang and G. Z. Cao, J. Mater. Chem. A, 2014, 2, 7862–7872 CAS.
- S. B. Yang, H. H. Song and X. H. Chen, Electrochem. Commun., 2006, 8, 137–142 CrossRef CAS.
Footnotes |
| † Electronic supplementary information (ESI) available: Supplementary figures including EDX mapping, XRD, and electrochemical performances of commercial MoS2. See DOI: 10.1039/c5ta06869j |
| ‡ These authors contributed equally. |
| This journal is © The Royal Society of Chemistry 2016 |

