Structure, viscoelasticity, and interfacial dynamics of a model polymeric bicontinuous microemulsion†
Robert J.
Hickey‡
a,
Timothy M.
Gillard‡
b,
Matthew T.
Irwin
b,
Timothy P.
Lodge
*ab and
Frank S.
Bates
*b
aDepartment of Chemistry, University of Minnesota, Minneapolis, MN 55455, USA
bDepartment of Chemical Engineering and Materials Science, University of Minnesota, Minneapolis, MN 55455, USA. E-mail: lodge@umn.edu; bates001@umn.edu
First published on 28th September 2015
Abstract
We have systematically studied the equilibrium structure and dynamics of a polymeric bicontinuous microemulsion (BμE) composed of poly(cyclohexylethylene) (PCHE), poly(ethylene) (PE), and a volumetrically symmetric PCHE–PE diblock copolymer, using dynamic mechanical spectroscopy, small angle X-ray and neutron scattering, and transmission electron microscopy. The BμE was investigated over an 80 °C temperature range, revealing a structural evolution and a rheological response not previously recognized in such systems. As the temperature is reduced below the point associated with the lamellar-disorder transition at compositions adjacent to the microemulsion channel, the interfacial area per chain of the BμE approaches that of the neat (undiluted) lamellar diblock copolymer. With increasing temperature, the diblock-rich interface swells through homopolymer infiltration. Time–temperature-superposed linear dynamic data obtained as a function of frequency show that the viscoelastic response of the BμE is strikingly similar to that of the fluctuating pure diblock copolymer in the disordered state, which we associate with membrane undulations and the breaking and reforming of interfaces. This work provides new insights into the structure and dynamics that characterize thermodynamically stable BμEs in the limits of relatively weak and strong segregation.
Introduction
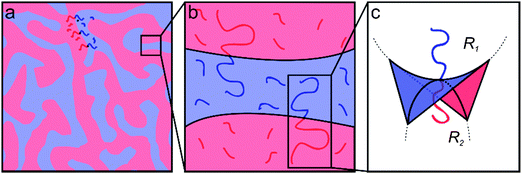
Materials containing bicontinuous morphologies, characterized by discrete phases that percolate in three dimensions forming interpenetrating networks with a large surface area to volume ratio, are desirable for many applications including catalysis, filtration, and energy technologies.1–7 To date, a host of ingredients (metals,8 oxides,9,10 surfactants,6 and polymers3) and processing strategies (both kinetic11,12 and thermodynamic3,6) have been exploited to control the characteristic length scale and physical properties of such co-continuous structures. Polymers are particularly attractive for this purpose.13,14 A variety of approaches afford access to characteristic length scales in co-continuous polymeric systems that range from nanometers to millimeters.3,4,12,15–21 For example, recent work has shown that a kinetically controlled co-continuous structure with nanometer scale features can be trapped by in situ cross-linking through a process called polymerization-induced microphase separation.12,20,22 In contrast, coarsening of a two-phase morphology generated by spinodal decomposition of polymer/solvent blends can lead to bicontinuous structures with micrometer, and even millimeter size domains.4,18,21,23,24 Immiscible liquid blends stabilized with surfactants or block polymers enable the formation of thermodynamically stable bicontinuous phases with feature sizes intermediate to these two length scales.3,25Ternary systems composed of two immiscible liquids and a corresponding amphiphile (e.g., blends of either oil/water/surfactant or A- and B-type homopolymers stabilized with the corresponding AB diblock copolymer) are characterized by rich phase diagrams containing numerous morphologies and exhibiting an extraordinary range of structural dynamics.25–33 Under appropriate conditions such three-component mixtures will self-assemble into a thermodynamically stable bicontinuous microemulsion (BμE) with structural dimensions ranging from 10 to 500 nm.3,25,27 The BμE is globally isotropic, but contains locally correlated domains of either oil/water or A/B homopolymers mediated respectively by surfactants or AB diblock copolymers at the interface (Fig. 1).25,27 The interfacial curvature in a perfectly balanced mixture is characterized by zero mean curvature, H = [R1 + R2]/2 = 0, and negative Gaussian curvature, K = R1R2 < 0, where R1 and R2 are the principal curvatures of the interface (see Fig. 1).27 The detailed structure of a BμE can be quantitatively characterized using either small-angle neutron or small-angle X-ray scattering (SANS or SAXS) aided by the Teubner–Strey (T–S) model, derived from an order parameter expansion of the free energy density.34 The domain spacing (d), correlation length (ξ), and amphiphilicity factor (fa) of the BμE can be extracted by fitting the T–S model to experimental scattering data.34,35 This fascinating state of molecular organization forms through a combination of complex interactions involving interfacial dynamics, bending modulus, preferred curvature, and surface tension. Although a variety of theoretical descriptions have been advanced, a complete theory that fully captures the thermodynamic and dynamic features of the BμE remains elusive.36–42
Polymeric systems are very well suited for studying the fundamental nature of the BμE state. An especially enabling and simplifying attribute is the identical chemistry associated with the A and B homopolymers and the individual blocks in an A–B diblock copolymer, which provides powerful flexibility in designing such mixtures with near perfect structural symmetry. By controlling the composition and molecular weight of the diblock, and molecular weight of the individual homopolymers, the location of the BμE in the three-dimensional phase space (volume fraction of each component and temperature at constant pressure) can be precisely specified. Moreover, the dynamics of a BμE are intimately connected to the viscoelastic properties of the ingredients, which also can be tuned by regulating the molecular weight and glass transition temperature of each component. Judicious choice of the A and B polymers provides additional advantages, including access to isotopic labeling (essential for SANS) and the ability to fix the morphology for investigation by transmission electron microscopy (TEM) through rapid quenching below the glass transition (or melting) temperature. We developed the saturated hydrocarbon system comprised of poly(cyclohexylethylene) (PCHE) and poly(ethylene) (PE) homopolymers, and the corresponding PCHE–PE diblock copolymer, in order to capitalize on these advantages.32 This report describes an in-depth investigation of the structure and dynamics of the BμE created by mixing these three materials.
Equilibrium and non-equilibrium structure and dynamics of the polymeric BμE morphology have been studied using a variety of techniques, with a majority of the experimental work involving rheological, scattering, and real-space imaging methods.43–51 Linear viscoelastic studies have shown that the BμE morphology has “excess” viscosity and elasticity arising from the structured nature of the fluid, similar to the behavior of sponge phases,52,53 liquid crystal based blue phases,54,55 and worm-like micelles.56–59 The “excess” linear viscoelasticity has been well described by the Pätzold–Dawson model, which anticipates certain general features of polymeric BμEs, but there are discrepancies in the viscosity and the relaxation times.43,44,60 Specifically, the Pätzold–Dawson model contains a single relaxation time, but dynamic light scattering (DLS) and X-ray photon correlation spectroscopy (XPCS) studies of polymeric BμEs have revealed multiple relaxation mechanisms that are hypothesized to arise from domain diffusion, copolymer dynamics, and undulating interfaces.43,46,47 Interestingly, bicontinuous morphologies and membrane structures derived from surfactants also exhibit multiple relaxation times, similar to polymeric systems.61–64
Here, we report an extensive experimental study of a PCHE–PE/PCHE/PE BμE across a broad range of the structural parameters (including d, ξ, and particularly fa) by investigating this system over a large (80 °C) temperature interval. This work builds upon previous reports related to other BμE systems.43–48 The structural and dynamical features of the BμE were probed using SANS, SAXS, dynamic mechanical spectroscopy (DMS), and transmission electron microscopy (TEM). We have discovered that at low temperatures, the diblock copolymer located at the interface in the BμE experiences a molecular environment (interfacial packing) similar to that encountered in the undiluted, neat diblock in the lamellar (LAM) morphology at equivalent temperatures. With increasing temperatures, the homopolymers intermix with the diblock copolymers and swell the BμE interface, leading to a reduction in domain spacing and increase in the interfacial area per diblock chain. We associate the terminal relaxation response with membrane undulations and the breaking and reforming of interfaces, and draw analogies to the rheological response of worm-like micelles and sponge phases.65–69 Previous reports have involved more limited temperature windows that did not capture in a single sample the full progression of structures reported here. This work highlights the intricate interplay between structure and dynamics in BμE systems, and provides a better understanding of the underlying mechanisms that drive the fascinating behavior of thermodynamically stable co-continuous morphologies in which the interface controls the properties.
Experimental
Materials and molecular characterization
Detailed synthetic procedures and molecular characterization methods employed in this work are described elsewhere.32 Briefly, polyethylene (PE, Mn = 2.1 kg mol−1) and polycylohexylethylene (PCHE, Mn = 2.6 kg mol−1) homopolymers and a symmetric poly(cylohexylethylene-b-ethylene) (PCHE–PE-14, Mn = 13.6 kg mol−1, volume fraction of the PCHE block fPCHE = 0.52 ± 0.01) diblock copolymer were prepared by catalytic hydrogenation of the corresponding unsaturated precursors (poly(1,4-butadiene), poly(styrene), and poly(styrene-b-1,4-butadiene), respectively) synthesized by anionic polymerization. See Table 1 for additional molecular details. For neutron scattering experiments, the poly(styrene) precursor was saturated using deuterium gas, resulting on average in 4.5 deuterium atoms per repeat unit of the d-PCHE homopolymer, determined gravimetrically; full deuteration (i.e., 6 deuterons per repeat unit) was not obtained due to hydrogen–deuterium solvent–polymer exchange.70| Polymer | M n (kg mol−1) | N | Đ = Mw/Mnc | f PCHE | T ODT (°C) |
|---|---|---|---|---|---|
| a Number average molecular weight, determined from SEC performed on unsaturated precursors. b Volumetric degree of polymerization, based on 118 Å3 reference volume and published densities at 140 °C.72 c Molecular weight dispersity measured for unsaturated precursors by size exclusion chromatography (SEC) in tetrahydrofuran at 25 °C (No evidence of broadening was evident in SEC of the fully saturated polymers. However, SEC of polyethylene containing polymers was done at elevated temperatures in a separate instrument with significant instrument smearing. Therefore, we believe the dispersities measured for the unsaturated precursors more accurately reflect the true dispersity.). d Volume fraction PCHE calculated from 1H-NMR spectroscopy on the unsaturated precursors and based on melt densities at 140 °C. e Order–disorder transition temperatures, measured by DMS. f PCHE–PE-14 contained a small amount (≤3 vol%) of residual PCHE homopolymer. | |||||
| PCHE | 2.6 | 39 | 1.06 | — | — |
| PE | 2.1 | 38 | 1.05 | — | — |
| PCHE–PE-14f | 13.6 | 230 | 1.08 | 0.52 | 18971 |
Blend preparation
The BμE-forming blend was prepared by co-dissolving the appropriate quantity of each polymer in hot benzene (just below the boiling temperature ∼80 °C), followed by quenching the solution in liquid nitrogen and freeze-drying under dynamic vacuum for 24 h to remove the solvent. The total homopolymer volume fraction (ϕH) for the ternary blend studied was ϕH = 0.86, with the volume ratio between the PCHE and PE homopolymers ϕPCHE/ϕPE = 1.Dynamic mechanical spectroscopy (DMS)
Most DMS measurements were conducted using the 25 mm diameter, stainless steel, parallel plate geometry on a Rheometrics Scientific ARES strain-controlled rheometer equipped with a forced convection oven (inert nitrogen atmosphere). For increased torque on selected samples, we employed 40 mm diameter plates on a TA Instruments Discovery Hybrid Rheometer with a forced convection oven (inert nitrogen atmosphere). All polymer samples were loaded to give a gap of approximately 1 mm, heated above any thermal transitions (e.g., glass, melting, or order–disorder transitions), cooled at 1 °C min−1 to specific temperatures and held for 1 h before collecting data as a function of frequency over the range 0.01 ≤ ω ≤ 100 rad s−1. Thermal expansion of the plates was accounted for to ensure that the gap dimension remained constant throughout all DMS measurements. Strains were chosen to maximize torque while remaining in the linear viscoelastic regime (see ESI†). Steady shear experiments were conducted between 0.001 and 100 s−1 in the temperature range 120–220 °C (see ESI†). Zero-shear viscosity was determined in the limit of low shear rate.Small angle X-ray scattering (SAXS)
Synchrotron SAXS experiments were conducted at the DND-CAT 5-ID-D beamline at the Advanced Photon Source (Argonne National Laboratory, Argonne, IL USA) using the triple-detector system, which simultaneously records small-, middle-, and wide-angle X-ray scattering (SAXS/MAXS/WAXS).73 An X-ray wavelength of 1.24 Å was used with SAXS, MAXS, and WAXS sample-to-detector distances of approximately 8.5, 1 and 0.2 m, respectively. 2D data were collected with Rayonix area CCD detectors; for brevity we will refer to all such experiments simply as SAXS. All scattering patterns were nearly azimuthally isotropic and were azimuthally integrated to obtain 1D plots of scattered intensity (in arbitrary units) versus scattering wave vector q = 4πλ−1![[thin space (1/6-em)]](https://www.rsc.org/images/entities/char_2009.gif) sin(θ/2). The BμE (ϕH = 0.86) sample was contained in a 1.5 mm nominal diameter quartz capillary (Charles Supper Company) and the temperature was controlled during scattering experiments with a modified Linkam HFS91 heating stage. Prior to the SAXS experiments, the sample was heated to 200 °C to facilitate equilibration and to remove any processing history, slowly cooled (ca. 1 °C min−1) to 120 °C, annealed at 120 °C under vacuum for 15 h, and then rapidly quenched to room temperature by immersion in a water bath to kinetically trap the equilibrium structure. At the beamline, the sample was quickly (ca. ∼10 seconds) reheated to 120 °C to record the structure at this temperature. The sample was then heated to 200 °C and cooled back to 120 °C, pausing at several temperatures to collect scattering patterns. The sample was equilibrated at each temperature for approximately 2 min prior to data collection while changes in temperature between measurements were rapid (>20 °C min−1).
sin(θ/2). The BμE (ϕH = 0.86) sample was contained in a 1.5 mm nominal diameter quartz capillary (Charles Supper Company) and the temperature was controlled during scattering experiments with a modified Linkam HFS91 heating stage. Prior to the SAXS experiments, the sample was heated to 200 °C to facilitate equilibration and to remove any processing history, slowly cooled (ca. 1 °C min−1) to 120 °C, annealed at 120 °C under vacuum for 15 h, and then rapidly quenched to room temperature by immersion in a water bath to kinetically trap the equilibrium structure. At the beamline, the sample was quickly (ca. ∼10 seconds) reheated to 120 °C to record the structure at this temperature. The sample was then heated to 200 °C and cooled back to 120 °C, pausing at several temperatures to collect scattering patterns. The sample was equilibrated at each temperature for approximately 2 min prior to data collection while changes in temperature between measurements were rapid (>20 °C min−1).
Small angle neutron scattering (SANS)
SANS experiments were performed at the National Institute of Standards and Technology (NIST), Gaithersburg, Maryland, on the 30 m NG-7 (University of Minnesota/ExxonMobil/NIST) beamline using a neutron wavelength of λ = 8.09 nm and Δλ/λ = 0.115. Three different configurations were used with sample-to-detector distances of 15.3 m (lenses inserted), 4 m, and 1 m. PE, deuterated PCHE, and BμE samples were loaded into custom quartz banjo cells with 1.0 mm nominal path length (precise path length was determined by subtracting the known quartz window thickness from the measured total cell thickness). The 2D scattering data were corrected for background and empty cell scattering, sample transmission, sample thickness, and detector sensitivity and converted to an absolute intensity scale using measurements of the direct beam flux. All measured scattering patterns were essentially azimuthally isotropic and were averaged to produce 1D plots of scattered intensity vs. q. Incoherent scattering, estimated based on the volume fraction weighted average scattering intensity at high-q from pure homopolymer samples (PE and d-PCHE), was subtracted from the BμE scattering data. Data reduction was performed using the NCNR software package for Igor Pro provided by NIST.74 Isotope effects are ignored in this study, as these are insignificant at the molecular weights employed.75,76Transmission electron microscopy (TEM)
TEM specimens were prepared by heating the sample to 200 °C for 30 min, then cooling to the temperature of interest (120 °C, 150 °C, and 180 °C) at 1 °C min−1 and annealing for a minimum of 16 h. Samples were then plunged into a mixture of dry ice and 2-propanol to rapidly cool and solidify the material (Tg,PCHE ≅ Tm,PE ≅ 100 °C), fixing the blend morphology present at the annealing temperature. We estimate that the specimens are cooled below the solidification temperature in roughly 5 s.32 All samples were stained with ruthenium tetroxide vapor for 4 h to enhance contrast between microphases. Microtoming was performed at room temperature using a Leica EM UC6 ultramicrotome and a MicroStar diamond knife. BμE sample sections were microtomed to a thickness of approximately 70 nm, and collected on a tabbed copper grid (PELCO, 300 mesh) and imaged using a FEI Tecnai G2 Spirit BioTWIN transmission electron microscope operating at a 120 kV accelerating voltage.Results
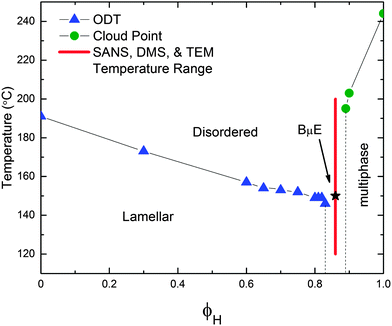
This ternary polyolefin blend contains a mixture of PCHE and PE homopolymers with nearly equal molecular volumes (NPCHE = 39 and NPE = 38 are the number average degrees of polymerization based on a 118 Å3 reference volume and published densities) and a volumetrically symmetric PCHE–PE-14 diblock copolymer (fPCHE = 0.52 ± 0.01, NPCHE–PE = 230).32Fig. 2 summarizes the PCHE–PE/PCHE/PE phase diagram for the volumetrically symmetric isopleth (ϕH = ϕPCHE + ϕPEversus T, where ϕPCHE/ϕPE = 1) for this system. A BμE channel splits the isopleth into two distinctly different regions: (1) a diblock-rich portion of the phase diagram characterized by microphase separation into ordered lamellae (LAM) at low temperature, and (2) a homopolymer-rich region of the phase diagram characterized by macrophase separation at temperatures below a line of second-order phase transitions (Fig. 2).32In the LAM region of phase space, DMS and SAXS were used to determine the line of order–disorder transition temperatures (TODT) and to assign the morphology, respectively.32 As previously reported, addition of PCHE and PE homopolymers to PCHE–PE-14 swells the LAM domains and results in a small concomitant decrease in TODT.32 The line of order–disorder transitions (ODT) terminates at the BμE channel. (The character of the line of ODTs associated with the LAM-disorder transition will be the subject of a future report). In this system, the BμE channel occurs in the homopolymer range 0.85 ≤ ϕH ≤ 0.88, somewhat below the theoretical Lifshitz composition (ϕH,L = 0.95) and the associated line of unbinding transitions predicted by mean-field theory.32 Macroscopic phase separation occurs at temperatures below the envelope of upper critical solution temperatures (UCSTs) located at homopolymer contents greater than those for the BμE channel (ϕH ≥ 0.89), as confirmed by cloud point measurements.32 The experiments were conducted on a ternary mixture with ϕH = 0.86 (and ϕPCHE/ϕPE = 1) as identified by the red vertical line in Fig. 2. This places the material within (or above) the BμE channel at all measurement temperatures.
Structure
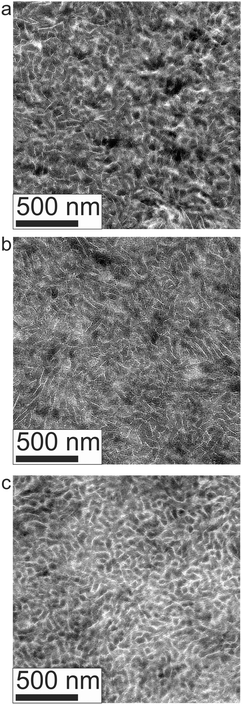
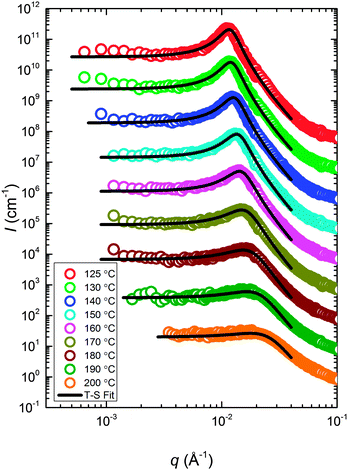
Real space TEM imaging was performed at room temperature on specimens quenched after annealing at various temperatures between 120 and 180 °C, as shown in Fig. 3. The combined effects of PCHE vitrification and PE crystallization fixes the morphology present in the melt state and renders a material suitable for microtoming into thin (ca. 70 nm thick) sections. The PE domains in the images shown in Fig. 3 appear lighter since semicrystalline polymers such as PE do not stain as heavily as amorphous polymers like PCHE.77 These micrographs show no evidence of LAM and BμE coexistence; the BμE morphology is disordered and globally isotropic, with well-defined domains and a local periodicity of about 30 to 60 nm.The static structure of the BμE was evaluated over the temperature range 125–200 °C using SANS (and SAXS, see ESI†). As seen in Fig. 4, the mixture produces a single prominent peak at all temperatures, which changes in intensity by two orders of magnitude and broadens between the highest and lowest temperatures. A nearly flat incoherent background intensity, estimated based on the weighted average of the scattering obtained from the pure homopolymers (see Fig. 4), was subtracted from these data, which are re-plotted in Fig. 5. The background corrected scattering patterns were fit with the Teubner–Strey (T–S) model,
 | (1) |
![[thin space (1/6-em)]](https://www.rsc.org/images/entities/char_2009.gif) sin(θ/2) (λ is the wavelength, and θ is the scattering angle), and a2, c1, and c2 are fitting coefficients.34 We obtained good agreement between the SANS results and the T–S model over a large q-range, as seen in Fig. 5. The model fails to quantitatively reproduce the coherent scattering intensity for q > 0.04 Å−1, which is attributed to Gaussian coil scattering (I(q) ∼ q−2) from the h-PCHE blocks of PCHE–PE-14, a consequence of the lack of contrast matching with the d-PCHE homopolymer.43,47
sin(θ/2) (λ is the wavelength, and θ is the scattering angle), and a2, c1, and c2 are fitting coefficients.34 We obtained good agreement between the SANS results and the T–S model over a large q-range, as seen in Fig. 5. The model fails to quantitatively reproduce the coherent scattering intensity for q > 0.04 Å−1, which is attributed to Gaussian coil scattering (I(q) ∼ q−2) from the h-PCHE blocks of PCHE–PE-14, a consequence of the lack of contrast matching with the d-PCHE homopolymer.43,47
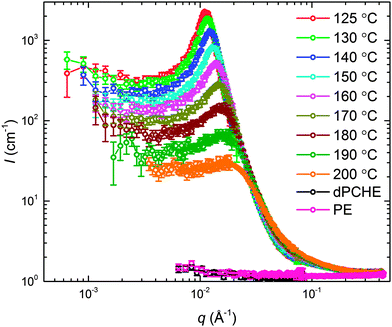 | ||
| Fig. 4 SANS data in units of absolute intensity acquired as a function of temperature for the BμE; d-PCHE (black) and PE (pink) homopolymer data were obtained at 140 °C. | ||
Two structural length scales are associated with the fitting coefficients of the T–S model, the domain spacing (d) and the correlation length (ξ),
 | (2) |
 | (3) |
 | (4) |
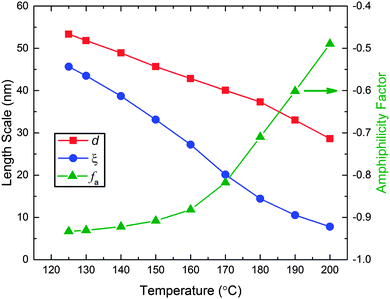 | ||
| Fig. 6 Domain spacing (d), correlation length (ξ), and amphiphilicity factor (fa) as a function of temperature associated with the best fits of the Teubner–Strey model (eqn (1)) to the SANS data shown in Fig. 5. | ||
Dynamics
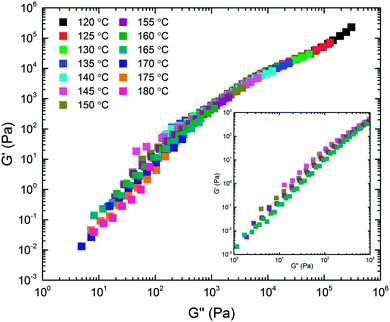
The viscoelastic properties associated with the structural features documented above were studied using DMS. Dynamic frequency sweeps (0.01 ≤ ω ≤ 100 rad s−1) were acquired over the temperature range 120 ≤ T ≤ 180 °C in the linear viscoelastic regime (see ESI† for dynamic strain sweeps used to determine the linear regime). Recognizing the likelihood of thermorheological complexity (three different polymer components and a complex temperature dependent mesostructure), we first plotted the temperature dependent frequency data in a modified Cole–Cole format (Fig. 7). This treatment of the data, which involves no arbitrary shifting factors, results in a surprisingly effective collapse of the rheological data onto a mostly temperature independent master curve, particularly at high modulus (i.e., low temperature or high frequency). This motivated us to apply the time–temperature superposition (tTS) principle in order to extract additional insight into the underlying dynamical processes through comparison of the responses of the BμE and the individual components on a common basis (i.e., a single master plot). Fig. 8 shows a tTS master plot for the BμE constructed by placing an emphasis on the high modulus (i.e., high frequency) data using a reference temperature of Tref = 140 °C. The corresponding shift factors (aT) were fit to the Williams–Landel–Ferry (WLF) equation, log(aT) = −C1(T − Tref)/(C2 + T − Tref), where C1 = 16.09, and C2 = 164.13 °C, based on Tref = 140 °C (Table 2, and ESI†). As seen in Fig. 8, there is good superposition of the data for the BμE over a majority of the frequency and temperature ranges. Non-terminal behavior for the storage (G′) and loss (G′′) moduli (G′ ∼ G′′ ∼ ω1/2) is apparent at high frequencies (aTω > 1 rad s−1), while for aTω < 0.1 rad s−1 a terminal response is evident (G′ ∼ ω2 and G′′ ∼ ω1). Below about 160 °C there is a subtle but systematic failure of superposability in G′ with decreasing temperature (inset of Fig. 8), similar to what has been reported in dynamically symmetric disordered diblock copolymer melts and attributed to composition fluctuations.71,78 Unfortunately, we could not fully establish this trend due to an inability to access the terminal regime below 145 °C at manageable frequencies (ω ≥ 0.01 rad s−1).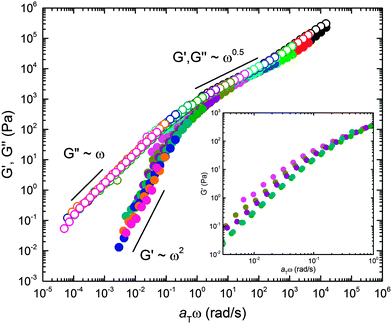 | ||
| Fig. 8 Master plot of the linear dynamic elastic (G′) and loss (G′′) moduli for the BμE. Time–temperature shift factors (aT) were obtained by shifting on G′′ with Tref = 140 °C giving WLF parameters of C1 = 16.09 and C2 = 164.13 °C. The inset reveals a failure to superpose G′ in the terminal regime. The inset data were obtained by extending the frequency region using a stress controlled TA Instruments Discovery Hybrid Rheometer. G′ and G′′ are indicated with closed and open symbols, respectively. Color of symbols represent temperatures indicated in Fig. 7. | ||
WLF parameters also were determined for pure PCHE–PE, and the PCHE and PE homopolymers, and these values are listed in Table 2 (see ESI† for the raw and shifted data). In order to avoid ambiguities associated with the ODT we have assigned the shift factors for PCHE–PE-14 diblock copolymer based on values obtained from another symmetric, ordered sample, PCHE–PE-18 (Mn = 18.9 kg mol−1, fPCHE = 0.51, and TODT = 317 °C);71 previous reports demonstrate the validity of this approach with symmetric diblock copolymers of similar molecular weight.78,79 Interestingly, the WLF parameters calculated for the BμE differ significantly from both the PCHE and PE homopolymers and the diblock copolymer (Table 2). Naively, one might expect the WLF parameters for the BμE to be close to those for the diblock and the PCHE homopolymer, since Tg,PCHE ≫ Tg,PE, i.e. PCHE should dominate the temperature dependence of all three systems. However, neither set of C1 and C2 parameters adequately superposes the BμE DMS data (see ESI†). We return to this point in the Discussion section.
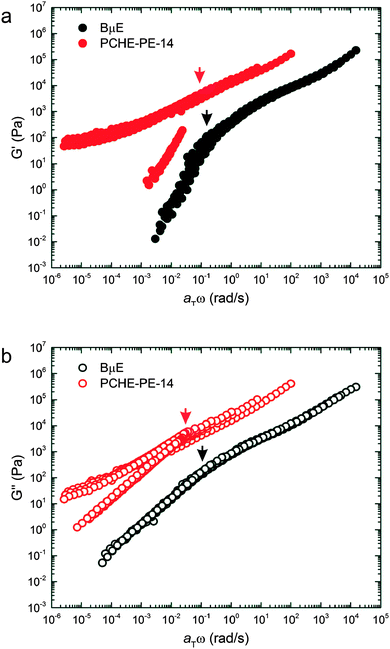
Temperature-independent master plots of G′ and G′′ for the BμE and PCHE–PE-14 based on Tref = 140 °C and the shift factors listed in Table 2 are presented in Fig. 9. There is remarkable similarity between the reduced viscoelastic properties of the BμE and disordered PCHE–PE-14 exposed by this master plot. (The low frequency response of the ordered branch of the PCHE–PE-14 data reflects a solid-like response due to the polycrystalline long-range ordered LAM morphology).80 To a close approximation, both sets of G′ and G′′ data can be superimposed by vertically shifting the BμE results upward by about two orders of magnitude. Most strikingly, the reduced relaxation time τc = (aTω)c−1 of the pure PCHE–PE-14 is essentially identical to that of the BμE, which contains 86% by volume homopolymer, where (aTω)c represents the reduced frequency associated with the transition to terminal behavior. The molecular relaxation time constants for the homopolymers are smaller by three or more orders of magnitude than τc for the diblock copolymer and microemulsion (see ESI†). These results unambiguously demonstrate that the dynamical behavior of the disordered state is controlled by sheets of diblock copolymers that constitute the interfaces separating PE and PCHE in both the fluctuating pure diblock and bicontinuous microemulsion. We expand on this finding in the following section.
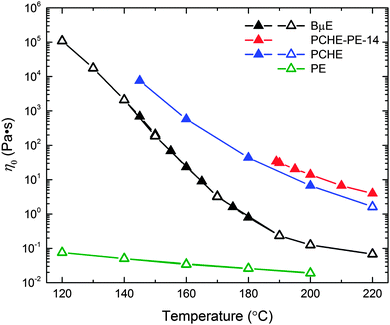
The temperature dependence of the zero shear viscosity (η0) for the BμE, PCHE–PE-14, and the PCHE and PE homopolymers, are presented in Fig. 10. This property was determined using two procedures: linear oscillatory shear (η0 = η′(ω → 0) = G′′/ω filled symbols) and steady shear (open symbols) experiments. Within experimental uncertainty, both methods yield identical results (also see ESI†). The temperature dependence of the viscosity of the BμE is clearly different from those of both the diblock and the homopolymers, consistent with the results listed in Table 2.
Discussion
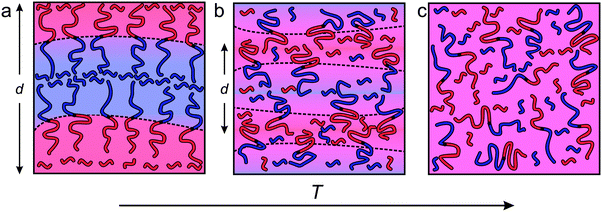
The experimental results presented in the previous section reveal the structural and dynamical features that govern this fascinating state of condensed matter. Fig. 11 summarizes schematically what we have deduced regarding the equilibrium structure that emerges as the ternary mixture is cooled from a mean-field homogeneous state at high temperatures, to a fluctuating, highly structured, bicontinuous morphology at temperatures below approximately 150 °C. The transition temperature, Tx = 150 °C, identified by a black star in Fig. 2, coincides with two seemingly independent features: (1) the temperature within the BμE channel extrapolated from the line of LAM-disorder transitions at lower homopolymer concentrations, and (2) the point that defines the low temperature behavior of fa (Fig. 6). This section describes the rationale behind the illustrations in Fig. 11 and the associated dynamic consequences.Structure
We first estimate the interfacial area per diblock copolymer chain (Ac) from estimates of the interfacial area per unit volume (S) of the BμE. Ac is related to S for the BμE (and the LAM and DIS states in PCHE–PE-14) by | (5) |
| S = q4I(q → ∞)/2π(Δρ)2 | (6) |
 | (7) |
| S = q4I(q)πϕPCHE(1 − ϕPCHE)/QI. | (8) |
The experimental SANS data at high q (Fig. 5) are dominated by contributions from the incoherent background and scattering arising from the h-PCHE blocks within the d-PCHE homopolymer domains. This precludes reliable extraction of S using a direct application of Porod's law. Therefore, we have taken advantage of the excellent quality of the T–S fits to the SANS data and used these fitted functions to estimate QI and calculate S and Ac, assuming these functions apply over all values of q. As seen in Fig. 12, Ac thus calculated increases from 4.1 nm2 at 125 °C to 24.7 nm2 at 200 °C. A similar trend was reported previously for another polymeric BμE.47
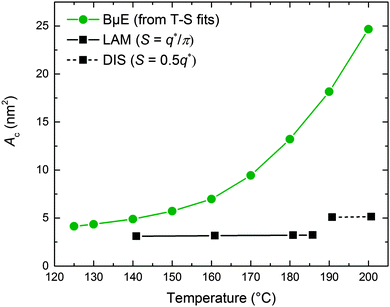 | ||
| Fig. 12 Temperature dependence of the interfacial area per PCHE–PE-14 chain (Ac) for the BμE and neat PCHE–PE-14 samples. Ac was calculated for the BμE sample from the Teubner–Strey functions shown in Fig. 5. Ac was calculated for the neat PCHE–PE-14 sample using the relationships SLAM = q*/π and SDIS = 0.5q* for the LAM and DIS states, respectively. S is the interfacial area per volume and q* was determined from previously reported SAXS data.32,71 | ||
We have estimated Ac for the neat PCHE–PE-14 diblock copolymer in the LAM and DIS states for comparison with the BμE, using SLAM = q*/π and SDIS = 0.5q*.82,83 The relationship SDIS = 0.5q* is an approximation drawn by analogy with the structure of the bicontinuous morphology that results from spinodal decomposition of a mixture of two immiscible liquids.82–84 Values of q* were determined from SAXS data obtained from previously reported work71 and the associated S values were converted to Ac using eqn (5) and are plotted in Fig. 12. (The jump in Ac with disordering, at virtually constant q*, reflects an increase in the interfacial area associated with the transition from lamellae to a fluctuating bicontinuous state, as discussed elsewhere.82) Remarkably, the area per block copolymer chain for the BμE asymptotically approaches that of the PCHE–PE-14 chains in the undiluted LAM morphology in the low temperature limit. Hence, we conclude that cooling the ternary mixture deep into the bicontinuous channel, T ≪ Tx, leads to the expulsion of homopolymer from the interfacial region as illustrated in Fig. 11a.
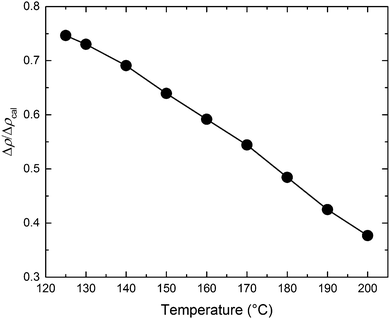
The T–S fits to the SANS data also allow an estimate of the extent of segregation between PCHE and PE (proportional to Δρ) as a function of temperature based on the invariant QI (eqn (7)). The relative amplitude of the composition profile can be expressed as,
 | (9) |
Notwithstanding the assumptions involved in generating Fig. 12 and 13, these results offer new insights regarding the local properties of the interface and the extent of polymer intermixing in the BμE, as summarized in Fig. 11. Although the BμE is globally disordered at all levels of segregation, the molecular environment of the interface resembles that of the neat PCHE–PE-14 in the LAM morphology at lower temperatures. As T is reduced below Tx, the interface becomes “saturated” (“crowded”) with block copolymer, largely excluding the PCHE and PE homopolymers from the interfacial region, creating a situation analogous to the “dry-brush” regime encountered when a dense array of polymer chains are anchored to a surface in contact with an athermal melt of polymers. This exclusion of homopolymer leads to stiffening of the interface and an increase in the correlation length. Interestingly, as the BμE interface becomes saturated with diblock copolymer and Ac approaches that of neat PCHE–PE-14, the lamellar ordering anticipated by mean-field theory does not occur.85 Apparently, fluctuation effects, associated with a finite diblock copolymer molecular weight, overwhelm the tendency to order at reduced temperatures as opposing diblock copolymer rich interfaces become decoupled through the expulsion of homopolymer. Obviously, diblock decoupling cannot happen when ϕH → 0, nor at the lamellar unbinding transition in the mean-field limit (coincident with the Lifshitz composition)85 when NAB → ∞.
Dynamics
The temperature dependence of the zero shear viscosity of the BμE reinforces the structural interpretations discussed in the previous section. As is evident in Fig. 10, the temperature dependence of the viscosity of the BμE differs significantly from PCHE–PE-14 and the two homopolymers. At low temperatures, the behavior of the BμE approaches that of the diblock (and PCHE homopolymer), consistent with a morphology of two 3-dimensional interpenetrating networks of well-segregated domains enriched with each homopolymer (Fig. 11a). However, with increasing temperature the opposite trend is evident, where at the highest measurement temperatures the viscosity of the BμE more closely resembles that of the PE homopolymer. This behavior conforms to expectation for an increased state of mixing (Fig. 11c) where the flow behavior is most dominated by the low viscosity component. Between these two limits, the viscosity of the BμE is more strongly dependent on temperature than either homopolymer or the pure diblock (which is relatively strongly segregated over the entire temperature range), as reflected in the WLF parameters listed in Table 2. These dynamic phenomena are a direct consequence of the substantial differences in the viscoelastic behavior (also referred to as mechanical contrast) between PCHE and PE, due primarily to the large difference in Tg (ΔTg ≈ 260 °C). To the best of our knowledge this aspect of bicontinuous microemulsion dynamics has not been recognized in previous studies.43–45,48Similarities in the frequency dependence of the linear viscoelastic properties of the BμE and the pure disordered PCHE–PE-14 diblock, evident in the time–temperature superposed master plots (Fig. 9), also supports this interpretation. At low temperatures, the diblock copolymer molecules in the BμE morphology experience a local (crowded) environment similar to that encountered in the pure, fluctuating diblock copolymer melt above TODT. In both cases, we expect G′ and G′′ at reduced frequencies, aTω ≥ (aTω)c, to be dominated by interfacial dynamics, where τc−1 = (aTω)c defines the time constant associated with terminal behavior. Apparently, the presence of PCHE and PE homopolymer in the BμE serves only to dilute the amount of interface, which has the effect of reducing the absolute magnitude of the measured moduli, but without significantly influencing τc or the frequency dependence of G′ and G′′ for aTω ≥ τc−1. We have included the superposed dynamic moduli of the PCHE and PE homopolymers in the ESI† for comparison. (Note that G′ for PE was too low to be recorded by these measurements). Clearly, the 2-dimensional sheets of diblocks control the magnitude of G′ and G′′ in pure PCHE–PE-14 and the BμE; the terminal time constants for the homopolymers are orders of magnitude smaller than τc for the microstructured materials. However, more quantitative comparison of the homopolymer and diblock-based materials is not warranted since partial mixing of PE and PCHE greatly influences the quantitative values of the moduli in the structured materials.
Upon ordering, the low frequency (aTω < τc−1) behavior of PCHE–PE-14 changes dramatically, reflecting the correlated response of periodically stacked flat interfaces (G′ ∼ G′′ ∼ ω1/2) as described in numerous earlier studies.71,78 This mode of viscoelastic response is not accessed by the BμE, which remains disordered and liquid-like (G′ ∼ ω2 and G′′ ∼ ω1) at aTω < τc−1 and all measurement temperatures.
In the terminal regime of the master plot for the BμE (Fig. 8), the G′ data fail to superpose precisely, resembling previously reported work in which rheological evidence of composition fluctuations are evident in dynamically symmetric disordered diblock copolymer melts.71,78 Curiously, we did not find this behavior with pure PE–PCHE diblock copolymer in the vicinity of TODT, a result which was attributed to a large mechanical contrast.71 As rationalized in the previous paragraphs, we infer that the terminal regime of the BμE reflects purely interfacial dynamics. At low temperatures (T ≪ Tx), the system is relatively well-segregated, with saturated interfaces, and increased correlation lengths (i.e., the structure is stiffer). With increasing temperature, the homopolymers mix into and “soften” the interfaces, with a concomitant reduction in the correlation length. These changes in the interfacial properties with temperature are reflected in τc, which increases as the temperature is reduced, leading to a reduction in (aTω)c and the apparent failure of tTS. Because both homopolymers have terminal relaxation times that are orders of magnitude shorter than the bicontinuous blend, the system is essentially mechanically “contrast matched”, which explains the similarity with the behavior of dynamically symmetric diblocks71 such as PtBS-PMMA78 and PEP-PEE.86
General remarks
We have characterized the structural evolution of the BμE from the high temperature regime (T ≫ Tx), where the system approaches the homogeneously mixed mean-field state, to low temperatures (T ≪ Tx) where the components segregate into well-correlated domains enriched in PCHE and PE homopolymer, separated by an interface crowded with diblock copolymer. In this section we draw connections to related soft material systems, specifically, worm-like micelles and sponge phases.Previous investigations involving BμE systems have shown that there are multiple diffusion modes related to domain structure, amphiphile dynamics, and undulating interfaces.43,46,47 An X-ray photon correlation spectroscopy (XPCS) study on a polymeric BμE demonstrated that a stretched-exponential function was required to model autocorrelation functions, indicating that a single structural relaxation time is not adequate to describe the equilibrium dynamics.43 The stretched exponent values for the BμE were found to be similar to those predicted theoretically and determined experimentally for membrane systems such as sponge phases, lamellae, and vesicles.61–64,87 Similarly, worm-like micelles subjected to shear deformation exhibit stretched exponential relaxation behavior, where reptation is the major mode of stress relaxation.59,65,66,88 Additionally, worm-like micelles exhibit a relaxation spectrum that is dependent on the relative ratio between the reptation (τrep) and cylinder breaking and reforming (τbreak) time constants.65,66 In the τrep ≪ τbreak regime, an ‘entanglement plateau’ is present65,66 and relaxation occurs by diffusion of the micelles in the entanglement network accompanied by ‘Rouse modes’ that occur along the contour of the worm-like micelle.59,65,66,88 This behavior is similar to stress relaxation via reptation of linear entangled polymer melts as described by Doi and Edwards.89 Conversely, there is no entanglement plateau when τrep ≫ τbreak.65,66 In real systems, worm-like micelles display a combination of these two relaxation mechanisms.59,88,90
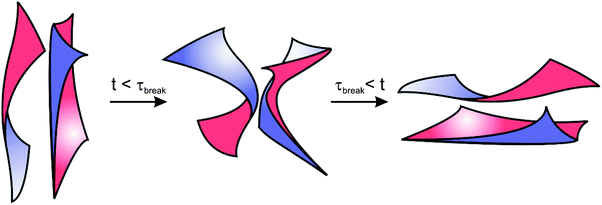
With lyotropic sponge phases, the topological relaxation time, or the time required for breaking and reforming of the bilayer structure, has been found experimentally to occur on fast time scales (∼0.01 s).68,69 For the BμE addressed in this study, we expect that breaking and reforming of the bicontinuous domains is thwarted at low temperatures as a result of increased segregation and rigid lamellar-like interfaces. Similar behavior is seen during the shear alignment of lamellar diblock copolymers: it is more difficult to align block copolymers well below the ODT because of slower chain relaxation dynamics and higher energy barriers.91–94 As homopolymers intermix with the diblock copolymer at higher temperatures, the BμE interface becomes more flexible, and the energetic barrier for breaking and reforming of interfaces should diminish. Therefore, we expect the BμE to have a strongly temperature dependent interfacial relaxation spectrum, as observed experimentally. The mode of stress relaxation at high frequencies in Fig. 8 appears to be Rouse-like with no ‘entanglement plateau’. Yet the BμE contains a sheet-like diblock copolymer rich interface that is folded into an interpenetrating manifold that spans the entire volume. It is hard to imagine a mechanism analogous to reptation with this topology. Breaking and reforming the bicontinuous morphology likely involves multiple processes, including membrane undulations95 and out-of-plane fluctuations that are common in fluid membranes formed by lipids and surfactants.67,96–99 For these reasons, we speculate that at time scales longer than the longest relaxation time, τc, the interfacial dynamics of the BμE reflect a competition between interfacial undulations and the breaking and reforming of the interfaces, as depicted schematically in Fig. 14. Further insight into this fascinating aspect of BμEs awaits additional theory and simulation.
This work helps to elucidate the fundamental thermodynamic driving forces for the formation of the BμE morphology. Adding homopolymer to diblock lamellae swells the domains non-linearly, as predicted by mean-field theory and established experimentally.25,85 Mean-field theory anticipates that the lamellar domain spacing diverges at an unbinding transition coincident with the Lifshitz composition (ϕH,L).85 This prediction is not realized experimentally because thermally driven composition fluctuations preempt the unbinding transition, giving rise to the BμE channel.25 The BμE displays structural relaxation mechanisms including interfacial undulations and the breaking and reforming of interfaces. The magnitude of membrane undulations, to a first approximation, is related to the interlayer spacing of the interfaces. If layers of membranes have a sufficiently small interlayer spacing, steric hindrance will drive the membranes to order into a lamellar morphology as a result of repulsive forces.67,96–99 As the interlayer spacing increases, and the interfaces decouple, the effects of steric hindrance will be reduced and permit the formation of a microemulsion phase, as predicted by de Gennes and Taupin.37 We hypothesize that adding homopolymer to the diblock copolymer, which increases the domain spacing, amplifies interfacial dynamics. Exactly how this stabilizes the BμE is an open question. We have shown in this study that interfacial dynamics are temperature dependent, and that the interface becomes stiffer at lower temperatures while simultaneously decoupling from neighboring sheets by expulsion of homopolymer. Application of simultaneous SANS and neutron spin echo scattering, as employed by Holderer et al.100,101 to characterize the bending rigidity of surfactant based BμEs, might provide additional insights into this aspect of the dynamics.
These considerations raise the question: will an ordered LAM structure form as T → 0? Fortunately, this pivotal question can be addressed using cleverly designed AB/A/B polymeric BμEs. This will require precisely tuning the ratio ϕA/ϕB, and perhaps fA, to account for the effects of conformational asymmetry, along with the establishment of efficient experimental methods to identify the exact composition that perfectly balances the mean (H) and Gauss (K) interfacial curvature. Perfect balance in real polymer systems will not occur in general at ϕA/ϕB = 1 and fA = 1/2, and significant deviation from ideal interfacial symmetry will likely lead to multiphase behavior as T → 0. These issues are currently under investigation.
Finally, we comment briefly on how this work relates to the large literature on surfactant/water/oil microemulsions. In the case of non-ionic surfactant systems, the BμE window is narrow in both composition and temperature, appearing at the tip of what is referred to as the ‘fish cut’ in the phase prism.27 Increasing or decreasing temperature by just a few degrees at the optimal composition leads to macroscopic phase separation. This complex phase behavior is intrinsically tied to the dual upper and lower critical solution temperature behaviors (UCST and LCST, respectively) of the hydrophobic and hydrophilic constituents of the amphiphile. Moreover, such systems are inherently structurally asymmetric due to the nature of the interactions of oil, and especially water, with the surfactant, making it difficult if not impossible to perfectly tune the overall bicontinuous morphology. These deficiencies are fully overcome with properly designed ternary AB/A/B polymeric systems as outlined in the previous paragraph.
Summary
We have presented the results and an analysis of a comprehensive study of a bicontinuous microemulsion (BμE) formed from equal volumes of poly(cyclohexylethylene) (PCHE), poly(ethylene) (PE) and 14% by volume of the corresponding PCHE–PE diblock copolymer. Small-angle neutron and X-ray scattering (SANS and SAXS) measurements, obtained over an 80 °C temperature range, were fit with the Teubner–Strey model. These experiments provide detailed information regarding the extent of segregation and the interfacial area per block copolymer molecule (Ac) well above and below the temperature extrapolated from the line of lamellar–disorder transition temperatures established at lower homopolymer concentrations denoted Tx. As the system is cooled deep into the BμE channel (T ≪ Tx), Ac decreases, asymptotically approaching the value that characterizes undiluted PCHE–PE in the lamellar state. This interfacial crowding of diblock copolymer and expulsion of homopolymer from the interfacial region results in a stronger state of segregation, accompanied by increases in the domain spacing and correlation length. Mechanical spectroscopy experiments reinforce this picture. Vastly different homopolymer relaxation times, attributable to disparate glass transition temperatures (ΔTg ≈ 260 °C), lead to zero-shear viscosities that reflect enhanced mixing at high temperatures and stronger segregation at low temperatures. Remarkably, the time constant associated with the transition to terminal (liquid-like) behavior in the BμE, determined by linear dynamic mechanical spectroscopy, coincides with the behavior of the pure disordered diblock copolymer at a common reduced temperature. These results indicate that the rheological properties of the BμE are controlled by the same interfacial dynamics that govern the behavior of undiluted fluctuating disordered diblock copolymer melts near the order–disorder transition. These findings offer fresh insights into the thermodynamic driving forces responsible for the formation of BμEs and the resulting properties, and highlight opportunities to better understand this fascinating state of self-assembly.Acknowledgements
This research was supported by the National Science Foundation under awards DMR-1104368 (FSB) and DMR-01206459 (TPL). We acknowledge the support of the National Institute of Standards and Technology, U.S. Department of Commerce, in providing the neutron research facilities used in this work and thank Paul Butler for help performing the SANS experiments. Portions of this work were performed at the DuPont-Northwestern-Dow Collaborative Access Team (DND-CAT) located at Sector 5 of the Advanced Photon Source (APS). DND-CAT is supported by E.I. DuPont de Nemours & Co., The Dow Chemical Company and Northwestern University. Use of the APS, an Office of Science User Facility operated for the U.S. Department of Energy (DOE) Office of Science by Argonne National Laboratory, was supported by the U.S. DOE under Contract No. DE-AC02-06CH11357. Experiments also were carried out in the Characterization Facility, University of Minnesota, which receives partial support from NSF through the MRSEC program.References
- H. Zhang and A. I. Cooper, Soft Matter, 2005, 1, 107–113 RSC.
- E. A. Jackson and M. A. Hillmyer, ACS Nano, 2010, 4, 3548–3553 CrossRef CAS PubMed.
- B. H. Jones and T. P. Lodge, Polym. J., 2012, 44, 131–146 CrossRef CAS.
- R. M. Dorin, H. Sai and U. Wiesner, Chem. Mater., 2014, 26, 339–347 CrossRef CAS.
- H. Pernot, M. Baumert, F. Court and L. Leibler, Nat. Mater., 2002, 1, 54–58 CrossRef CAS PubMed.
- M.-J. Schwuger, K. Stickdorn and R. Schomaecker, Chem. Rev., 1995, 95, 849–864 CrossRef CAS.
- D. Kipp, O. Wodo, B. Ganapathysubramanian and V. Ganesan, ACS Macro Lett., 2015, 4, 266–270 CrossRef CAS.
- J. Erlebacher, M. J. Aziz, A. Karma, N. Dimitrov and K. Sieradzki, Nature, 2001, 410, 450–453 CrossRef CAS PubMed.
- P. Levitz, G. Ehret, S. K. Sinha and J. M. Drake, J. Chem. Phys., 1991, 95, 6151–6161 CrossRef CAS.
- X. Lang, A. Hirata, T. Fujita and M. Chen, Nat. Nanotechnol., 2011, 6, 232–236 CrossRef CAS PubMed.
- L. Li, C. Miesch, P. K. Sudeep, A. C. Balazs, T. Emrick, T. P. Russell and R. C. Hayward, Nano Lett., 2011, 11, 1997–2003 CrossRef CAS PubMed.
- M. Seo and M. A. Hillmyer, Science, 2012, 336, 1422–1425 CrossRef CAS PubMed.
- C. J. Hawker and K. L. Wooley, Science, 2005, 309, 1200–1205 CrossRef CAS PubMed.
- F. S. Bates, M. A. Hillmyer, T. P. Lodge, C. M. Bates, K. T. Delaney and G. H. Fredrickson, Science, 2012, 336, 434–440 CrossRef CAS PubMed.
- M. Seo, S. Kim, J. Oh, S.-J. Kim and M. A. Hillmyer, J. Am. Chem. Soc., 2015, 137, 600–603 CrossRef CAS PubMed.
- M. Seo, C. J. Murphy and M. A. Hillmyer, ACS Macro Lett., 2013, 2, 617–620 CrossRef CAS.
- C. H. Chew, T. D. Li, L. H. Gan, C. H. Quek and L. M. Gan, Langmuir, 1998, 14, 6068–6076 CrossRef CAS.
- A.-L. Esquirol, P. Sarazin and N. Virgilio, Macromolecules, 2014, 47, 3068–3075 CrossRef CAS.
- W. Lu, D. Yuan, D. Zhao, C. I. Schilling, O. Plietzsch, T. Muller, S. Bräse, J. Guenther, J. Blümel, R. Krishna, Z. Li and H.-C. Zhou, Chem. Mater., 2010, 22, 5964–5972 CrossRef CAS.
- L. D. McIntosh, M. W. Schulze, M. T. Irwin, M. A. Hillmyer and T. P. Lodge, Macromolecules, 2015, 48, 1418–1428 CrossRef CAS.
- H. Sai, K. W. Tan, K. Hur, E. Asenath-Smith, R. Hovden, Y. Jiang, M. Riccio, D. A. Muller, V. Elser, L. A. Estroff, S. M. Gruner and U. Wiesner, Science, 2013, 341, 530–534 CrossRef CAS PubMed.
- M. W. Schulze, L. D. McIntosh, M. A. Hillmyer and T. P. Lodge, Nano Lett., 2014, 14, 122–126 CrossRef CAS PubMed.
- H. Jinnai, Y. Nishikawa, T. Koga and T. Hashimoto, Macromolecules, 1995, 28, 4782–4784 CrossRef CAS.
- P. Sarazin, X. Roy and B. D. Favis, Biomaterials, 2004, 25, 5965–5978 CrossRef CAS PubMed.
- F. S. Bates, W. W. Maurer, P. M. Lipic, M. A. Hillmyer, K. Almdal, K. Mortensen, G. H. Fredrickson and T. P. Lodge, Phys. Rev. Lett., 1997, 79, 849–852 CrossRef CAS.
- Microemulsions: Structure and Dynamics, ed. S. E. Friberg and P. OBothorel, CRC Press, Boca Raton, FL, 1987 Search PubMed.
- R. Strey, Colloid Polym. Sci., 1994, 272, 1005–1019 CAS.
- L. Kielhorn and M. Muthukumar, J. Chem. Phys., 1997, 107, 5588–5608 CrossRef CAS.
- D. Düchs, V. Ganesan, G. H. Fredrickson and F. Schmid, Macromolecules, 2003, 36, 9237–9248 CrossRef.
- J. H. Lee, M. L. Ruegg, N. P. Balsara, Y. Zhu, S. P. Gido, R. Krishnamoorti and M.-H. Kim, Macromolecules, 2003, 36, 6537–6548 CrossRef CAS.
- M. A. Hillmyer, W. W. Maurer, T. P. Lodge, F. S. Bates and K. Almdal, J. Phys. Chem. B, 1999, 103, 4814–4824 CrossRef CAS.
- B. M. Habersberger, T. M. Gillard, R. J. Hickey, T. P. Lodge and F. S. Bates, ACS Macro Lett., 2014, 3, 1041–1045 CrossRef CAS.
- G. Pandav and V. Ganesan, Macromolecules, 2013, 46, 8334–8344 CrossRef CAS.
- M. Teubner and R. Strey, J. Chem. Phys., 1987, 87, 3195–3200 CrossRef CAS.
- K. V. Schubert, R. Strey, S. R. Kline and E. W. Kaler, J. Chem. Phys., 1994, 101, 5343–5355 CrossRef CAS.
- M. E. Cates, D. Andelman, S. A. Safran and D. Roux, Langmuir, 1988, 4, 802–806 CrossRef CAS.
- P. G. De Gennes and C. Taupin, J. Phys. Chem., 1982, 86, 2294–2304 CrossRef CAS.
- D. C. Morse, Phys. Rev. E: Stat. Phys., Plasmas, Fluids, Relat. Interdiscip. Top., 1994, 50, R2423–R2426 CrossRef CAS.
- D. C. Morse, Curr. Opin. Colloid Interface Sci., 1997, 2, 365–372 CrossRef CAS.
- Y. Talmon and S. Prager, J. Chem. Phys., 1978, 69, 2984–2991 CrossRef CAS.
- Y. Talmon and S. Prager, J. Chem. Phys., 1982, 76, 1535–1538 CrossRef CAS.
- Z. G. Wang and S. A. Safran, J. Phys., 1990, 51, 185–200 CAS.
- K. L. Brinker, S. G. J. Mochrie and W. R. Burghardt, Macromolecules, 2007, 40, 5150–5160 CrossRef CAS.
- W. R. Burghardt, K. Krishnan, F. S. Bates and T. P. Lodge, Macromolecules, 2002, 35, 4210–4215 CrossRef CAS.
- K. Krishnan, B. Chapman, F. S. Bates, T. P. Lodge, K. Almdal and W. R. Burghardt, J. Rheol., 2002, 46, 529–554 CrossRef CAS.
- T. L. Morkved, B. R. Chapman, F. S. Bates, T. P. Lodge, P. Stepanek and K. Almdal, Faraday Discuss., 1999, 112, 335–350 RSC.
- T. L. Morkved, P. Stepanek, K. Krishnan, F. S. Bates and T. P. Lodge, J. Chem. Phys., 2001, 114, 7247–7259 CrossRef CAS.
- N. Zhou, F. S. Bates, T. P. Lodge and W. R. Burghardt, J. Rheol., 2007, 51, 1027–1046 CrossRef CAS.
- K. Krishnan, K. Almdal, W. R. Burghardt, T. P. Lodge and F. S. Bates, Phys. Rev. Lett., 2001, 87, 098301 CrossRef CAS PubMed.
- K. Krishnan, W. R. Burghardt, T. P. Lodge and F. S. Bates, Langmuir, 2002, 18, 9676–9686 CrossRef CAS.
- B. Narayanan, V. Pryamitsyn and V. Ganesan, Phys. Rev. Lett., 2006, 96, 028302 CrossRef PubMed.
- G. Porte, Curr. Opin. Colloid Interface Sci., 1996, 1, 345–349 CrossRef CAS.
- P. Snabre and G. Porte, Europhys. Lett., 1990, 13, 641 CrossRef CAS.
- R. Mezzenga, C. Meyer, C. Servais, A. I. Romoscanu, L. Sagalowicz and R. C. Hayward, Langmuir, 2005, 21, 3322–3333 CrossRef CAS PubMed.
- R. N. Kleiman, D. J. Bishop, R. Pindak and P. Taborek, Phys. Rev. Lett., 1984, 53, 2137–2140 CrossRef CAS.
- T. M. Clausen, P. K. Vinson, J. R. Minter, H. T. Davis, Y. Talmon and W. G. Miller, J. Phys. Chem., 1992, 96, 474–484 CrossRef CAS.
- C. A. Dreiss, Soft Matter, 2007, 3, 956–970 RSC.
- S. A. Rogers, M. A. Calabrese and N. J. Wagner, Curr. Opin. Colloid Interface Sci., 2014, 19, 530–535 CrossRef CAS.
- L. M. Walker, Curr. Opin. Colloid Interface Sci., 2001, 6, 451–456 CrossRef CAS.
- G. Pätzold and K. Dawson, Phys. Rev. E: Stat. Phys., Plasmas, Fluids, Relat. Interdiscip. Top., 1996, 54, 1669–1682 CrossRef.
- P. Falus, M. A. Borthwick, S. Narayanan, A. R. Sandy and S. G. J. Mochrie, Phys. Rev. Lett., 2006, 97, 066102 CrossRef CAS PubMed.
- E. Freyssingeas and D. Roux, J. Phys. II, 1997, 7, 913–929 CrossRef CAS.
- S. Komura, T. Takeda, Y. Kawabata, S. K. Ghosh, H. Seto and M. Nagao, Phys. Rev. E: Stat., Nonlinear, Soft Matter Phys., 2001, 63, 041402 CrossRef CAS PubMed.
- M. Maugey and A. M. Bellocq, Langmuir, 2001, 17, 6740–6742 CrossRef CAS.
- M. E. Cates and S. J. Candau, J. Phys.: Condens. Matter, 1990, 2, 6869 CrossRef CAS.
- H. Rehage and H. Hoffmann, Mol. Phys., 1991, 74, 933–973 CrossRef CAS.
- R. Granek, J. Phys. II, 1997, 7, 1761–1788 CrossRef CAS.
- L. Porcar, W. A. Hamilton, P. D. Butler and G. G. Warr, Langmuir, 2003, 19, 10779–10794 CrossRef CAS.
- L. Porcar, W. A. Hamilton, P. D. Butler and G. G. Warr, Phys. Rev. Lett., 2004, 93, 198301 CrossRef CAS PubMed.
- B. M. Habersberger, T. P. Lodge and F. S. Bates, Macromolecules, 2012, 45, 7778–7782 CrossRef CAS.
- R. J. Hickey, T. M. Gillard, T. P. Lodge and F. S. Bates, ACS Macro Lett., 2015, 4, 260–265 CrossRef CAS.
- L. J. Fetters, D. J. Lohse, D. Richter, T. A. Witten and A. Zirkel, Macromolecules, 1994, 27, 4639–4647 CrossRef CAS.
- S. J. Weigand and D. T. Keane, Nucl. Instrum. Methods Phys. Res., 2011, 649, 61–63 CrossRef CAS.
- S. Kline, J. Appl. Crystallogr., 2006, 39, 895–900 CrossRef CAS.
- M. D. Gehlsen, J. H. Rosedale, F. S. Bates, G. D. Wignall, L. Hansen and K. Almdal, Phys. Rev. Lett., 1992, 68, 2452–2455 CrossRef CAS PubMed.
- F. S. Bates and G. D. Wignall, Macromolecules, 1986, 19, 932–934 CrossRef CAS.
- G. M. Brown and J. H. Butler, Polymer, 1997, 38, 3937–3945 CrossRef.
- J. G. Kennemur, M. A. Hillmyer and F. S. Bates, ACS Macro Lett., 2013, 2, 496–500 CrossRef CAS.
- J. G. Kennemur, M. A. Hillmyer and F. S. Bates, Macromolecules, 2012, 45, 7228–7236 CrossRef CAS.
- G. H. Fredrickson and F. S. Bates, Annu. Rev. Mater. Sci., 1996, 26, 501–550 CrossRef CAS.
- Small Angle X-ray Scattering, ed. O. Glatter and O. Kratky, Academic Press, New York, 1982 Search PubMed.
- S. Lee, T. M. Gillard and F. S. Bates, AIChE J., 2013, 59, 3502–3513 CrossRef CAS.
- H. Jinnai, T. Koga, Y. Nishikawa, T. Hashimoto and S. T. Hyde, Phys. Rev. Lett., 1997, 78, 2248–2251 CrossRef CAS.
- F. S. Bates, J. H. Rosedale and G. H. Fredrickson, J. Chem. Phys., 1990, 92, 6255–6270 CrossRef CAS.
- D. Broseta and G. H. Fredrickson, J. Chem. Phys., 1990, 93, 2927–2938 CrossRef CAS.
- J. H. Rosedale and F. S. Bates, Macromolecules, 1990, 23, 2329–2338 CrossRef CAS.
- P. Falus, M. A. Borthwick and S. G. J. Mochrie, Phys. Rev. Lett., 2005, 94, 016105 CrossRef CAS PubMed.
- Structure-Performance Relationships in Surfactants, ed. K. Esumi and M. Ueno, Marcel Dekker, New York, 1997 Search PubMed.
- M. Doi and S. F. Edwards, The Theory of Polymer Dynamics, Oxford University Press, Oxford, 1990 Search PubMed.
- J. F. Berret, J. Appell and G. Porte, Langmuir, 1993, 9, 2851–2854 CrossRef CAS.
- V. K. Gupta, R. Krishnamoorti, Z. R. Chen, J. A. Kornfield, S. D. Smith, M. M. Satkowski and J. T. Grothaus, Macromolecules, 1996, 29, 875–884 CrossRef CAS.
- R. M. Kannan and J. A. Kornfield, Macromolecules, 1994, 27, 1177–1186 CrossRef CAS.
- K. A. Koppi, M. Tirrell, F. S. Bates, K. Almdal and R. H. Colby, J. Phys. II, 1992, 2, 1941–1959 CrossRef CAS.
- S. S. Patel, R. G. Larson, K. I. Winey and H. Watanabe, Macromolecules, 1995, 28, 4313–4318 CrossRef CAS.
- A. J. Levine and F. C. MacKintosh, Phys. Rev. E: Stat., Nonlinear, Soft Matter Phys., 2002, 66, 061606 CrossRef PubMed.
- W. Helfrich, Z. Naturforsch., C: J. Biosci., 1973, 28, 693–703 CAS.
- W. Helfrich, Z. Naturforsch., A: Phys. Sci., 1978, 33, 305–315 Search PubMed.
- W. Helfrich and R. M. Servuss, Il Nuovo Cimento D, 1984, 3, 137–151 CrossRef.
- A. G. Zilman and R. Granek, Phys. Rev. Lett., 1996, 77, 4788–4791 CrossRef CAS PubMed.
- O. Holderer, H. Frielinghaus, D. Byelov, M. Monkenbusch, J. Allgaier and D. Richter, J. Chem. Phys., 2005, 122, 094908 CrossRef PubMed.
- O. Holderer, H. Frielinghaus, M. Monkenbusch, M. Klostermann, T. Sottmann and D. Richter, Soft Matter, 2013, 9, 2308–2313 RSC.
Footnotes |
| † Electronic supplementary information (ESI) available. See DOI: 10.1039/c5sm02009c |
| ‡ Authors contributed equally. |
| This journal is © The Royal Society of Chemistry 2016 |

