
Coalescence of drops in a 2D microchannel: critical transitions to autocatalytic behaviour
M.
Danny Raj
and
Raghunathan
Rengaswamy
*
Indian Institute of Technology, Madras, 150, Mechanical Sciences Block, Chennai-600036, India. E-mail: raghur@iitm.ac.in; danny.presto@gmail.com
First published on 25th September 2015
Abstract
A single coalescence event in a 2D concentrated emulsion in a microchannel can trigger an avalanche of similar events that can destabilize the entire assembly of drops. The sensitive dependence of the process on numerous parameters makes the propagation dynamics appear probabilistic. In this article, a stochastic simulation framework is proposed to understand this collective behavior in a system employing a large number of drops. We discover that the coalescence propagation dynamics exhibit a critical behavior where two outcomes are favored: no avalanche and large avalanches. Our analysis reveals that this behavior is a result of the inherent autocatalytic nature of the process. The effect of the aspect ratio of the drop assembly on the propagation dynamics is studied. We generate a parametric plot that shows the region of the parameter space where the propagation, averaged over the ensemble, is autocatalytic: where the possibility of near destabilization of the drop assembly appears.
Introduction
Understanding coalescence is challenging because of its non-linear and multi-scale nature.1–3 Theoretical and experimental investigations have been carried out in an attempt to understand the dynamics and stability of an emulsion.4–8 From sophisticated force measurements and high fidelity mathematical models9 to time and space resolved microfluidic experiments10–17 have been performed to explore the underlying mechanisms of the two-drop coalescence problem. Experimental evidence shows that coalescence in an ensemble of drops can result in very different behaviours: Migler showed that as the shear rate was decreased, drops organized and coalesced to form liquid strings;18 Bremond and co-workers studied coalescence in a surfactant stabilized concentrated 2D emulsion where they found that one coalescence event can result in an avalanche of similar events destabilizing the entire assembly of drops.19 Through this article, we propose a conceptual stochastic framework to study the system-level behaviour of such problems.We adopt a complex systems approach – where drops can be modelled as individual entities interacting with each other and the surroundings20 – to solve the problem. Such an approach has been used for modelling other physical phenomena that involve non-coalescing droplet motion in droplet microfluidics.
Examples would be phonon-like behaviour because of long range interactions,21 self-organization into ordered patterns,22 and discrete droplet decisions in microfluidic loops that lead to interesting temporal patterns.23 In these cases, models that explain drop-level interactions are developed and the system-level behaviour is simulated by considering the effect of all the drops together.24–27 However, not all the interactions are easy to model from a first principles approach. For example, Bremond et al. in their experiments realized that the sensitive dependence of coalescence on local conditions made the process appear stochastic. We make one of the first attempts to study such problems in droplet microfluidics through a stochastic framework. In this article, we address the problem of coalescence propagation observed by Bremond and co-workers, where we try to understand the coalescence propagation in a 2D ensemble in a Hele-Shaw geometry. Drops can be packed tightly in such a microchannel to form a 2D concentrated emulsion. The stability of the emulsion depends on its immunity to coalescence events. If local coalescence events propagate through the assembly of drops, stability is compromised. Hence it is important to understand the collective behavior of drops in 2D microchannels.
The problem
Drops coalesce when the thin film of continuous phase fluid between them drains and the drops meet. Experimental results show a rather counter-intuitive result where two closely placed drops coalesce upon decompression.10 This is possible because when two drops are pulled apart, the low pressure between the drops deforms and pulls both the interfaces together facilitating contact, which results in coalescence. Efforts have been made to understand the mechanism of coalescence.17,28,29 In a concentrated emulsion, when two drops coalesce they move towards each other. In the process they get pulled away from every other drop in the neighbourhood. This retraction results in a low pressure region around the coalescing pair, which avalanches into a cascade of coalescence events.19 In a 2D microchannel, during an avalanche, drops self-organize (re-arrangement and shape relaxation19) inside the channel as they coalesce, making the problem complicated to model from a first principles approach. Also, the high sensitivity of coalescence propagation to factors like the film thickness and surfactant concentration and the continuous organization of drops and the shape relaxation of the growing cluster make the propagation appear seemingly stochastic. Hence not every coalescence event resulted in an avalanche. The boxed portions in Fig. 1a show the different avalanche sizes observed in microchannels that were a result of two separate coalescence events. To understand this behaviour, Bremond et al. considered a combination of three drops and experimentally measured the probability P(θ) of drop 3 to coalesce with a coalescing pair (1 and 2) as a function of the orientation of the three drops (defined by θ)19 (see Fig. 1b, where the inset shows the angle θ that the drop 3 makes with the pair of drops 1 and 2). However, the function P does not shed light on the system-level collective behaviour, propagated coalescence, which is a multi-drop interaction phenomenon. Also from a scientific perspective it would be interesting to understand the effect of the microchannel design on the probability of a coalescence avalanche that can de-stabilize the whole assembly of drops (a typical destabilization is shown in the larger box in Fig. 1a). In summary, we seek to answer the following questions regarding propagated coalescence: (i) how does one utilize the probability of local coalescence events to study the system-level behaviour, (ii) how is the stochastic nature of a coalescence event in a concentrated emulsion related to the destabilization of the drop assembly, and (iii) do microchannel design choices affect this coalescence propagation?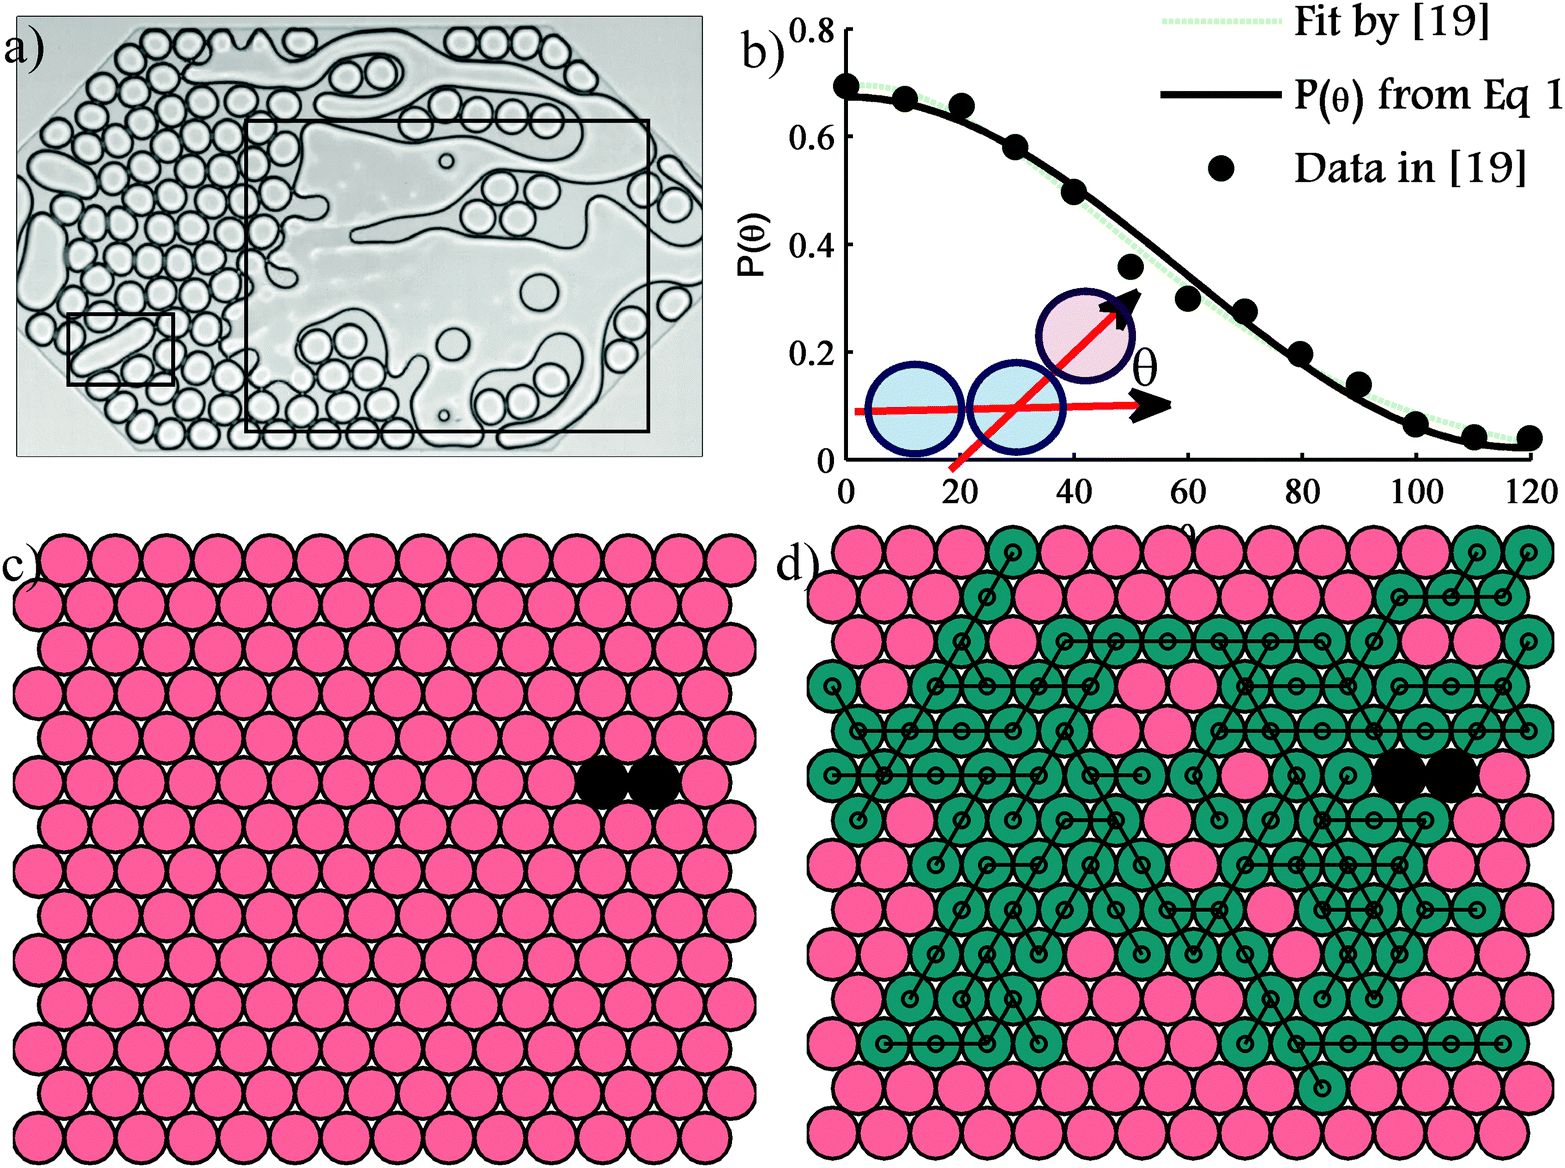 | ||
| Fig. 1 (a) Experimental evidence of avalanches (snapshots) of different sizes (see inside box) (Bremond et al., 2011) [courtesy: Nicholas Bremond for sharing video results not available in the literature]; (b) probability of coalescence as a function of theta (data digitized from ref. 19), fit-polynomial (ref. 19) and P(θ) according to eqn (1); (c) a realization in the stochastic simulation that shows very little propagation, (d) realization showing high levels of propagation. [Black: initial pair that is made to coalesce; green drops connected by yellow lines: drops that have coalesced; peach: free drops that are yet to coalesce.] | ||
Model
We answer these questions through a stochastic bottom-up simulation framework that incorporates the measure of probability P(θ) experimentally obtained by Bremond et al.19 to simulate the coalescence propagation in a 2D system that employs large number of drops. Bremond et al. fit a fourth order polynomial for the probability data. But a cosine functional form would explain the physics better. When two drops coalesce they move towards each other with a velocity Uc(t). A third drop present in the neighbourhood, which makes an angle θ with the coalescing pair, will experience a pulling effect Uc(t)![[thin space (1/6-em)]](https://www.rsc.org/images/entities/char_2009.gif) cos(θ(t)). We find that the experimentally measured P (Fig. 1b) follows a trend similar to the above expression. In the dynamic coalescence process, as time proceeds, θ (except for the case where all three drops are positioned on a straight line) and Uc decrease, with Uc decreasing exponentially.19 Hence a more general functional form [Acos(Bθ) + C], as shown in eqn (1), is able to explain the θ dependence of P, where {A, B, C} ∼ {0.32, 1.57, 0.36} for Bremond's data.19 Further, we introduce a continuation parameter (while retaining the functional form) α to study a large spectrum of systems, from non-coalescing (α = 0) to readily coalescing (large α). The parameter α will take a value of one for the case of Bremond's experiments.
cos(θ(t)). We find that the experimentally measured P (Fig. 1b) follows a trend similar to the above expression. In the dynamic coalescence process, as time proceeds, θ (except for the case where all three drops are positioned on a straight line) and Uc decrease, with Uc decreasing exponentially.19 Hence a more general functional form [Acos(Bθ) + C], as shown in eqn (1), is able to explain the θ dependence of P, where {A, B, C} ∼ {0.32, 1.57, 0.36} for Bremond's data.19 Further, we introduce a continuation parameter (while retaining the functional form) α to study a large spectrum of systems, from non-coalescing (α = 0) to readily coalescing (large α). The parameter α will take a value of one for the case of Bremond's experiments.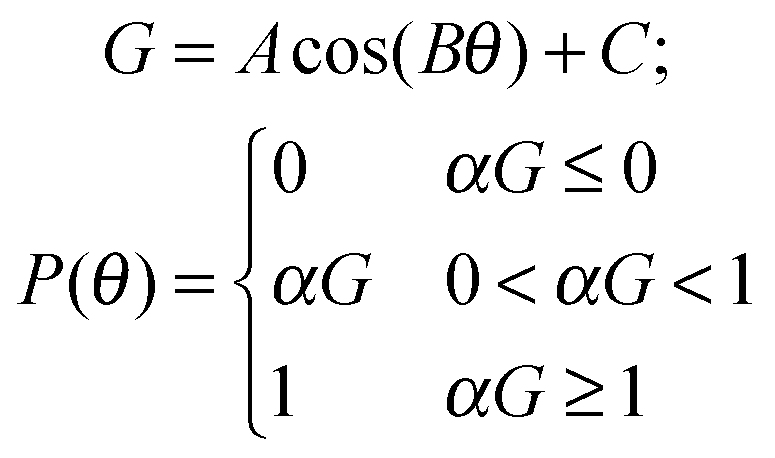 | (1) |
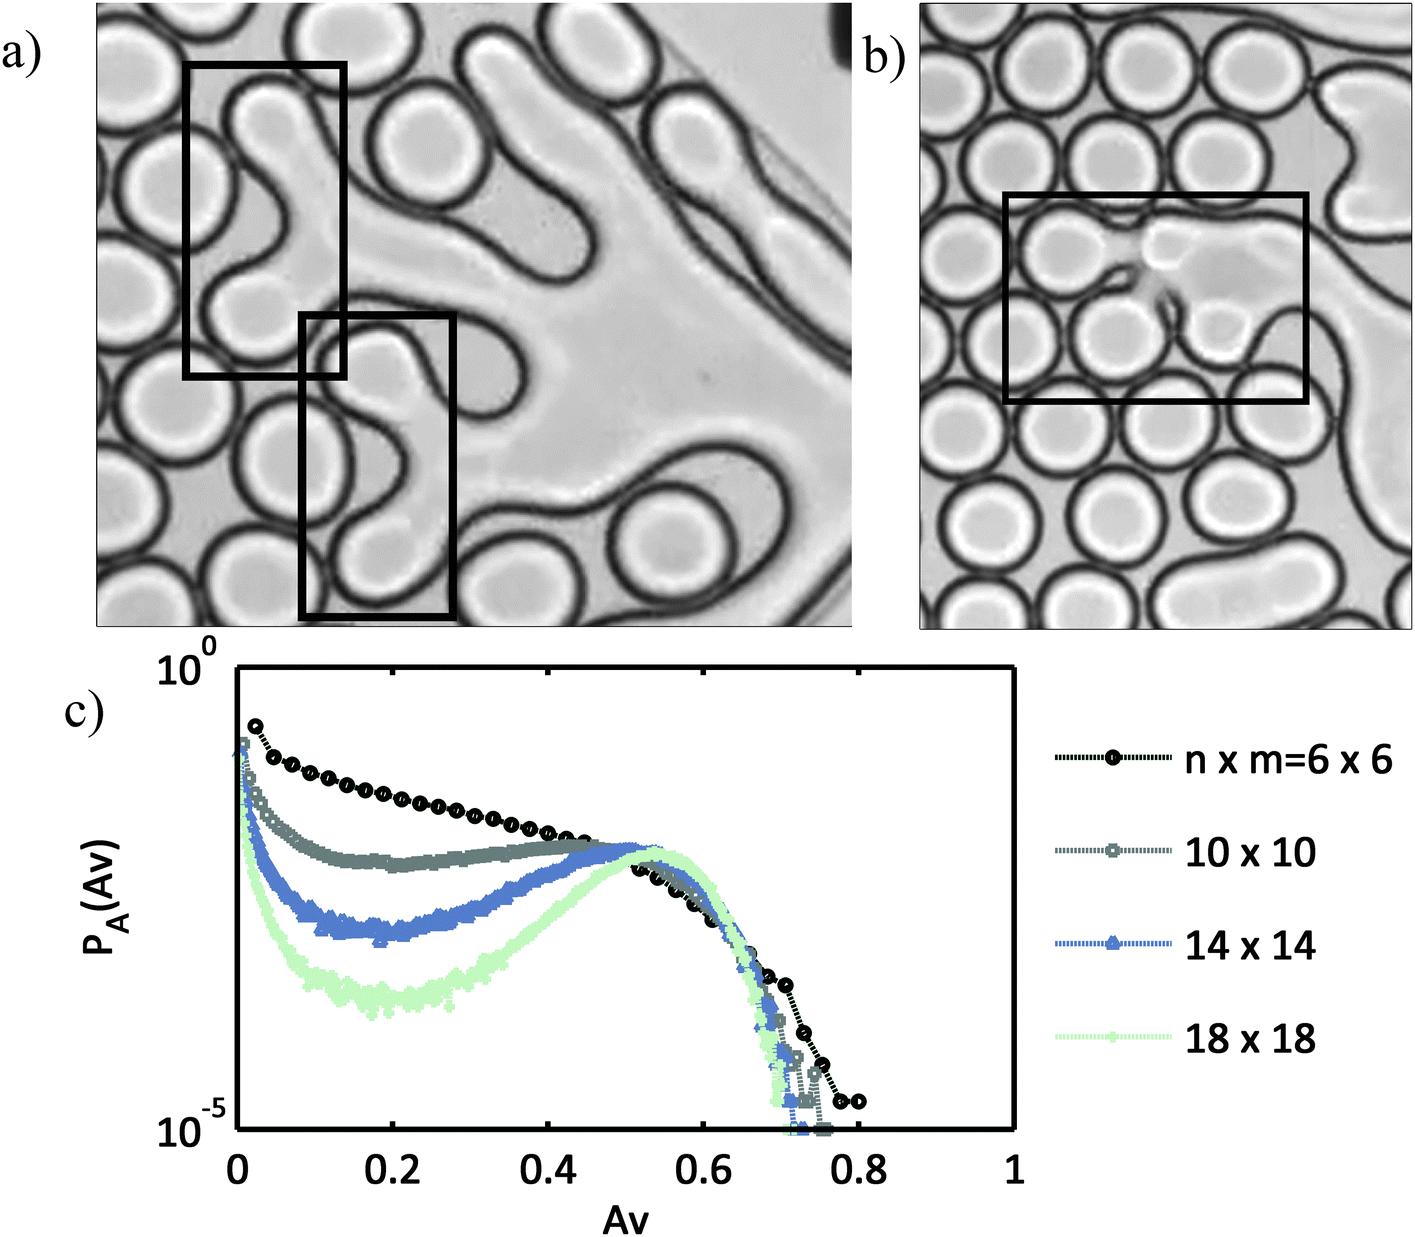 | ||
| Fig. 2 (a and b) Evidence for propagation through multiple drops and formation of complex shapes that have local regions with high curvature [courtesy of Nicholas Bremond for sharing video results not available in the literature]. (c) Probability of occurrence of an avalanche PA(Av) = 3 as a function of the size Av (normalized with Avmax = 3nm − 2(n + m) + 1, where the lattice is of size n × m) of the avalanche for different system sizes (n × m). 105 independent simulations were carried out to generate this probability curve. | ||
Algorithm
(i) A 2D hexagonal lattice with n2 drops is initialized (with n rows and n columns; aspect ratio = 1) (see Fig. 1c and d).(ii) Coalescence is initiated through a randomly chosen pair of drops i and j, which are represented as circles with a black fill in Fig. 1c and d.
(iii) Drops i and j are assigned to the set Ac (active drops) in the following manner: Ac = {(i,j), (j,i)}, where the first element of the ordered pair represents the node from which the propagation is about to happen and the second element is used to determine the angle made by the pair with their neighbouring drops.
(iv) A neighbour set Nc is generated, which is represented as Nc = {(n1i,j, n2i,j…npi,j), (n1j,i, n2j,i…nqj,i)}; p, q < 5, a set of n-tuples where n can take a maximum of 5. Each list of n-tuples corresponds to a specific ordered pair in Ac. Definition of a neighbour: drop 1 is the neighbour of drop 2 if the distance between them in the lattice is equal to the sum of the radii of the drops 1 and 2.
(v) If Nc ≠ ∅ continue; else set Ac = ∅ and go to step (vii).
(vi) Coalescence propagation through each of the elements (drops) of the set Nc is effected stochastically using the probability P(θ),
(a) choose a drop (k) from the set Nc
(b) compute the probability based on its orientation with the corresponding ordered pair in set Ac
(c) select a uniform random number U ∈ [0, 1]
(d) if U < P(θk), then k has coalesced with the cluster – add this drop to a new set Ac_new
(e) repeat the steps for all drops in all the n-tuples in the set Nc.
(vii) Set Ac = ∅ and assign Ac = Ac_new; if Ac ≠ ∅ go to step (iii), else continue.
(viii) Terminate.
A randomly chosen coalescing pair of drops has ten neighbours (if the pair is not at an edge of the lattice). Propagation can happen through all these neighbours. But the stochastic nature of the problem reduces the chances of propagation through all neighbours based on P(θ). The framework that we propose, as explained in the algorithm, effectively uses P(θ) that explains coalescence locally to simulate propagation in the entire assembly.
Nature of propagation
The proposed algorithm is event based. Simulations using this algorithm start with a coalescence of a random pair, which we call the first generation or the first event. The propagation through the neighbours of the coalesced pair leads to the second event and so on. Because the simulations are stochastic, every realization will yield a different result. Results from the simulations presented in Fig. 1c and d indicate that the stochastic framework is able to capture propagation events with avalanches of different sizes, where size of the avalanche Av is the number of individual coalescence events in an avalanche. While this demonstrates the ability of the proposed approach to capture the physics behind the experiments, one would like to understand more quantitatively the probability with which an avalanche of a certain size is likely to occur. To probe this we carry out >105 independent simulations to understand the ensemble behaviour of the system. This analysis is carried out for different system sizes. From the ensemble data, the probability of avalanche PA(Av) is computed as a function of size of the avalanche and is plotted in Fig. 2c for different system sizes considered. For a given P(θ); α = 1, systems with n ≤ 7 (49 drops) have a PA(Av) curve that decreases monotonically with increasing avalanche size. Interestingly, larger systems where n > 7 show emergent behaviour. In such cases, the PA(Av) curve becomes non-monotonic and larger avalanches occur with greater probability than smaller ones (a new peak emerges). This is a very interesting, difficult to comprehend emergent characteristic that is of critical practical importance from a stability view point because the probability of avalanches is directly related to the probability of destabilization of the drop assembly. As the system size increases, the region near the minima of the PA(Av) curve becomes smaller than 10−5 and the maxima (peak) sharpens, which suggests that an experimentalist working with O(103) drops, for this system as characterized by P(θ), would observe either very small avalanches or large ones that cover almost the whole channel. It is worth reiterating here that such non-intuitive insight about the multi-drop system is being derived from purely a 3-body probability function and a stochastic framework. The next step is to understand the reasons behind the propagation dynamics showing critical behaviour.In an attempt to understand the appearance of the hump in the PA(Av), we try to investigate why certain avalanches in the size range ∼(0.1–0.3) have a lower probability of occurrence. To do so, we observe the average ensemble behaviour at the last generation and the dynamics near the avalanche size that has the minimum probability. As coalescence propagates through a sequence of events, the size of Ac in the cluster varies. In the last generation (event) there are ML drops in the set Ac, which have to stop coalescing for propagation to cease. From Fig. 3a, it can be seen that it is highly likely that a small ML will be found. From Fig. 3b it is also evident that the probability of finding enough neighbours in the last generation follows a similar trend. So for a typical avalanche, the active drops have to reduce to a small number before the propagation stops. Avmin is the point at which PA(Av) shows a minimum in Fig. 2c. From the dynamics of the avalanche process, we compute the average number of events (number of generations) taken for a growing avalanche to reach (or cross) the size (Avmin) with minimum probability. From Fig. 3c one can infer that avalanches that stopped growing when its size was close to the minima (Avmin) take longer time to reach Avmin than the larger avalanches that have higher probability of occurrence. This means that the rate of cluster growth of an avalanche when its size is Avmin is higher for avalanches with higher probability of occurrence. Along with the fact that most of the clusters stop propagating only when ML is small, the computed results suggest that for an actively growing cluster to stop propagating the number of active drops should reduce, which makes this event less likely. This helps us understand why avalanches of a certain size range have lower probabilities of occurrence.
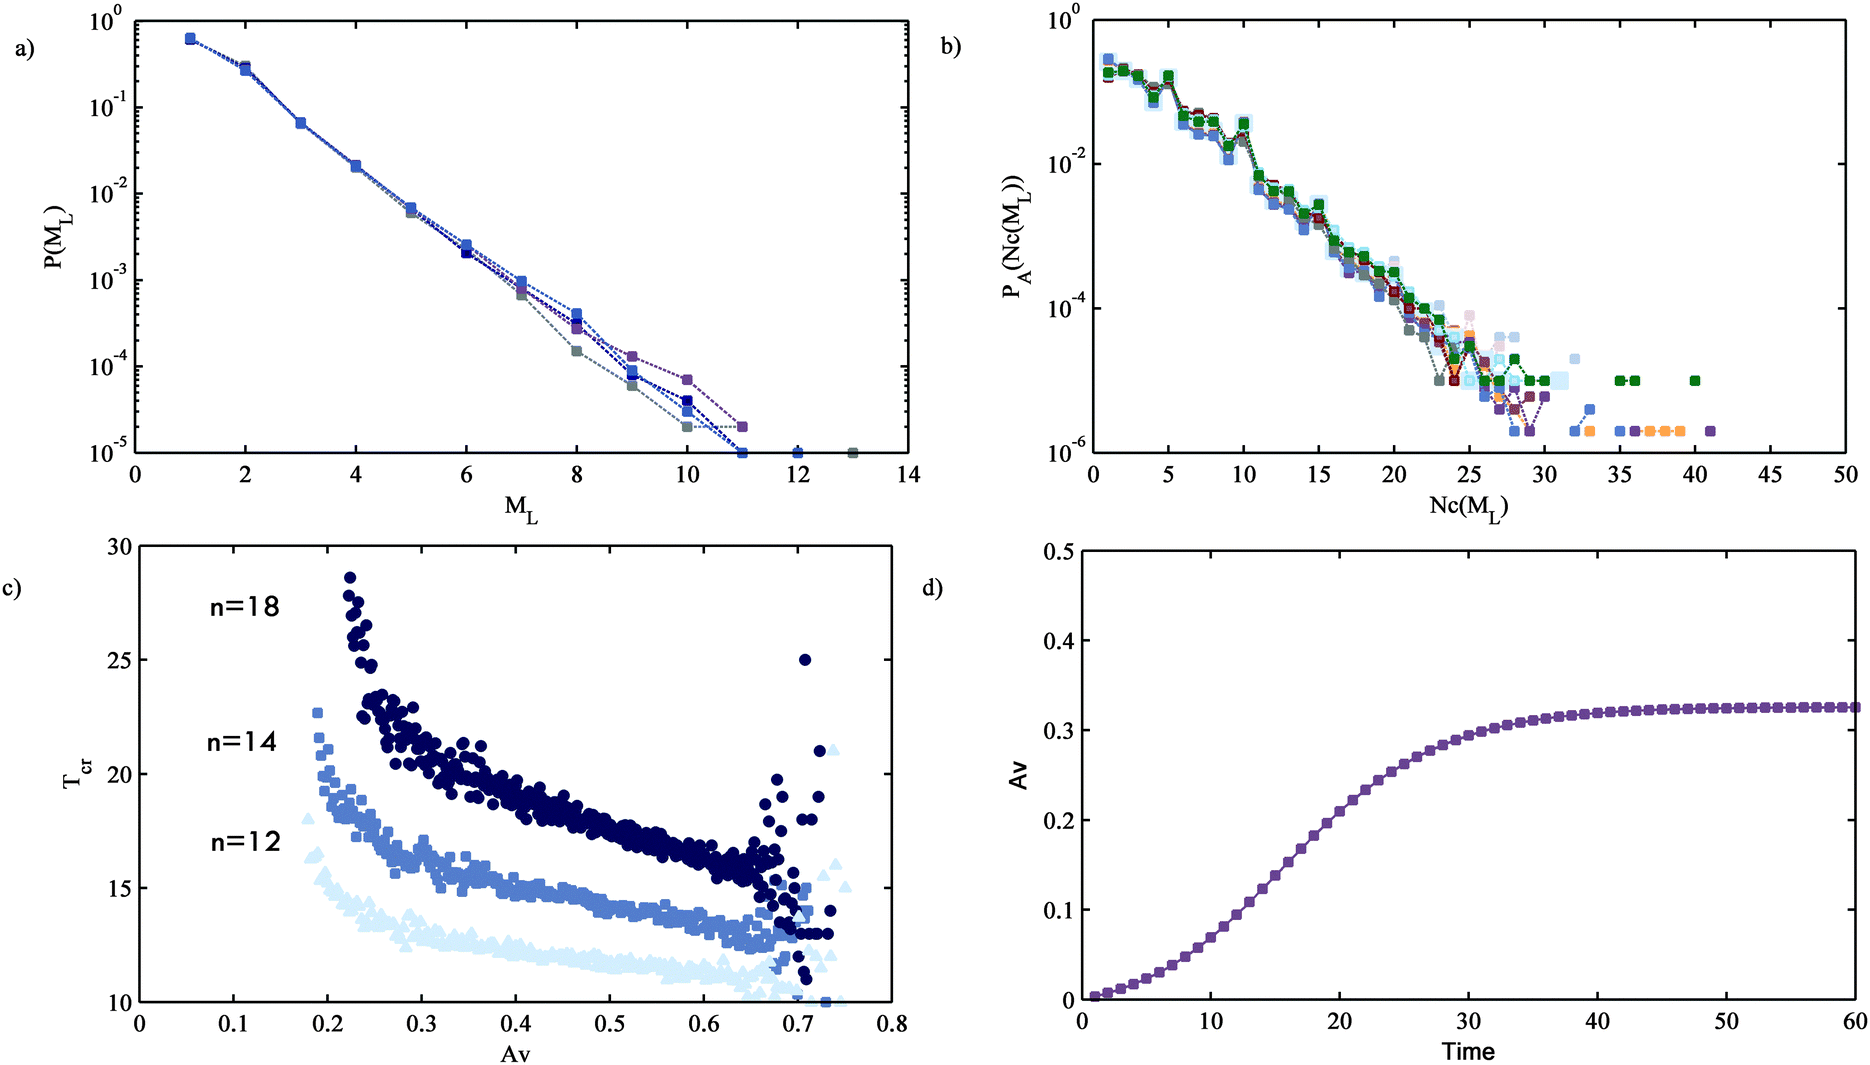 | ||
| Fig. 3 (a) Probability of finding ML active drops in the last generation (P(ML)) as a function of the size (ML) for systems with n ranging from 6 to 22; (b) probability of finding Nc(ML) neighbours [P(Nc(ML))] of active drops in the last generation as a function of the size (Nc(ML)) for systems with n ranging from 6 to 22; (c) average number of events or generations (Tcr) taken by a growing avalanche to reach the size with the minimum probability; (d) time (in generations) evolution of an avalanche size (Av) averaged over ∼105 simulations. A sigmoidal growth curve is seen which is characteristic of an autocatalytic process. | ||
Hence, one can conclude that if a cluster does not stop propagating when its size is small, it is likely to grow to cover almost the whole system (see Fig. 1a and d). It is important that we understand the reason for this ‘runaway’ like behaviour. We propose that as the cluster grows, the size of Ac increases, which in turn amplifies the rate of cluster growth making the coalescence propagation autocatalytic. A plot of the average avalanche size as a function of the number of events (Fig. 3d) shows the sigmoidal nature of the growth which is a characteristic of an autocatalytic process. For example, Ritacco and co-workers also observed a sigmoidal like death curve when investigating the lifetime of bubble rafts.30 The authors use an algorithm where there is multi-drop interaction and report PA(Av) with features similar to ours. However, they attribute their observation to the cooperative nature of the process where the death of a bubble influences the probability of the death of its neighbours. But in our simulations the drops do not show cooperative behaviour – because the probability of propagation is a function only of the orientation of drops – yet they show a hump in the PA(Av) plot and a sigmoidal growth curve. As a result, we hypothesize that the sigmoidal like behaviour can only be a result of the autocatalytic nature of the propagation.
Reason for autocatalytic behaviour
Several important questions arise at this juncture: why is coalescence propagation autocatalytic? Further, does a fluid system as the one studied here always show autocatalytic behaviour? To answer these questions we need to analyse the two important features of coalescence, the propagation mechanism, which depends on the number of neighbours available for propagation and the probability P(θ) which captures the intrinsic tendency for coalescence for different fluid systems.In an effort to understand the autocatalytic nature of the propagation, we study the number of neighbours available for coalescence using a simple conceptual measure that captures the nature of propagation. It is evident that during propagation each active drop has a certain number of neighbours ni with which it can coalesce. Based on this, one could calculate an average number of drops around an active drop. However, this measure might not be very illuminating as the probabilistic nature of the propagation and the θ dependence of the probability does not favour coalescence through all the neighbours equally. Hence, we find the effective number of neighbours (ne) available for coalescence by carrying out a weighted sum of the neighbours ne = ∑P(θi)ni, where the weights are the associated propagation probabilities for the corresponding neighbours. We then use the idea of “number averaging” to find the average effective number of neighbours 〈ne〉 averaged over time and all possible realizations, which is given by the expression  . Remarkably, we find that the critical value where the transition to dominant autocatalytic behaviour occurs is at 〈ne〉 = 3. This is a result that is quite non-obvious.
Effect of probability
When the fluids or the surfactant concentration in the microchannel system is changed, the propensity to coalesce captured by P(θ) changes. To capture the effect of this change, we carry out simulations by varying the continuation parameter α. As one would expect, for the asymptotic cases of α being zero (P(θ) = 0) and very large (P(θ) = 1), the behaviour is deterministic: no propagation and complete propagation, respectively. Fig. 4a shows the PA(Av) plot for different values of α. For values of 0 < α < αcr (in this case (n = 14), where αcr = 0.88, corresponding to 〈ne〉 = 3), the probability of avalanche decreases monotonically with size, showing no autocatalytic behaviour. Propagation becomes dominantly autocatalytic as αcr > 0.88 and the hump starts to appear. The most prominent feature of this non-monotonic region is the presence of two most favourable outcomes, no propagation and autocatalytic propagation, resulting in large avalanches (corresponding to the maxima in Fig. 2c and 4a). We speculate that in a deterministic simulation framework this observation might correspond to the presence of two stable equilibrium states. The avalanche size with the least probability might be the unstable steady state that separates the two stable ones. For very large α, we see a monotonically increasing trend as seen in Fig. 4a. To evaluate the behaviour across the complete spectrum, we observe the evolution of 〈ne〉 as α increases. Fig. 4b shows how 〈ne〉 varies with α. The α corresponding to 〈ne〉 = 3 marks the critical transition to dominantly autocatalytic behaviour. To understand the effect of system size on autocatalytic behaviour, this numerical exercise is repeated for different values of N and the corresponding αcr are computed. Fig. 4c shows the plot between αcr and N, which divides the parameter space into two regions: in the shaded region a system would not show autocatalytic behaviour and vice versa. In Bremond's work, N ≃ 235 and α = 1, we find that this point lies in the autocatalytic region in Fig. 4c (marked by a blue square), confirmed by the experiments reported in that paper.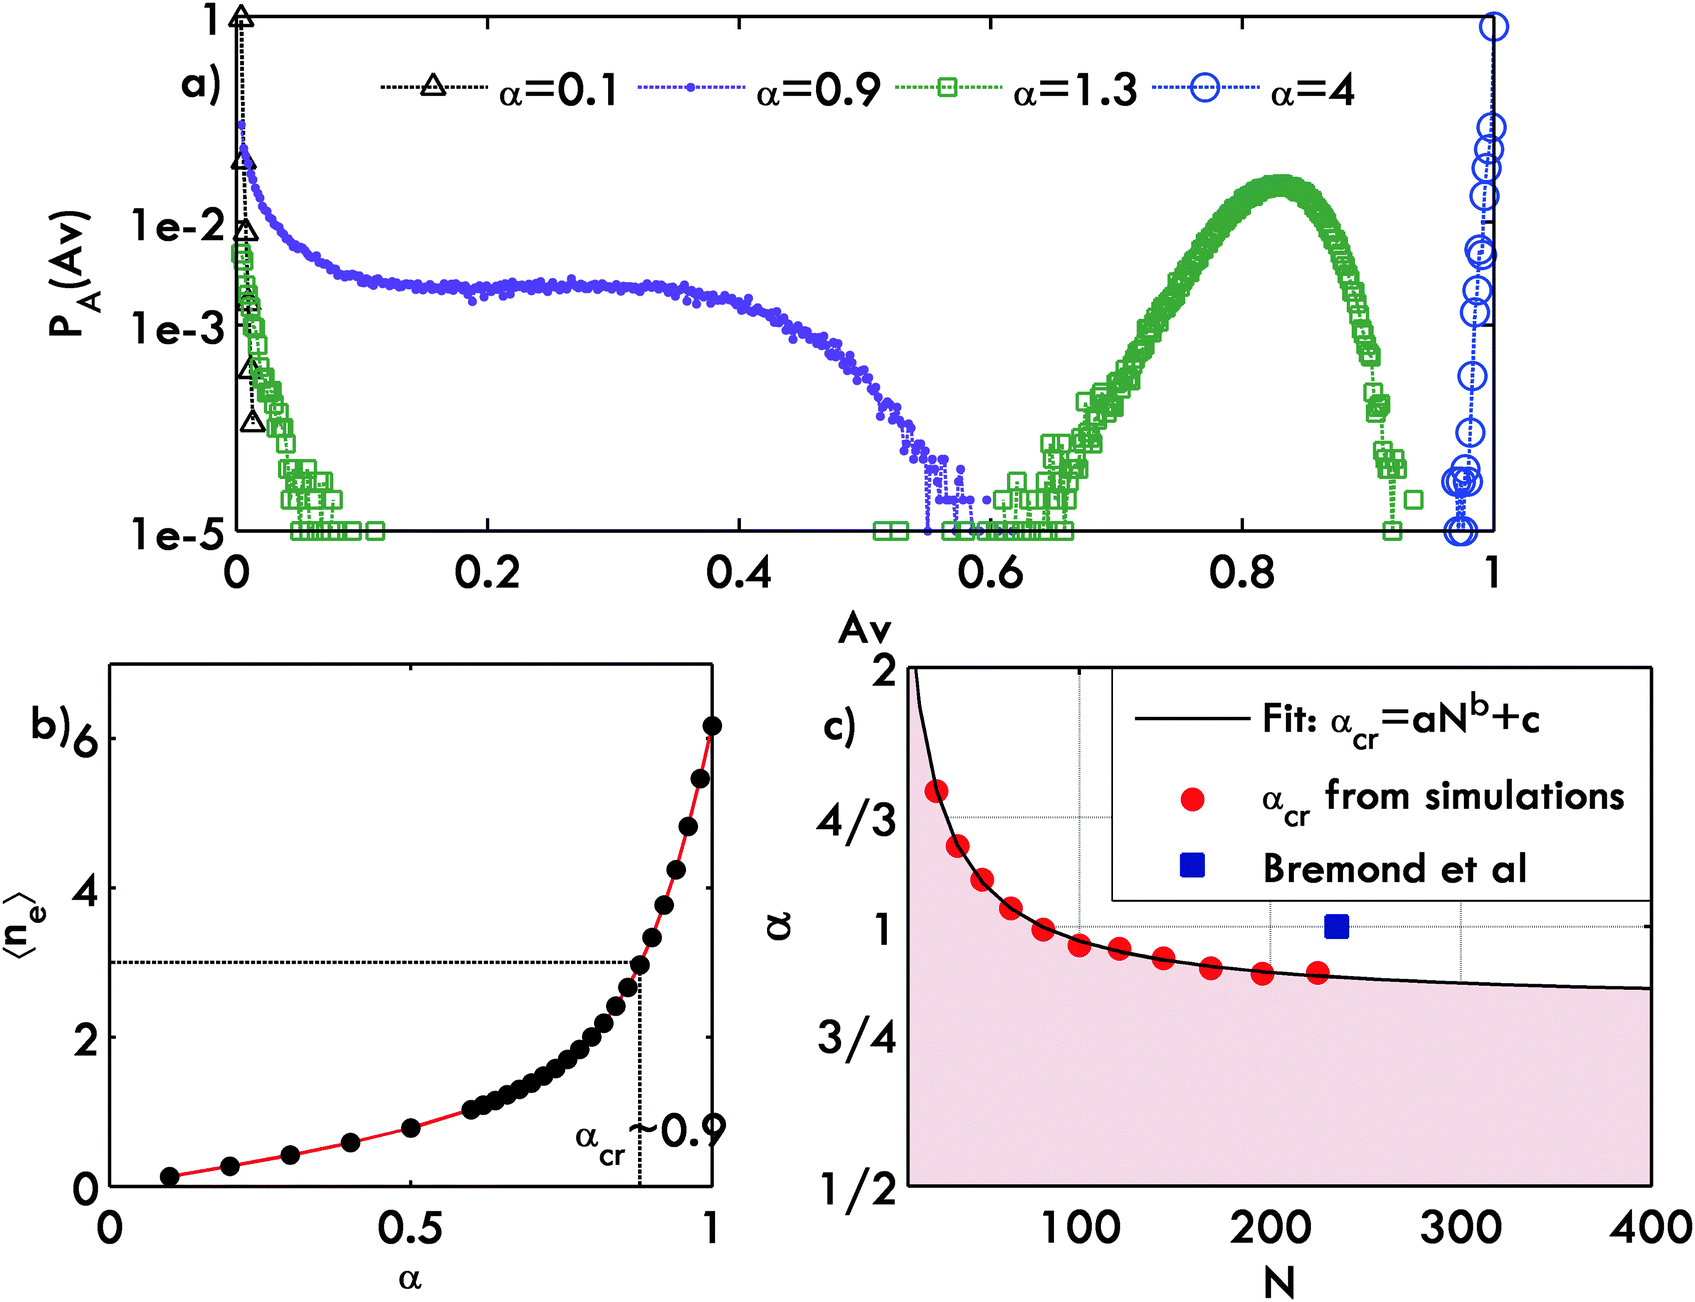 | ||
| Fig. 4 (a) Probability of avalanche PA(Av) as a function of size (Av) for different probability measures (varying α); (b) the weighted sum of neighbours 〈ne〉 as a function of α for a system size of 196 drops; αcr ∼ 0.9 at 〈ne〉 = 3; (c) parametric plot: critical value of α plotted as a function of N (total drops which is equal to n2); shaded region: no autocatalytic behaviour and vice versa. | ||
Effect of packing
With our stochastic formulation we are able to answer two important scientific questions: (1) for a given fluid system what is the drop ensemble size before autocatalytic propagation dominates and destabilizes the system? (2) When the number of drops is fixed and for a given fluid system, can the drops be packed in different ways that would reduce autocatalytic propagation? From Fig. 4c, for a given fluid system as characterized by a constant α, one can identify the critical number of drops that can be packed together before the propagation of coalescence in the ensemble becomes autocatalytic. Quite amazingly, our simulations show that fluid systems whose α < 0.84 can form stable emulsions largely independent of size: the propagation steps are non-autocatalytic, which would allow for a very large stable assembly of drops in channels with an aspect ratio equal to 1. Qualitatively similar transitions have been observed in the experiments of Baret and co-workers: when the effective surfactant concentration on the drop-continuous phase interface increases, there is a sharp transition from unstable to stable emulsions.16 Further, for the case where we have a constant number of drops for a certain fluid system, we study the effect of aspect ratio of the drop-assembly on its stability. Our simulations show that as the aspect ratio deviates from the value one, there is a reduction in the propagation, which results in the disappearance of the hump as seen in Fig. 5a. Though the hump disappears for an aspect ratio value of 0.2, the propagation remains autocatalytic and the number of average weighted neighbours available (see Fig. 5b) is greater than 3 (confirmed by the non-monotonic curves in Fig. 5c; a non-monotonic curve represents the sigmoidal growth of an avalanche). Another very interesting and non-intuitive result is that the presence of a hump implies autocatalytic propagation but the absence of the hump does not imply absence of autocatalytic propagation. Nonetheless, changing the aspect ratio affects the propagation because a cluster grows in all directions and presence of a wall would hinder the growth in that direction (the edge of the assembly in our case), reducing the average cluster size. We find that when the aspect ratio is less than 0.1, the propagation is no longer autocatalytic. This suggests that as the channel designs force the coalescence front to move increasingly in one dimension, autocatalytic propagation becomes less likely to happen.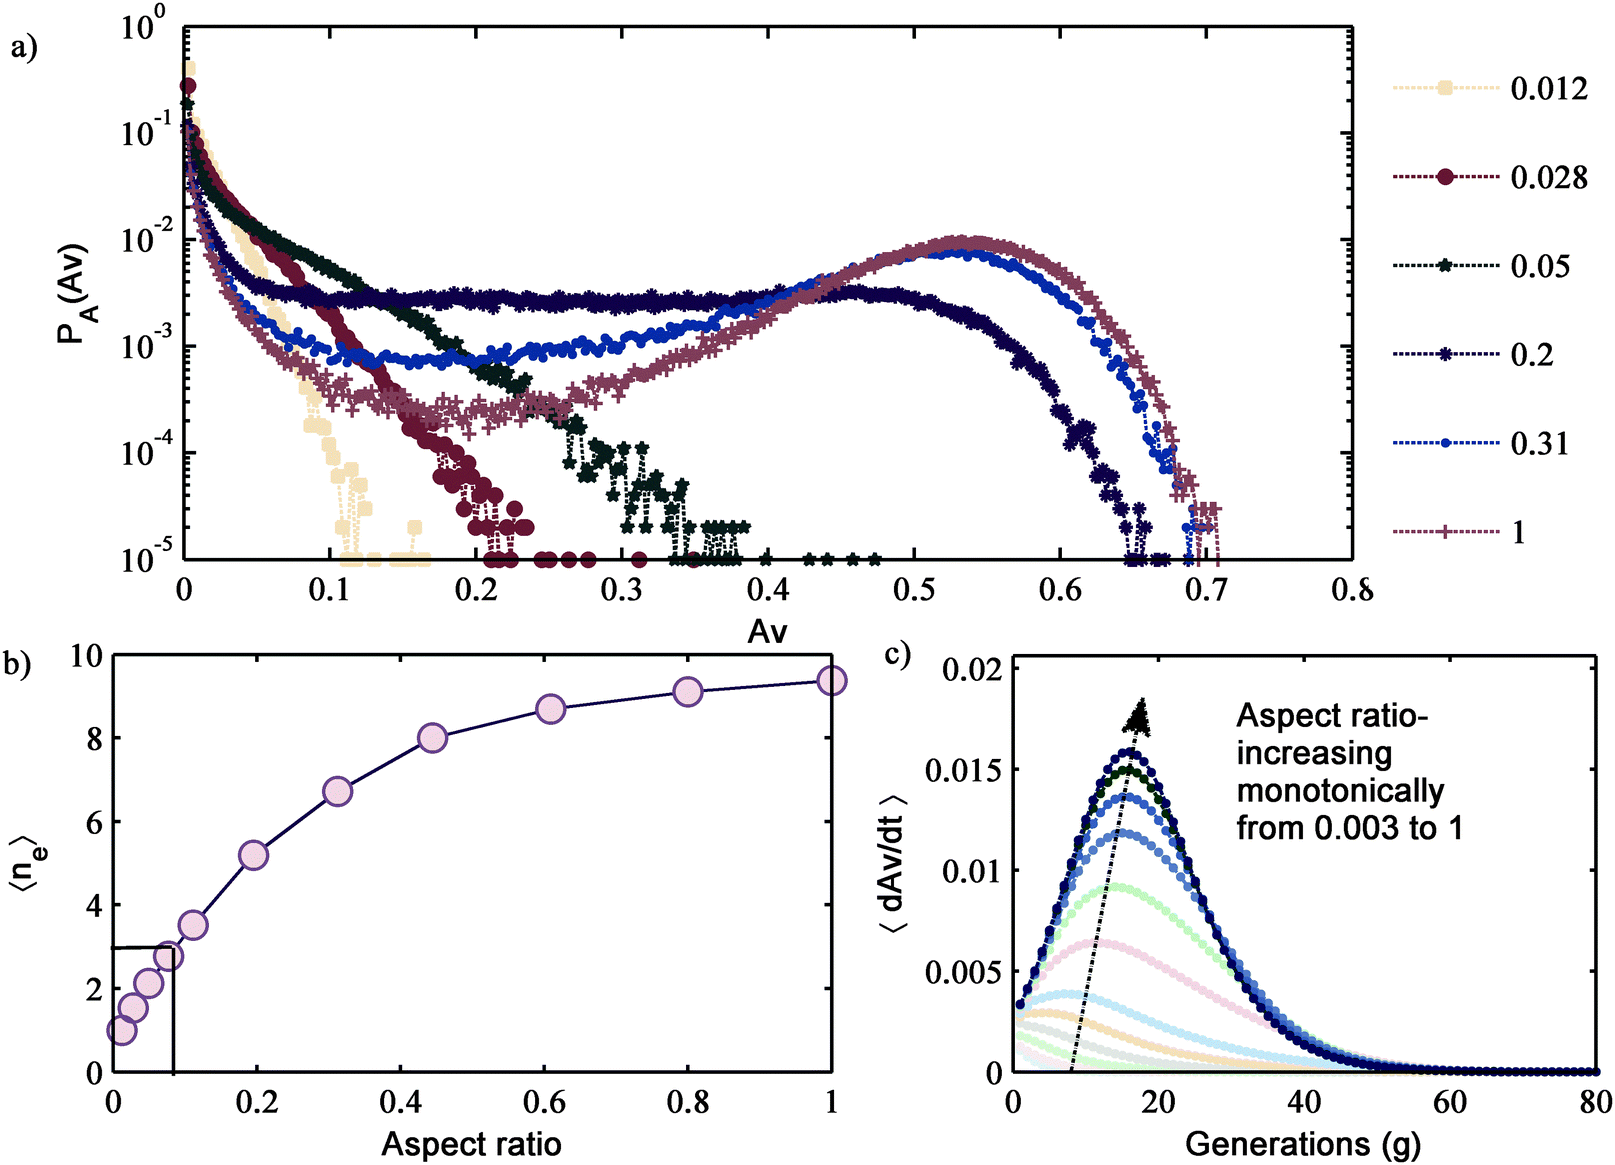 | ||
| Fig. 5 (a) Probability of occurrence of an avalanche as a function of the size Av (normalized with Avmax) of the avalanche for different aspect ratios of the drop assembly (total number of drops = 324 drops); (b) the weighted sum of neighbours 〈ne〉 as a function of aspect ratio (0.003–1); at aspect ratio ∼0.1, 〈ne〉 = 3; (c) average avalanche growth rate as a function of time in generations for different aspect ratios (arrow indicates the trend of the plot for monotonically increasing aspect ratios). | ||
Conclusion
A stochastic framework has been developed to study coalescence propagation in microchannels that employ a concentrated 2D emulsion. Our framework utilizes the probability data P(θ) experimentally measured by Bremond et al.19 – which explains the probability with which drops will coalesce locally – to study the system-level propagation. The stochastic simulations capture the inherent autocatalytic nature of the propagation process for large system size (N). This nature of propagation results in two likely scenarios: one where propagation is almost absent and the other where propagation can lead to destabilization of almost the entire drop assembly. This is in accordance with the observations of Bremond et al. in their experiments. It is interesting to see how a simple conceptual framework – which does not explicitly account for drop motion and anisotropic drop-packing in a microchannel – captures the avalanching process that leads to the destabilization of the assembly. We follow a simple weighted averaging procedure to compute the effective number of neighbours available for coalescence. We infer that the propagation is dominantly autocatalytic only if the number of average effective neighbours available for coalescence is greater than three. We find that a cosine functional form for the P(θ) based on the mechanism of propagation, which involves the decompression of drops, fits the data well. This suggests that the mechanism of the process has manifested itself in the probability data. The effect of fluid properties on the probability is captured by a continuation parameter α. We find that the propagation is autocatalytic only after a critical α, across which there is a sharp transition from stable to unstable behaviour. Also, for a given fluid system (constant α) we can estimate the critical size of the system beyond which the propagation will be autocatalytic. Understanding the propagation phenomenon can help in the design of microchannels. We find that the aspect ratio of the assembly of drops has an impact on the propagation dynamics: an aspect ratio far from unity reduces the average avalanche size thereby increasing the stability. Future studies in this area could be in generating further experimental support for the proposed approach, relating system properties to the constants in the probability function, enhancing the approach to understand the effect of poly-dispersity in drop sizes on propagation, and studying phase inversion using our simple framework.Acknowledgements
The authors would like to acknowledge Jason R. Picardo (IIT Madras) for the careful reading of the manuscript and critical comments; Ethayaraja Mani (IIT Madras) for motivating us to use stochastic algorithms; Christina Christopher, Mahesh Panchagnula and Srikanth Vedantam of IIT Madras, India, for the stimulating discussions. We would like to thank Nicholas Bremond (LCMD-ESPCI, France) for giving us the permission to use the data from his videos (Fig. 1a, 2a and b).Notes and references
- P. J. a. Janssen and P. D. Anderson, Macromol. Mater. Eng., 2011, 296, 238–248 CrossRef CAS.
- L. G. Leal, Phys. Fluids, 2004, 16, 1833 CrossRef CAS.
- H. Gu, M. H. G. Duits and F. Mugele, Int. J. Mol. Sci., 2011, 12, 2572–2597 CrossRef CAS PubMed.
- Y. Yoon, M. Borrell, C. C. Park and L. G. Leal, J. Fluid Mech., 2005, 525, 355–379 CrossRef CAS.
- J. W. Ha, Y. Yoon and L. G. Leal, Phys. Fluids, 2003, 15, 849 CrossRef CAS.
- J. Eggers, J. R. Lister and H. A. Stone, J. Fluid Mech., 1999, 401, 293–310 CrossRef CAS.
- M. Borrell, Y. Yoon and L. G. Leal, Phys. Fluids, 2004, 16, 3945–3954 CrossRef CAS.
- D. Chen, R. Cardinaels and P. Moldenaers, Langmuir, 2009, 25, 12885–12893 CrossRef CAS PubMed.
- I. U. Vakarelski, R. Manica, X. Tang, S. J. O’Shea, G. W. Stevens, F. Grieser, R. R. Dagastine and D. Y. C. Chan, Proc. Natl. Acad. Sci. U. S. A., 2010, 107, 11177–11182 CrossRef CAS PubMed.
- N. Bremond, A. R. Thiam and J. Bibette, Phys. Rev. Lett., 2008, 100, 024501 CrossRef PubMed.
- T. Krebs, K. Schroën and R. Boom, Soft Matter, 2012, 8, 10650 RSC.
- K. Wang, Y. Lu, L. Yang and G. Luo, AIChE J., 2013, 59, 643–649 CrossRef CAS.
- G. F. Christopher, J. Bergstein, N. B. End, M. Poon, C. Nguyen and S. L. Anna, Lab Chip, 2009, 9, 1102–1109 RSC.
- L. Mazutis and A. D. Griffiths, Lab Chip, 2012, 12, 1800 RSC.
- L. Mazutis, J.-C. Baret and A. D. Griffiths, Lab Chip, 2009, 9, 2665–2672 RSC.
- J. C. Baret, F. Kleinschmidt, A. E. Harrak and A. D. Griffiths, Langmuir, 2009, 25, 6088–6093 CrossRef CAS PubMed.
- D. Y. C. Chan, E. Klaseboer and R. Manica, Soft Matter, 2009, 6, 20 Search PubMed.
- K. B. Migler, Phys. Rev. Lett., 2001, 86, 1023–1026 CrossRef CAS PubMed.
- N. Bremond, H. Doméjean and J. Bibette, Phys. Rev. Lett., 2011, 106, 214502 CrossRef PubMed.
- G. W. Flake, The Computational Beauty of Nature: Computer Explorations of Fractals, Chaos, Complex Systems and Adaptation, The MIT Press, 1999 Search PubMed.
- T. Beatus, T. Tlusty and R. Bar-Ziv, Nat. Phys., 2006, 2, 743–748 Search PubMed.
- B. M. Jose and T. Cubaud, Microfluid. Nanofluid., 2012, 12, 687–696 CrossRef CAS.
- M. J. Fuerstman, P. Garstecki and G. M. Whitesides, Science, 2007, 315, 828–832 CrossRef CAS PubMed.
- M. Schindler and A. Ajdari, Phys. Rev. Lett., 2008, 100, 044501 CrossRef PubMed.
- T. Beatus, R. H. Bar-Ziv and T. Tlusty, Phys. Rep., 2012, 516, 103–145 CrossRef.
- N. Desreumaux, J. B. Caussin, R. Jeanneret, E. Lauga and D. Bartolo, Phys. Rev. Lett., 2013, 111, 118301 CrossRef PubMed.
- M. Danny Raj and R. Rengaswamy, Microfluid. Nanofluid., 2014, 17, 527–537 CrossRef CAS.
- D. Y. C. Chan, E. Klaseboer and R. Manica, Soft Matter, 2011, 7, 2235 RSC.
- A. Lai, N. Bremond and H. a. Stone, J. Fluid Mech., 2009, 632, 97 CrossRef.
- H. Ritacco, F. Kiefer and D. Langevin, Phys. Rev. Lett., 2007, 98, 244501 CrossRef PubMed.
| This journal is © The Royal Society of Chemistry 2016 |