
Clogging of granular materials in silos: effect of gravity and outlet size†
Roberto
Arévalo
*a and
Iker
Zuriguel
 b
b
aDivision of Physics and Applied Physics, School of Physical and Mathematical Sciences, Nanyang Technological University, 25 Nanyang Link, 637371, Singapore. E-mail: aroberto@ntu.edu.sg
bDepartamento de Física, Facultad de Ciencias, Universidad de Navarra, 31080 Pamplona, Spain
First published on 21st September 2015
Abstract
By means of extensive numerical simulations we disclose the role of the driving force in the clogging of inert particles passing through a constriction. We uncover the effect of gravity and outlet size on the flow rate and kinetic energy within the system, and use these quantities to deepen our understanding of the blocking process. First, we confirm the existence of a finite avalanche size when the driving force tends to zero. The magnitude of this limit avalanche size grows with the outlet size, as expected due to geometrical reasons. In addition, there is an augment of the avalanche size when the driving force is increased, an effect that is enhanced by the outlet size. This phenomenology is explained by assuming that in order to get a stable clog developed, two conditions must be fulfilled: (1) an arch spanning the outlet size should be formed; (2) the arch should resist until the complete dissipation of the kinetic energy within the system. From these assumptions, we are able to obtain the probability that an arch gets destabilized, which is shown to primarily depend on the square root of the kinetic energy. A minor additional dependence of the outlet size is also observed which is explained in the light of recent results of the arch resistance in vibrated silos.
1 Introduction
The flow and transport of particulate materials still pose a considerable challenge to our scientific understanding. While the diluted regime is well described in terms of kinetic theory, dense flow is still far from a complete comprehension. Theoretical modeling seems to be divided between continuous theories preferred in the analytical approach (see, e.g., ref. 1 and 2) and the discrete approach which constitutes the basis of most numerical models. In this conundrum, clogging emerges as a conspicuous feature of particulate materials, which clearly separates them from fluids. Clogging occurs when the flow of particles is suddenly arrested by the development of a stable structure (generically, an arch) that obstructs the channel. It is usually observed in bottlenecks of width similar to the size of the particles. The concurring causes range from friction among particles and channel walls to geometrical frustration. The phenomenon is truly universal3 and has been reported in systems as diverse as a suspension of microparticles passing through a bottleneck,4,5 electrons on the surface of liquid helium passing through nanoconstrictions,6,7 vortex matter in type II superconductors8–10 and clogs of humans and other animals flowing through narrow doors.3 There are numerous examples in the engineering literature.11 Closely related is depinning,12,13 in which a system of particles experiences a transition from arrested to flow states under an applied force. Surely, in this wide range of systems, differences will be found in the details of the behavior. The law governing the flow of particles, for example, may depend on the nature of their interactions, the source of driving or the presence of an interstitial medium (like air in a silo).A paradigmatic and widely studied example of the system undergoing clogging is a silo, see Fig. 1. This is a deposit of particles that is discharged by gravity through an orifice at its base. If the orifice is bigger than several times the typical size of the particles, a steady flow develops. In this case, the flow is given by the Beverloo expression14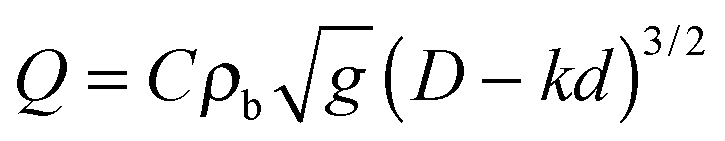 , in the two-dimensional case. Here Q is the flow in the number of particles per unit time, C is a dimensionless constant related to the properties of the flowing material, ρb is the bulk density, g is the acceleration of gravity, D is the size of the aperture, d the diameter of the grains, and k is a geometric factor usually related to the effective outlet for finite sized flowing particles. This empirical expression is valid for a small span of D values and has been recently reformulated in order to give physical meaning to the different constants introduced.15
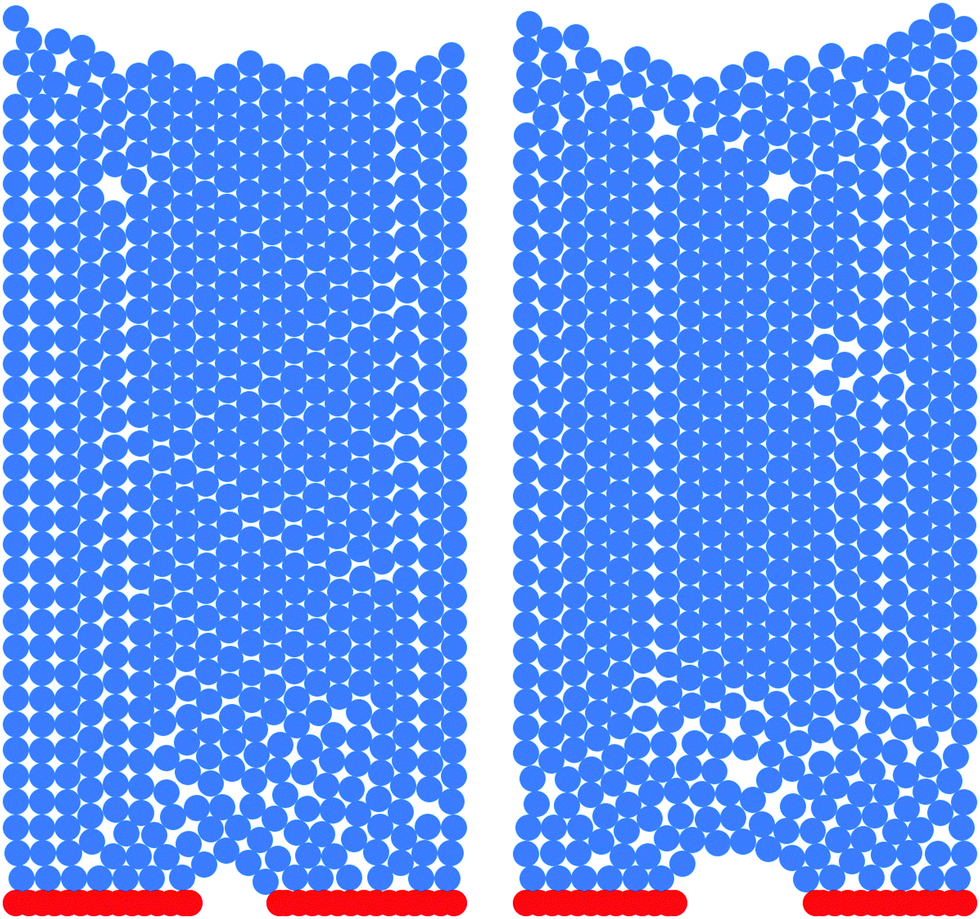 | ||
| Fig. 1 Example of clogging in two of the simulated silos. Left, the aperture size is D = 2.5, right is D = 4.5. | ||
For outlet sizes only a few times bigger than the particles, clogs might develop: the larger the aperture, the less frequently the arches appear, so for very big orifices clogging is not observed on accesible time scales. A convenient way to study clogging is to define the avalanche size s as the number of particles that flow from the arch destruction until the development of a stable clog. The distribution function is conspicuously found to be an exponential (this also holds for other systems undergoing clogging) and can be explained assuming a constant probability of clogging during the whole avalanche duration.16 In that scenario, if p is defined as the probability that a particle passes through the outlet without forming a clog, the distribution function is given by
| n(s) = ps(1 − p) | (1) |
The first moment of the distribution (the average avalanche size 〈s〉) can then be used to analyze the effect of changing several parameters. Among them, the role of the aperture size has been most extensively studied. Current experimental data are compatible with two very different interpretations. On the one hand, it is proposed that there exists a power law divergence at a certain critical aperture size;17–19 On the other hand, experimental results have been found to be compatible with exponential laws18,20,21 with no critical transition. Undoubtedly, a better understanding of the arching formation process is necessary to settle the dependence of the avalanche size with the aperture.
In this sense, while the role of the orifice size is being thoroughly investigated, that of the driving force − gravity in this case − has received much less attention. Regarding the flow rate, dimensional analysis suggests a square root dependence on gravity, whose physical origin is usually attributed to the particles falling freely from an approximately circular region above the orifice. However, the nature of this so-called “free fall arch” has not been disentangled until very recently.22 Experimentally, the flow rate dependence on the square root of gravity has been verified in a range that goes up to 20 times Earth's acceleration of gravity, using a centrifuge in the continuous flow regime (i.e. large outlet sizes).23
So far, there are no experimental measurements on the role of driving force in the clogging process. In a previous work24 simulations were used to change parameter g over four orders of magnitude in the clogging regime (for a small outlet size). As expected, the flow measured between clogs was found to depend on  . Surprisingly, it was also reported that the average avalanche size tends to a finite value when the driving force tends to zero. In the present work we extend and generalize our previous results by carrying out a thorough investigation of the effect of both, the aperture size and driving force, which allows us to unveil the different roles that these variables play in the silo clogging process.
2 Simulations
In this work, we report numerical simulations of the discharge of inert grains from a silo by gravity.24 We implemented 6 different outlet sizes in the range of 2.5−5.0 times the diameter of the particles, hence observing development of clogs in all cases.16,18,19,25–29 The avalanche size and flow properties are measured for 10 different values of g in a range spanning four orders of magnitude.We use soft-particle molecular dynamics simulations of monosized disks in two dimensions. The restoring force in the normal direction of collision depends linearly on the overlap of particles ξ = d − rij, with stiffness kn = 105 (mg/d), where d = 1 mm is the particle diameter, m = 1 is the mass and rij the distance between the centers of the particles. Additionally, there is a dissipative force proportional to the relative normal velocity of the colliding grains, with damping parameter  . We implement static friction placing a spring in the direction tangential to the normal joining the centers of the particles.30 The elongation of this spring is obtained by integrating the relative velocity of the surfaces in contact. The parameters are kt = (2/7)kn and
  . The friction coefficient is set to μ = 0.5, and gravity to Γ times the value of g.
The simulation protocol is as follows. A flat-bottomed rectangular silo of 18d width is filled with 35 layers of grains which fall freely from a height much larger than their size. The side-walls of the container are smooth, while the base is formed by fixed grains at mutual distances of 0.5d. Once the grains in the silo come to a rest, a hole is opened at the center of the base and the particles start to flow. The time at which each particle passes through the orifice is registered and these grains are relocated at the top of the silo in order to keep a constant height of the granular layer. A clog is detected when the kinetic energy of the system falls to the initial value before opening the hole (the difference amounts to several orders of magnitude) and remains the same for 20![[thin space (1/6-em)]](https://www.rsc.org/images/entities/char_2009.gif) 000 time steps. Then, the avalanche size (measured in number of particles) and duration are registered, so from these data we can also obtain the flow rate. The flow is resumed by removing three of the grains conforming the blocking arch. To help visualizing our system a movie of the flowing grains for low and high driving forces is provided as in the ESI.†
000 time steps. Then, the avalanche size (measured in number of particles) and duration are registered, so from these data we can also obtain the flow rate. The flow is resumed by removing three of the grains conforming the blocking arch. To help visualizing our system a movie of the flowing grains for low and high driving forces is provided as in the ESI.†
Several series of experiments (consisting of at least 1000 avalanches each) have been performed for different values of Γ. In order to optimize the computation time, we use a primary integration step  for simulations with Γ ≃ 1. For Γ ≃ 3 the integration step is reduced to δ/3, and for simulations at Γ ≃ 6 and Γ ≃ 10 we use a step of δ/6. For simulations at Γ ≃ 10−3 we increase the time step to 10δ.
In the remainder of the paper we will use D as the adimensional size of the orifice and will express flow Q in particles per second, and the kinetic energy in mm2 s−2 given that the mass of all particles is 1.
3 Avalanche size
We start by presenting the effect of the driving force on the avalanche size for all the outlets studied (Fig. 2). Interestingly, the fairly linear trend observed in the semilogarithmic scale suggests an exponential dependence 〈s〉 ∝ eΓ0.5. In our previous work24 we suggested a linear relationship. This was due to the use of a small orifice for which the variation in the avalanche size was only 50% and was well fitted by linear approximation. Our new data, with larger outlets that lead to a variation in 〈s〉 of around a decade, allow us to accurately describe the exact correlation. Furthermore, we confirm the unexpected finding that as the driving force vanishes, the mean avalanche size tends to a finite value: 〈s0〉. This means that no matter how slowly the particles move, there is always an initial flow before the silo eventually clogs. It is natural to think of the limiting 〈s0〉 as a geometrical characteristic of the problem. One can in principle rule out the effect of the silo width, since the walls are known not to play a crucial role in clogging, then the only geometrical quantity left is the aperture size (D).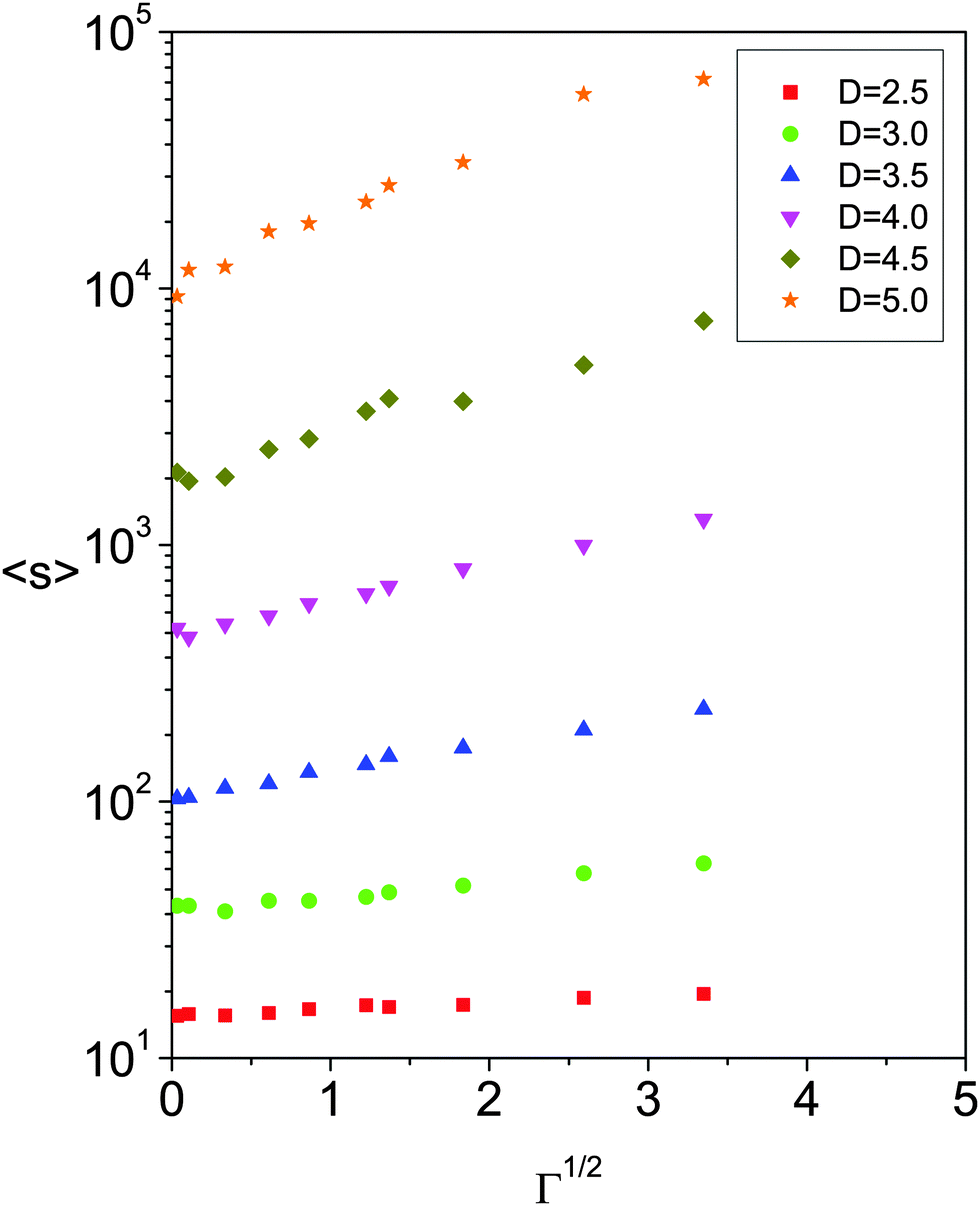 | ||
| Fig. 2 Average avalanche size (in logarithmic scale) versus Γ0.5 for six different outlet sizes as indicated in the legend. | ||
From the results reported in Fig. 2 it also becomes clear that the driving force has the same qualitative effect for all the outlet sizes, but there are some quantitative differences. The first one is related to the limit avalanche 〈s0〉 which increases with the outlet size. Moreover, the slope of the curves also notably increases with D. These results can be understood in the following manner: when Γ → 0 the discharge process becomes extremely slow, since the flow rate also tends to zero, so the kinetic energy within the system becomes very small. In such a situation any arch that is formed covering the whole outlet is expected to clog it as it could be hardly destabilized. On the other hand, as Γ increases the flow rate increases and some of the clogging arches are unable to resist the impacts of the particles above them. Hence, one can think of 〈s0〉 as a parameter that gives information about the number of geometric configurations that clog the outlet21 without considering possible destabilization; while the slope of log〈s〉 as a function of Γ0.5 would be related to the dynamics of the problem.
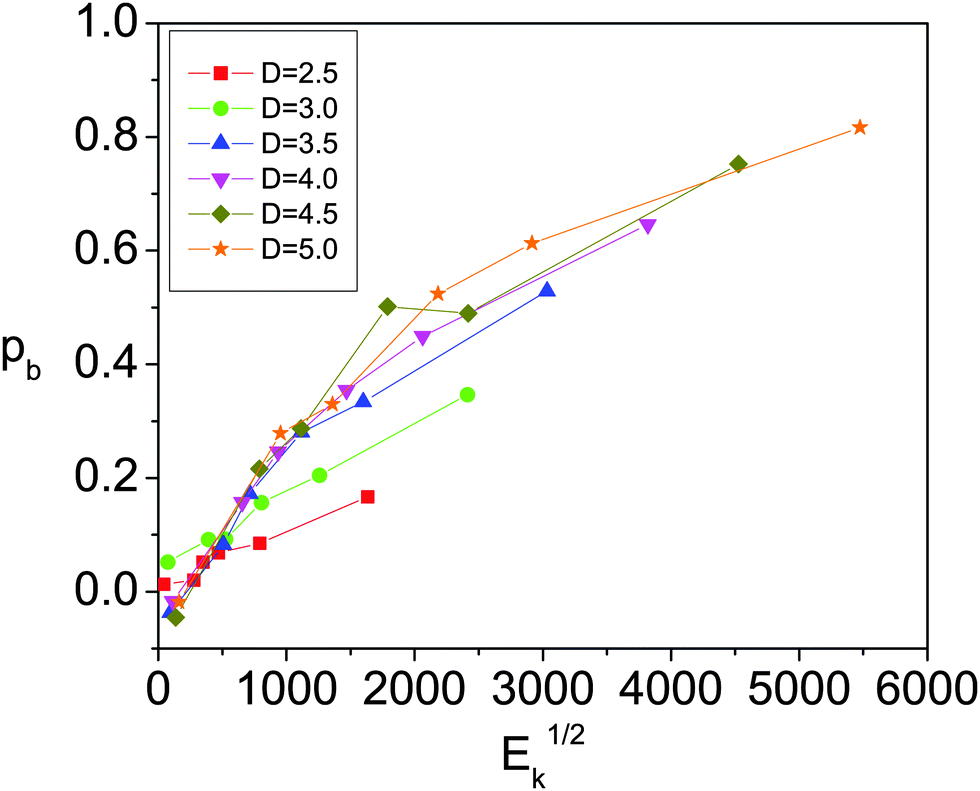
Since we can measure the flow directly in our simulations, we display the same data compared to that in Fig. 2 but with respect to Q, as in Fig. 3. Interestingly, the flow rate dependence on D14,15 leads to a scenario where the slopes of all curves become similar. This is confirmed by representing the rescaled avalanche size 〈s〉/〈s0〉 versus the flow rate (Fig. 4a). At first order, all the curves seem to collapse in a single one suggesting that the destabilization process is intimately related to the flow rate (which in turn depends on Γ and D). The origin of this behavior can be understood by taking into account the dependence of the rescaled avalanche size on the square root of the kinetic energy within the system (Ek) as in Fig. 4b. Both Fig. 4a and b look very similar with a slightly larger dispersion of the data when using kinetic energy as the independent variable. The reason for this similarity is justified by the relationship Ek ∝ Q2 shown in Fig. 4c and justified in the next section.
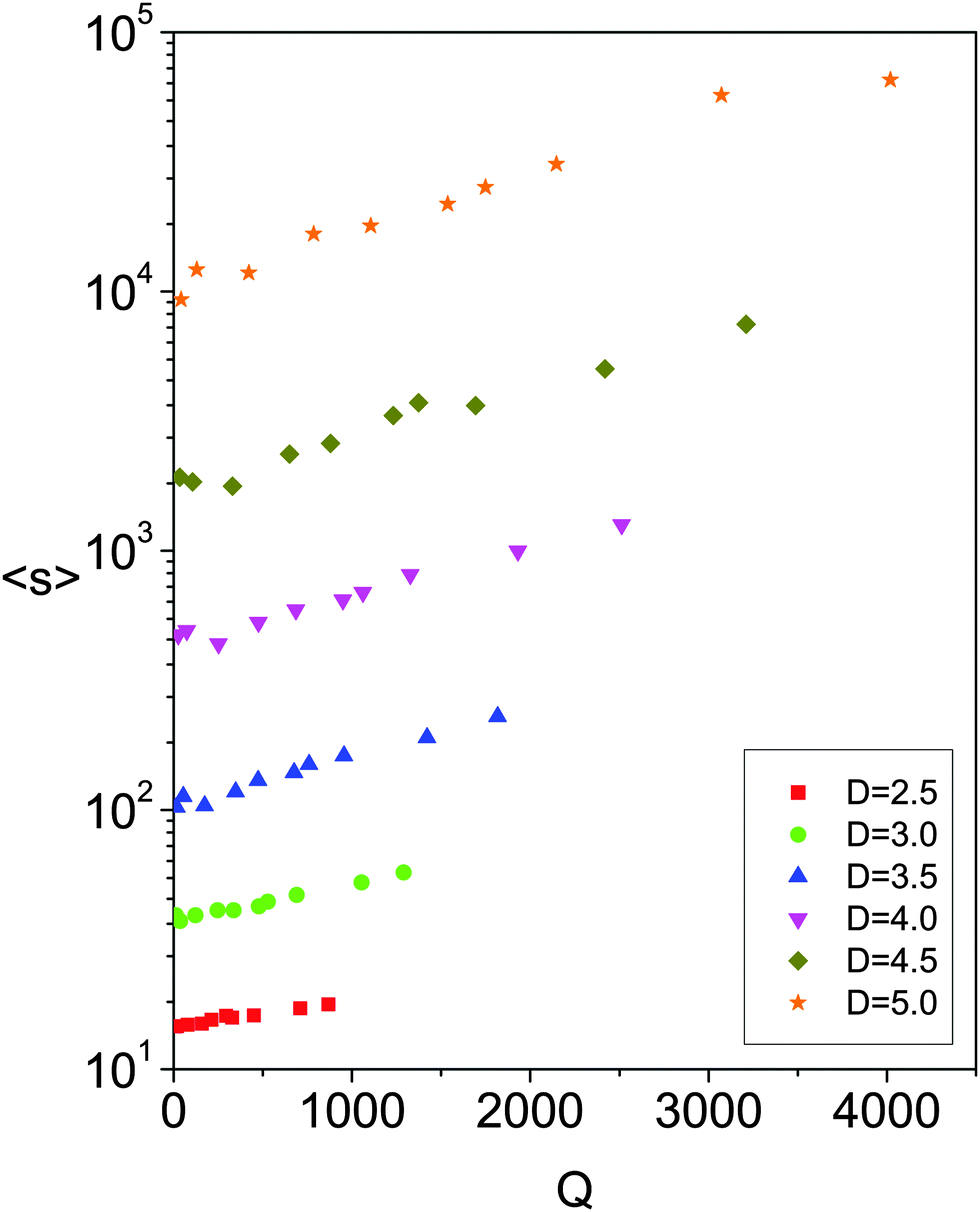 | ||
| Fig. 3 Average avalanche size in logarithmic scale as a function of the flow rate for different outlet sizes as indicated in the legend. | ||
 | ||
| Fig. 4 (a) Normalized average avalanche size as a function of the flow, for different outlet sizes as shown in the legend. The average is normalized by the limit value of the avalanche when Γ → 0 obtained from fitting the data of Fig. 3. (b) Same results but with respect to the square root of the kinetic energy in the system. (c) Total kinetic energy inside the silo as a function of the flow rate for different values of Γ. Each symbol refers to a value of D as shown in the legend of (a). | ||
Our result in Fig. 4a implies that the avalanche size obeys a scaling form:
| 〈s(Γ,D)〉 = 〈s0〉g(Q(Γ,D)). | (2) |
According to the Beverloo law,14 the combination Q(Γ,D) is given (modulo a constant) by the product Q* = ΓαDβ, with α = 1/2 and β = 3/2 in a two dimensional silo. We can test the values of the exponents by plotting 〈s(Γ,D)〉/〈s0〉 versus ΓαDβ and looking for the values of α and β that give the best collapse. Since a visual assessment is not satisfactory we implement the following quantitative protocol. First, for each value of α and β we divide the range of Q* in vertical bins. For each bin we compute the difference along the vertical axis of all the pairs of values 〈s(Γ,D)〉/〈s0〉, and we take the average, since each bin has a different number of points. We subsequently average over bins, therefore the values of α and β that minimize these differences are the ones that give the best collapse. The results are shown in Fig. 5. Fig. 5a is obtained by setting α = 1/2 and sweeping several values of β. Now, since the best collapse seems to be obtained for β = 1.55, in Fig. 5b we compare the result obtained for different α using the best value for β, as well as β = 3/2, the expected value.14 Both results are very similar, and compatible with α = 0.5. Given that the possible correction for β (around 3%) falls below the uncertainties in our measurements, we can say that the result is compatible with the Beverloo scaling.
 | ||
| Fig. 5 Average sum of the differences along the vertical axis of the pairs of points 〈s(Γ,D)〉/〈s0〉. Top, differences as a function of the exponent β in Q* = ΓαDβ for α = 0.5. Bottom, differences as a function of the exponent α for β = 1.5 and β = 1.55 as indicated in legend. | ||
One could perform a similar analysis as in Fig. 4b, plotting against Ekγ, instead of the actual measured kinetic energy, and looking for the exponent that gives the best collapse. In this case, however, we do not obtain a minimum in the differences of 〈s〉/〈s0〉 values. Thus, although the avalanche size roughly increases with the kinetic energy of the whole system, another variable is needed to account for the precise behavior. An alternative possibility is that 〈s〉/〈s0〉 does not scale with the kinetic energy of the whole system, but with that of the particles close to the exit. Effectively, an arch forms; since grains are not rigid they do not come to rest at the same time. Those on top of the silo could still move downwards while the clog propagates upwards through the system, for example, in the form of a pressure wave. This possibility is interesting and could be investigated, but entails the difficulty of defining the region close to the outlet that should be relevant.
In summary, from these findings we can conclude that, for a given outlet size, the increase of the avalanche size with the driving force is correlated with the augmentation of the flow rate (or the kinetic energy within the system). In addition, the enhancement of the avalanche size with respect to the limiting case Γ → 0 seems to be rather independent of the kinetic energy for the different outlets studied. Notwithstanding, it must be remarked that when both, Fig. 4a and b, are thoroughly examined an increase of the slope with the size of the aperture can be observed indicating a more complex dependence on this variable.
We turn now to the explicit dependence of the avalanche size on the aperture size (Fig. 6). All curves display the same qualitative behavior and can be fitted by  which is in agreement with the experimental results.18,21 Note that D2 is roughly proportional to the number of particles in the vicinity of the outlet. The fitting parameters depend on the driving force as reported in Fig. 7. The uncertainties in the parameters are 5–10% for the prefactor and around 2% for the characteristic distance. Interestingly, the same expression holds for the curve of
  (continuous line in Fig. 6), with p1 = 1.45 and p2 = 0.358, the fitting uncertainties are 10% and 2%, respectively. Finally, this figure shows that the outlet size is the main determinant of clogging, with the driving force playing a second order effect. Indeed, the role of the driving force is enhanced as the outlet size is increased (the separation of the data from the 〈s0〉 curve increases with D) as it has already been mentioned in reference to Fig. 2.
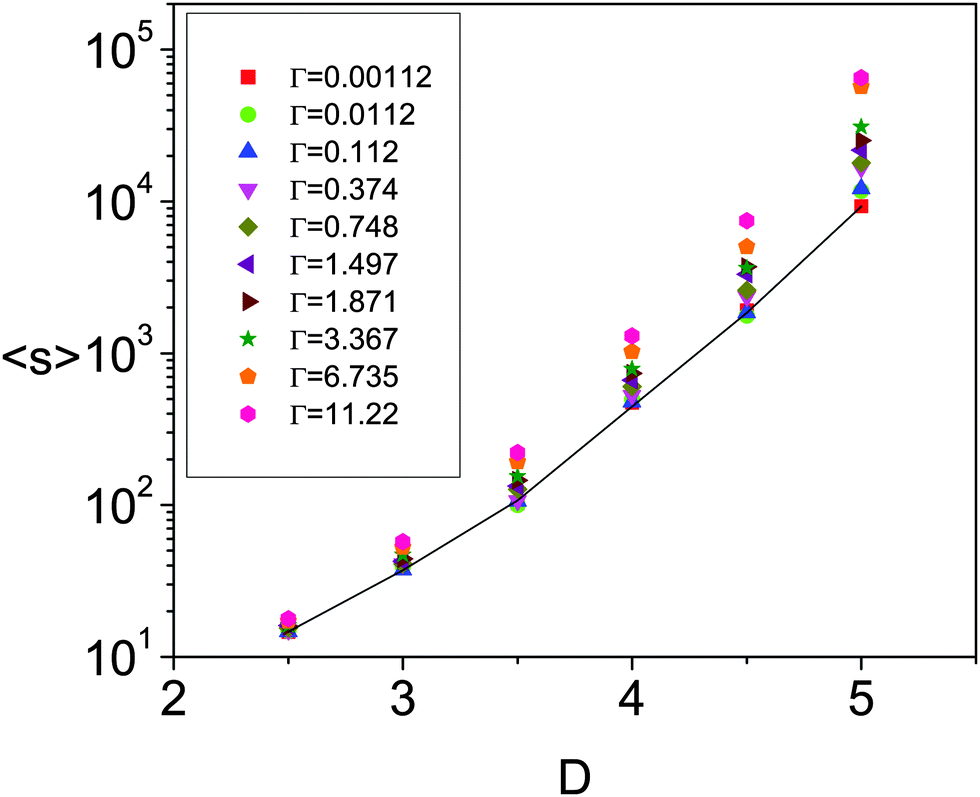 | ||
Fig. 6 Semilogarithmic plot of the average avalanche size as a function of the aperture size (D) for all values of Γ. The continuous line indicates the limit of 〈s0〉 (〈s〉 for Γ → 0) obtained for each D. It has the same functional dependence than the full avalanche size,  . . | ||
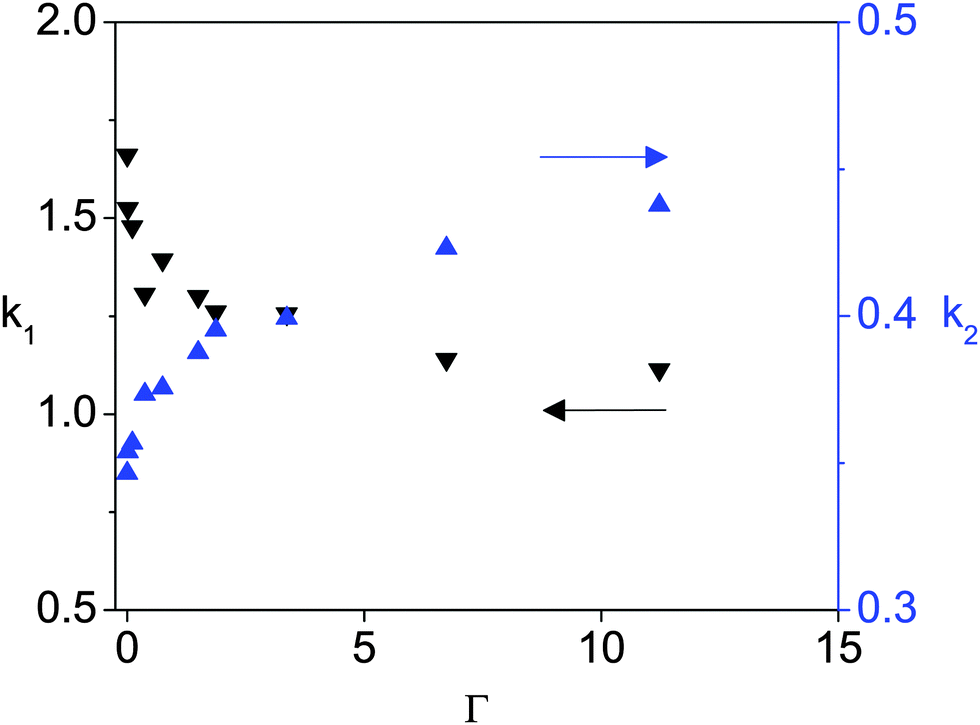 | ||
Fig. 7 Fitting parameters of the data in Fig. 6 to the expression 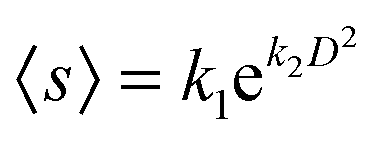 for different values of Γ. for different values of Γ. | ||
In order to clarify the roles played by the outlet size and driving force in the clogging process, we have extended the model derived in ref. 16 and explained it in the introduction to justify eqn (1). The idea is to assume that, in order to have a permanent clog in the system, two conditions should be fulfilled: (i) an arch should be formed spanning the length of the outlet; (ii) the arch should resist the collisions of particles coming from above until all the energy within the system is dissipated.
We first define p0(D,Γ → 0) as the probability that, for the limit case of Γ → 0, a particle passes through the orifice without forming a blocking arch with its neighbors. Then we introduce a new parameter pb(D,Γ), which measures the probability that an orifice spanning arch (which could potentially cause a clog) collapses before all the kinetic energy in the system is dissipated. To be consistent and to facilitate calculations, pb(D,Γ) is the probability measured per particle in the system; in other words, it is the probability that a particle passes through the outlet due to the destabilization of arches.
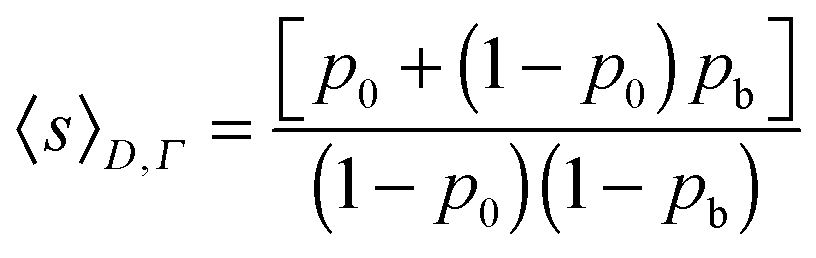
By assuming that p0(D,Γ → 0) is purely governed by geometrical effects and no destabilization is possible in this limit case, and that the events associated with the probabilities p0 and pb are independent, we can deduce an expression for the probability of observing an avalanche of size s which necessarily ends with a stable clog of probability (1 − p0)(1 − pb). The expression for ns was already obtained for the case of vibrated silos31 where a similar argument was used to understand the destabilization process:
| ns(D,Γ) = (1 − p0)(1 − pb)[p0 + (1 − p0)pb]s | (3) |
 | (4) |
Thus, from eqn (4), pb can be calculated for any value of Γ by using the following equation that considers 〈s〉D,Γ and 〈s0〉 (which is indeed 〈s〉D,Γ→0) for each outlet size:31
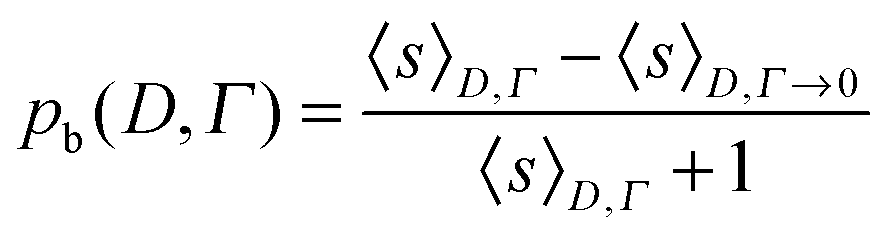 | (5) |
The results are displayed in Fig. 8 and show that the larger the Γ, the higher the probability that an arch becomes destabilized; an effect that is enhanced as the outlet size increases. These outcomes are appealing since in the hypothetical case of pb reaching a value of one, this would imply the impossibility of obtaining a stable clog. Actually, in this situation clogs could be formed but they would be unable to resist until all the energy within the system is dissipated.
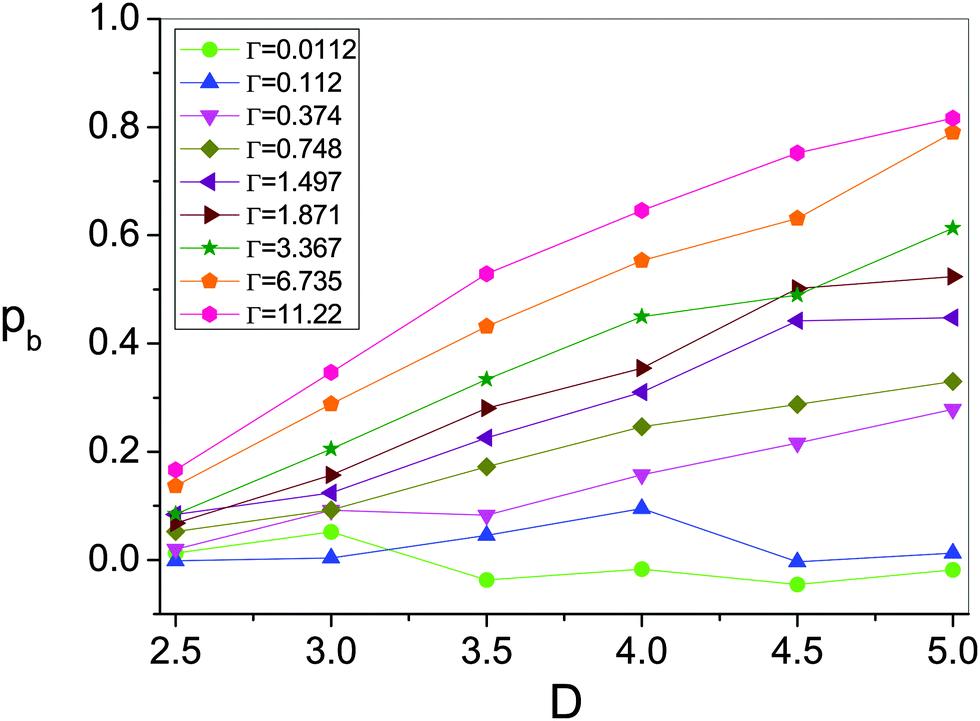 | ||
| Fig. 8 Probability that an arch is destabilized versus the outlet size for different values of Γ as shown in the legend. | ||
In Fig. 9 we try to collapse all the results of pb using the kinetic energy within the system. The curves become rather similar but with a noticeable effect associated with the outlet size: for the same kinetic energy in the system, the larger the outlet size, the more likely the probability that an arch becomes destabilized. This relationship between the arch length and its fragility is known from experiments of vibrated silos.32
 | ||
| Fig. 9 Probability that an arch is destabilized versus the total kinetic energy inside the silo for different values of D as shown in the legend. | ||
In summary, by performing extensive numerical simulations of the silo clogging phenomenon, we have been able to shed light on the different roles that the driving force and the outlet size play in the process. We assume that in order to get a permanently stable clog, two conditions must be fulfilled, i.e., arch formation and arch resistance until all the kinetic energy in the system is dissipated. Arch formation would be a primary geometrical problem mainly ruled by the ratio between the outlet and the particle sizes. The geometrical nature of clogging is twofold: (i) the larger the outlet, the more difficult to find a geometrical structure among those developed spontaneously that clogs it. (ii) The larger the arch, the weaker it is. Arch destabilization, however, would be affected by the amount of kinetic energy that must be dissipated after arch formation. This is determined by both the outlet size and the driving force.
4 Flow rate and kinetic energy within the system
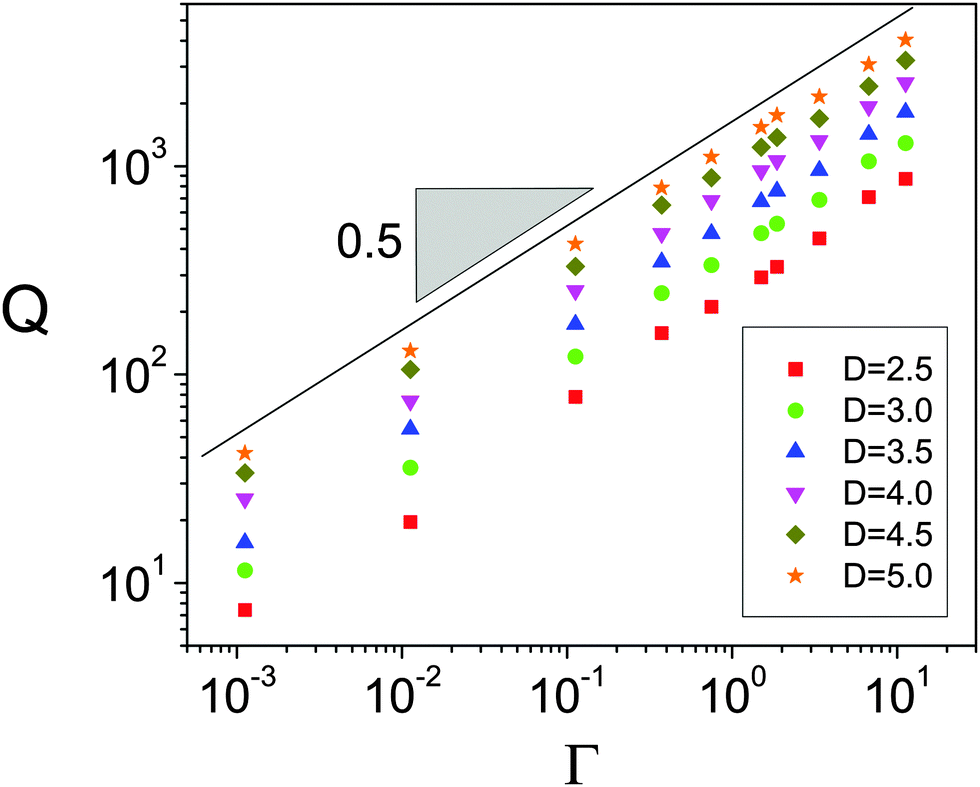
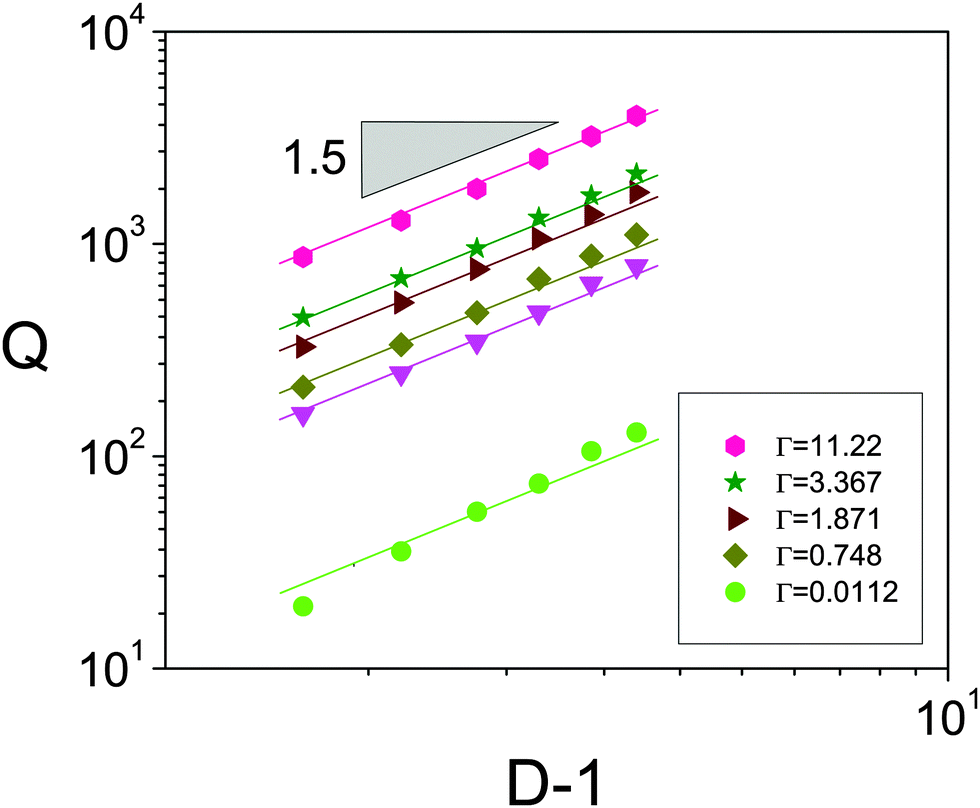
In the previous section we showed that the kinetic energy scales with the square of the flow rate Ek ∝ Q2 (Fig. 4c). This was the underlying reason given to justify the similar trends observed when representing 〈s〉/〈s0〉 versus Q (Fig. 4a), and versus Ek1/2 (Fig. 4b). To our knowledge, this is the first time that this relationship between the flow rate and the total kinetic energy in the silo has been reported, so we will try to provide an explanation. To this end, we have measured the dependence of both Q and Ek on the variables explored in this problem, i.e. the driving force Γ and the outlet size D.In Fig. 10 the flow rate is shown to scale with Γ0.5 as already predicted14 and evidenced, both numerically24 and experimentally.23 This scaling is valid for the whole range of outlet sizes implemented and its origin has been recently clarified.22 In the silo, there is a region above the orifice where the kinetic stress is maximum. Below this region, particles start to increase their acceleration, reaching g only at the very orifice. Despite this picture does not match the traditional view of the free fall arch below which particles fall freely under gravity, it was found that the scaling of the velocity with  holds at the outlet. The flow rate therefore scales as (D − 1)3/2, as shown in Fig. 11, because D − 1 is the effective section through which particles flow. The same fundamental scaling of the velocity with Γ naturally explains the linear dependence of the kinetic energy on this variable as shown in Fig. 12. Finally, the scaling Ek ∝ (D − 1)3 reported in Fig. 13 can be explained considering the dependence of the velocity fields of the particles at the outlet with D reported in ref. 15. In that work, a collapse of the velocity profiles was found when rescaling on the one hand the vertical velocity with the maximum at the center of the orifice (vc) and, on the other hand, the horizontal coordinate with D. In addition, vc was experimentally proved to scale with D0.5 giving rise to the global dependence of the velocity on D3/2 that agrees with the scaling Ek ∝ (D − 1)3.
 | ||
| Fig. 10 Logarithmic plot of the average flow rate as a function of the driving force for all the orifices studied as indicated in the legend. | ||
 | ||
| Fig. 11 Logarithmic plot of the average flow rate as a function of D − 1 for different driving forces as indicated in the legend. | ||
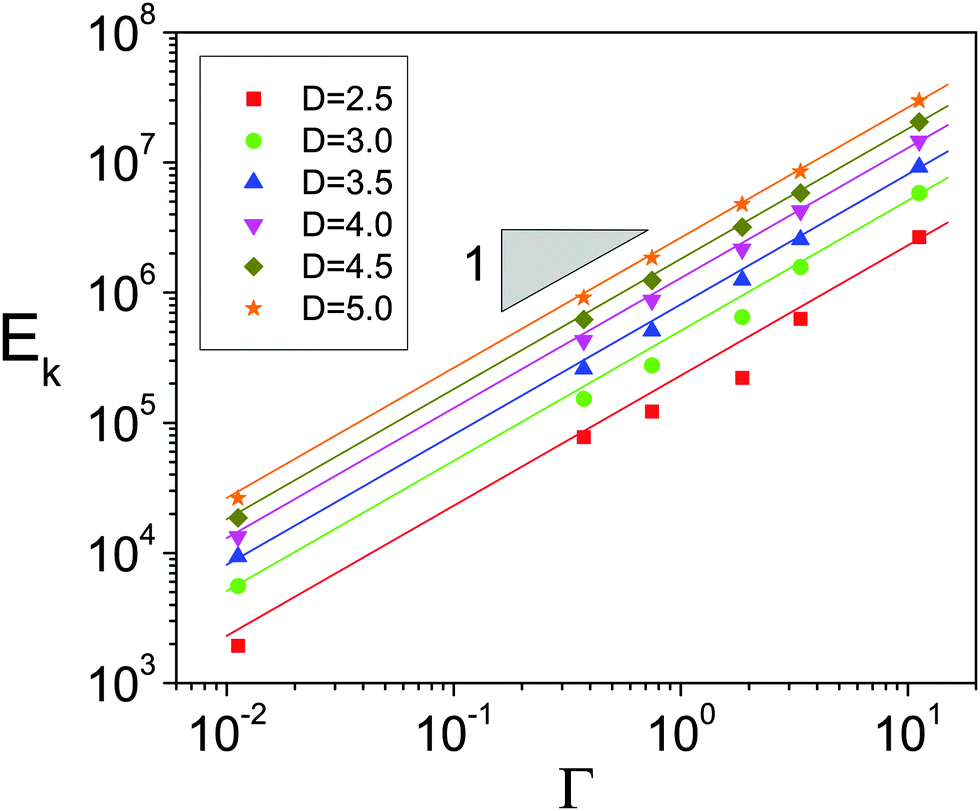 | ||
| Fig. 12 Logarithmic plot of the kinetic energy in the system as a function of the driving force for all the orifices studied as indicated in the legend. | ||
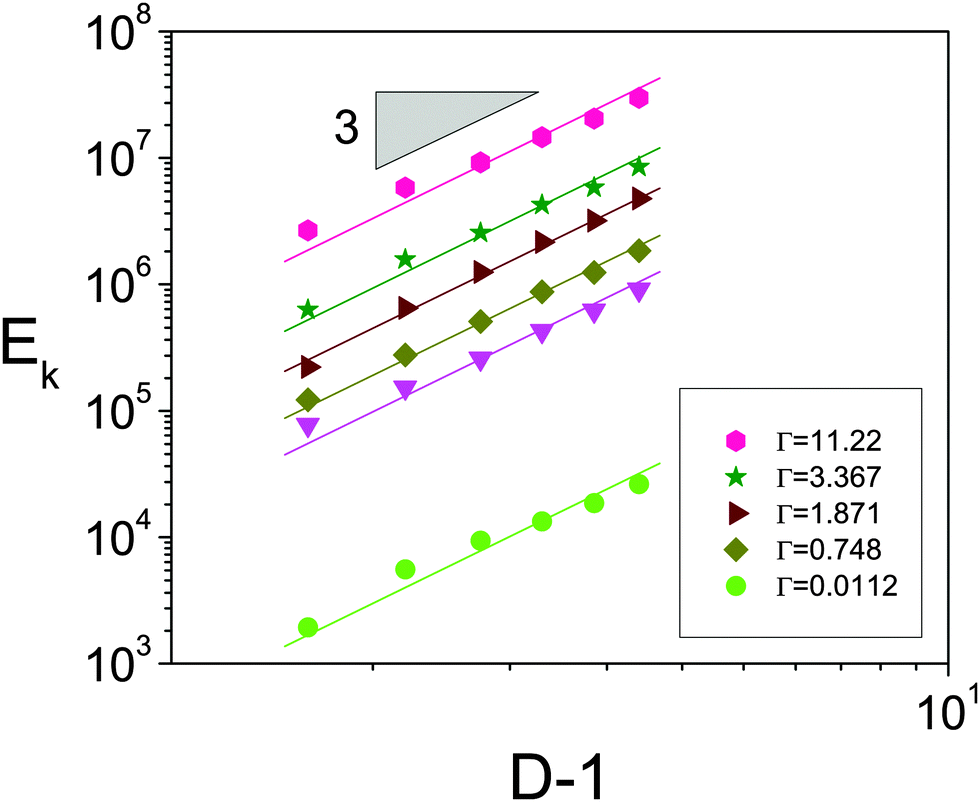 | ||
| Fig. 13 Logarithmic plot of the kinetic energy in the system as a function of D − 1 for different driving forces as indicated in the legend. | ||
5 Conclusions and discussion
In this work, we have reported the results of a systematic study on the effect of the driving force in the passage of inert grains through bottlenecks of different sizes. We obtained the expected dependence of the flow rate on the square root of gravity (Q ∝ Γ0.5) which is known to be caused by the fact that Γ sets the scaling of the velocity of the particles at the very outlet. This in turn explains the proportionality between the kinetic energy within the system and gravity Ek ∝ Γ. Furthermore, we recovered the Beverloo relationship between the flow rate and the outlet size for two-dimensional silos (Q ∝ (D − 1)3/2) which is valid for all gravity values. Finally, we observed the dependence of the kinetic energy within the system on the outlet size Ek ∝ (D − 1)3 that in connection with the previous scalings between Ek, Q, Γ and D allows us to explain the proportionality: Ek ∝ Q2.Concerning clogging, the first conclusion that can be deduced is that gravity does not play a crucial role in its development. And this is so, even when gravity notably affects the flow rate as explained above. As an example, in a silo with an orifice 3 times larger than the particles, the average avalanche size in Jupiter (24.79 m s−2 gravity) will be of around 70 particles, whereas in Ceres (a dwarf planet with a gravity of 0.27 m s−2) it will just decrease to around 40. Remarkably, the duration of the avalanche would be completely different (0.08 s in Jupiter and 0.77 s in Ceres as a consequence of the very important effect that gravity has on the flow rate).
Our findings evidence that the ratio between the outlet and particle size is the most important variable determining clogging. The primary role of the outlet size is imposing a geometrical condition for the clogging arches: their span should be larger than the orifice.21,25 This is related to the limit avalanche (s0) obtained for each outlet size when Γ → 0, a situation in which the dynamical effects are – in principle – minimized. As expected, this limit avalanche size increases with the size of the outlet as it decreases the number of structures spanning it. The second role of the outlet size is related to its effect in determining the velocity of particles at the outlet and then their kinetic energy. Taking the scenario of Γ → 0 as a reference, we show that increasing the kinetic energy within the system (by either increasing Γ or D) results in an increase of the avalanche size. This phenomenon is attributed to a possible arch destabilization which could take place from the moment of arch formation until all the kinetic energy within the system is dissipated. The fact that the increase of the avalanche size scales with the square root of the kinetic energy is in line with this idea. Indeed, in a recent work a timescale τ ∝ Γ−1/2 was also found in the penetration dynamics of intruders in a granular medium under different gravities as in ref. 33. The final role of the outlet size seems to be related to the stability of arches. We found that for a given value of kinetic energy within the system, the larger the outlet size, the more likely that an arch becomes destabilized. This result is in good agreement with the reduction of arch stability found in vibrated silos when the outlet size is increased.32
Acknowledgements
This work was partially funded by: Ministerio de Economía y Competitividad (Spanish Government) through FIS2011-26675 and FIS2014-57325 projects.References
- P. Jop, Y. Forterre and O. Pouliquen, Nature, 2006, 441, 727–730 CrossRef CAS PubMed.
- Y. Jiang and M. Liu, Acta Mech., 2014, 225, 2363 CrossRef.
- I. Zuriguel, et al. , Sci. Rep., 2014, 4, 7324 CrossRef CAS PubMed.
- M. D. Haw, Phys. Rev. Lett., 2004, 92, 185506 CrossRef CAS PubMed.
- D. Genovese and J. Sprakel, Soft Matter, 2011, 7, 3889 RSC.
- D. G. Rees, et al. , Phys. Rev. Lett., 2011, 106, 026803 CrossRef CAS PubMed.
- D. G. Rees, H. Totsuji and K. Kono, Phys. Rev. Lett., 2012, 102, 176801 CrossRef PubMed.
- C. J. O. Reichhardt and C. Reichhardt, Phys. Rev. B: Condens. Matter Mater. Phys., 2010, 81, 224516 CrossRef.
- V. Vlasko-Vlasov, T. Benseman, U. Welp and W. K. Kwok, Supercond. Sci. Technol., 2013, 26, 075023 CrossRef.
- G. Karapetrov, V. Yefremenko, G. Mihajlovi, J. E. Pearson, M. Iavarone, V. Novosad and S. D. Bader, Phys. Rev. B: Condens. Matter Mater. Phys., 2012, 86, 054524 CrossRef.
- R. L. Brown and J. C. Richards, Principles of Powder Mechanics, Pergamon Press, Oxford, 1970 Search PubMed.
- C. J. O. Reichhardt, E. Groopman, Z. Nussinov and C. Reichhardt, Phys. Rev. E: Stat., Nonlinear, Soft Matter Phys., 2012, 86, 061301 CrossRef PubMed.
- C. Brito, G. Parisi and F. Zamponi, Soft Matter, 2013, 9, 061301 RSC.
- W. A. Beverloo, H. A. Leniger and J. J. V. de Velde, Chem. Eng. Sci., 1961, 15, 260 CrossRef CAS.
- A. Janda, I. Zuriguel and D. Maza, Phys. Rev. Lett., 2012, 108, 248001 CrossRef PubMed.
- I. Zuriguel, et al. , Phys. Rev. E: Stat., Nonlinear, Soft Matter Phys., 2003, 68, 030301 CrossRef PubMed.
- I. Zuriguel, A. Garcimartín, D. Maza, L. A. Pugnaloni and J. M. Pastor, Phys. Rev. E: Stat., Nonlinear, Soft Matter Phys., 2005, 71, 030301 CrossRef PubMed.
- A. Janda, I. Zuriguel, A. Garcimartín, L. A. Pugnaloni and D. Maza, Europhys. Lett., 2008, 84, 44002 CrossRef.
- C. C. Thomas and D. J. Durian, Phys. Rev. E: Stat., Nonlinear, Soft Matter Phys., 2013, 87, 052201 CrossRef CAS PubMed.
- K. To and P. Y. Lai, Phys. Rev. E: Stat., Nonlinear, Soft Matter Phys., 2002, 66, 011308 CrossRef PubMed.
- C. C. Thomas and D. J. Durian, Phys. Rev. Lett., 2015, 114, 178001 CrossRef CAS PubMed.
- S. M. Rubio-Largo, A. Janda, D. Maza, I. Zuriguel and R. C. Hidalgo, Phys. Rev. Lett., 2015, 114, 238002 CrossRef CAS PubMed.
- S. Dorbolo, et al. , Granular Matter, 2013, 15, 263 CrossRef.
- R. Arévalo, I. Zuriguel, D. Maza and A. Garcimartín, Phys. Rev. E: Stat., Nonlinear, Soft Matter Phys., 2014, 89, 042205 CrossRef PubMed.
- K. To, et al. , Phys. Rev. Lett., 2001, 86, 71 CrossRef CAS PubMed.
- K. To, Phys. Rev. E: Stat., Nonlinear, Soft Matter Phys., 2005, 71, 060301 CrossRef PubMed.
- J. Tang and R. Behringer, Chaos, 2011, 21, 041107 CAS.
- L. Kondic, Granular Matter, 2014, 16, 235 CrossRef CAS.
- S. Tewari, M. Dichter and B. Chakraborty, Soft Matter, 2013, 9, 5016 RSC.
- R. Arévalo, D. Maza and L. A. Pugnaloni, Phys. Rev. E: Stat., Nonlinear, Soft Matter Phys., 2006, 74, 021303 CrossRef PubMed.
- C. Mankoc, A. Garcimartín, I. Zuriguel, D. Maza and L. A. Pugnaloni, Phys. Rev. E: Stat., Nonlinear, Soft Matter Phys., 2009, 80, 011309 CrossRef PubMed.
- C. Lozano, G. Lumay, I. Zuriguel, R. C. Hidalgo and A. Garcimartín, Phys. Rev. Lett., 2012, 109, 068001 CrossRef PubMed.
- E. Altshuler, H. Torres, A. González-Pita, G. Sánchez-Colina, C. Pérez-Penichet, S. Waitukaitis and R. C. Hidalgo, Geophys. Res. Lett., 2014, 41, 3032 CrossRef.
Footnote |
| † Electronic supplementary information (ESI) available: Movie showing two silos discharging under different gravities. See DOI: 10.1039/c5sm01599e |
| This journal is © The Royal Society of Chemistry 2016 |