The selective interactions of cationic tetra-p-guanidinoethylcalix[4]arene with lipid membranes: theoretical and experimental model studies
Beata
Korchowiec
*a,
Marcelina
Gorczyca
b,
Ewa
Rogalska
c,
Jean-Bernard
Regnouf-de-Vains
c,
Maxime
Mourer
c and
Jacek
Korchowiec
*b
aDepartment of Physical Chemistry and Electrochemistry, Faculty of Chemistry, Jagiellonian University, ul. R. Ingardena 3, 30-060 Krakow, Poland. E-mail: bkorch@chemia.uj.edu.pl; Fax: +48 (12) 634 05 15; Tel: +48 (12) 663 22 51
bDepartment of Theoretical Chemistry, Faculty of Chemistry, Jagiellonian University, ul. R. Ingardena 3, 30-060 Krakow, Poland. E-mail: korchow@chemia.uj.edu.pl; Fax: +48 (12) 634 05 15; Tel: +48 (12) 663 20 30
cStructure et Réactivité des Systèmes Moléculaires Complexes, BP 239, CNRS/Université de Lorraine, 54506 Vandoeuvre-lès-Nancy cedex, France
First published on 30th September 2015
Abstract
Behavior of cationic tetra-p-guanidinoethylcalix[4]arene (CX1) and its building block, p-guanidinoethylphenol (mCX1) in model monolayer lipid membranes was investigated using all atom molecular dynamics simulations and surface pressure measurements. Members of two classes of lipids were taken into account: zwitterionic 1,2-dimyristoyl-sn-glycero-3-phosphocholine (DMPC) and anionic 1,2-dimyristoyl-sn-glycero-3-phospho-L-serine sodium salt (DMPS) as models of eukaryotic and bacterial cell membranes, respectively. It was demonstrated that CX1 and mCX1 accumulate near the negatively charged DMPS monolayers. The adsorption to neutral monolayers was negligible. In contrast to mCX1, CX1 penetrated into the hydrophobic part of the monolayer. The latter effect, which is possible due to a flip-flop inversion of the CX1 orientation in the lipid layer compared to the aqueous phase, may be responsible for its antibacterial activity.
Introduction
Calixarenes,1,2 the phenol-formaldehyde cyclic oligomers, are widely used for the synthesis of multivalent ligands with applications in lectin binding and inhibition, DNA condensation and cell transfection, protein surface recognition, self-assembly, crystal engineering, and nanofabrication.3 Some calixarene derivatives are promising antibacterial agents.4 The latter application is important, as antibiotic resistance occurs across the world, and is putting at risk the ability to treat common infections in the community and hospitals.5 Therefore, extensive investigations are carried out with the aim of solving this urgent public health problem. The research should include not only the development of new drugs offering significant benefits over the existing ones but also improve our understanding of the origin of the antibacterial activity. Both tasks are closely related and stimulate their mutual development. Multiresistant Gram-negative bacteria are the prime mover of nosocomial infections6 and the emergence of Gram-negative pathogens that are resistant to essentially all of the available agents may be a serious threat.Drug access to the target can be locally restricted. It can also be restricted by an active efflux process. In Gram-negative bacteria, the access can be constrained by decreasing the influx across the outer membrane barrier.7 The latter is linked to the structure of the envelope of Gram-negative bacteria, which is composed of two lipid membranes.8–10 Contrary to bacteria, the net charge of the human outer leaflet of the plasma membrane is neutral since it is composed of zwitterionic phospholipids, sphingomyelins and cholesterol.11
Such a structural and physical difference between prokaryotes and mammalian outer cell surfaces indicates that the disruption of the bacterial membranes without toxicity for the human host cells should be possible. Therefore, the outer membrane of bacteria is a good target for designing new drugs.
Among variety of candidates for new antibacterial agents are different cationic compounds, whose mechanism of action is based on a direct interaction with the cell envelope.12–17 Recently, a polycationic calixarene-based guanidinium compound, namely, tetra-p-guanidinoethylcalix[4]arene (CX1), was synthesized.18,19 Guanidine is a strong base, which is protonated under physiological conditions. Guanidinium cations are highly stable and resistant to most chemical treatments; guanidine derivatives show this property as well. For example, guanidine group in p-guanidinoethylphenol (mCX1) is strongly basic (pK > 13)20 and remains protonated, except in strongly alkaline solution. It is expected to have the same properties when grafted on the calixarene upper rim in CX1. The antibacterial activity of CX1 was demonstrated for a broad spectrum of bacteria,12,21–23 including multidrug resistant bacteria. The mechanism of action of CX1 is not well understood. It was suggested that the positive charges located on guanidinium groups favor adsorption to the negatively charged bacterial membranes while apolar properties of the calixarene crown facilitate the permeation of the membrane.24,25
In the present study, the molecular dynamics (MD) simulations and surface pressure (π) measurements were used in order to better understand the mechanism of interaction between CX1 and lipid membranes. A phospholipid monolayer spread at the air–water interface was used as a model biological membrane.26–29 Two model systems were considered, namely monolayers formed with 1,2-dimyristoyl-sn-glycero-3-phosphocholine (DMPC) and 1,2-dimyristoyl-sn-glycero-3-phospho-L-serine (DMPS). The zwitterionic DMPC and negatively charged DMPS were used as model lipids corresponding to eukaryotic and bacterial cell membranes, respectively. MD simulations are frequently used to study the monolayer experiment and supplement the monolayer experiment by the atomistic information concerning the film structure and dynamics.
Materials and methods
Materials
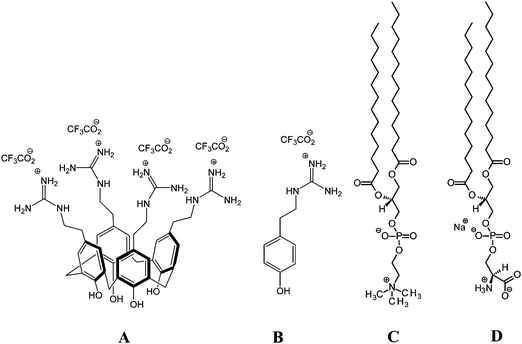
CX1 (MW 1221.01) and mCX1 (MW 293.24) were synthesized as described previously by M. Mourer et al.18,19 Synthetic DMPC (99%), DMPS (sodium salt 99%), chloroform, and methanol (both ∼99.9% pure) were from Sigma-Aldrich. The chemical structures of the compounds used in this study are shown in Scheme 1. CX1 and mCX1 aqueous solutions with a concentration of 4.0 mg L−1 (3.2 μM) and 3.8 mg L−1 (12.8 μM) were used as subphases, respectively. Such concentration of CX1 was chosen because the minimum inhibitory concentration (MIC) found for CX1 in E. coli is 4 mg L−1. mCX1 is not active against E. coli at this concentration. Molar concentration of mCX1 was 4 times higher compared to CX1. The aqueous solutions were prepared with Milli-Q water and were used in all experiments.Surface pressure isotherms
The surface pressure–area (π–A) isotherms were carried out using a KSV 2000 Langmuir balance (KSV Instruments, Helsinki). The isotherms were measured for lipid monolayers formed on pure water and CX1 or mCX1 solutions. The surface pressure was monitored using a platinum Wilhelmy plate. The thermostated Teflon trough (58 × 15 × 1 cm) was equipped with two hydrophilic Delrin barriers (film area between the barriers was 765 cm2). Before each measurement, the subphase surface was cleaned by sweeping and suction. The lipid solutions were spread with a Hamilton syringe on the subphase surface and left for 15 min to allow solvent evaporation and to reach an equilibrium state of the monolayer. All isotherms were recorded upon symmetric compression of the monolayer at a constant barrier speed of 2.5 mm min−1 (a film compression of 5 mm min−1). For each monolayer, measurements were repeated at least 3 times. The π–A isotherms were recorded at 37 ± 0.1 °C. The subphase temperature was maintained constant using a Lauda RE 104 thermostat. The standard deviation obtained from compression isotherms was ±0.5 Å2 on molecular area (A) and ±0.2 mN m−1 on surface pressure.Computational details
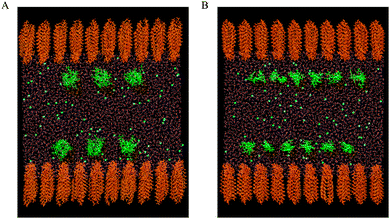
Two monolayers, each composed of 100 phospholipid molecules, were placed on the opposite sides of the water slab at the vacuum–water interface. The headgroups of phospholipids were immersed in water. The adequacy of the symmetric model for describing a monolayer film at the air–water interface was confirmed by different research groups.30–38 The phospholipid molecules were distributed on a rectangular (10 × 10), two-dimensional (2D) lattice. Each molecule was randomly rotated along normal to the water surface (z-direction). The negatively charged DMPS monolayers were neutralized by sodium cations. The water soluble CX1 and mCX1 cations were placed 20 Å below or above the upper or the lower water xy surface, respectively, and distributed on a 2D lattice (3 × 3 for CX1 and 6 × 6 for mCX1). Each CX1 or mCX1 cation was randomly oriented and neutralized by chloride anions. The initial models for DMPC/CX1 and DMPC/mCX1 systems are shown in Fig. 1A and B, respectively. The same procedure was adopted for preparing the initial configuration of the DMPS/CX1 and DMPS/mCX1 systems. The simulation boxes contained 132![[thin space (1/6-em)]](https://www.rsc.org/images/entities/char_2009.gif) 311, 131
311, 131![[thin space (1/6-em)]](https://www.rsc.org/images/entities/char_2009.gif) 921, 200
921, 200![[thin space (1/6-em)]](https://www.rsc.org/images/entities/char_2009.gif) 732, and 219
732, and 219![[thin space (1/6-em)]](https://www.rsc.org/images/entities/char_2009.gif) 767 atoms for DMPC/CX1/Cl−/H2O (200/18/72/35
767 atoms for DMPC/CX1/Cl−/H2O (200/18/72/35![[thin space (1/6-em)]](https://www.rsc.org/images/entities/char_2009.gif) 541), DMPC/mCX1/Cl−/H2O (200/72/72/35
541), DMPC/mCX1/Cl−/H2O (200/72/72/35![[thin space (1/6-em)]](https://www.rsc.org/images/entities/char_2009.gif) 435), DMPS/Na+/CX1/Cl−/H2O (200/200/18/72/58
435), DMPS/Na+/CX1/Cl−/H2O (200/200/18/72/58![[thin space (1/6-em)]](https://www.rsc.org/images/entities/char_2009.gif) 748), and DMPS/Na+/mCX1/Cl−/H2O (200/200/72/72/65
748), and DMPS/Na+/mCX1/Cl−/H2O (200/200/72/72/65![[thin space (1/6-em)]](https://www.rsc.org/images/entities/char_2009.gif) 117) systems, respectively. The numbers in the parentheses correspond to numbers of molecules or ions in the molecular systems. The reference DMPC/H2O and DMPS/Na+/H2O simulation boxes contained 130
117) systems, respectively. The numbers in the parentheses correspond to numbers of molecules or ions in the molecular systems. The reference DMPC/H2O and DMPS/Na+/H2O simulation boxes contained 130![[thin space (1/6-em)]](https://www.rsc.org/images/entities/char_2009.gif) 223 (200/35
223 (200/35![[thin space (1/6-em)]](https://www.rsc.org/images/entities/char_2009.gif) 541) and 198
541) and 198![[thin space (1/6-em)]](https://www.rsc.org/images/entities/char_2009.gif) 664 (200/200/58
664 (200/200/58![[thin space (1/6-em)]](https://www.rsc.org/images/entities/char_2009.gif) 748) atoms.
748) atoms.
Molecular dynamics simulations were carried out using the NAMD239 package and the CHARMM all atom force-field.40 TIP3P water model was employed.40,41 The initial system configurations were first subjected to 100 ps canonical (NVT) ensemble simulations. Then, NpNγT simulations42 were applied for 60 ns (DMPC monolayer) and 120 ns (DMPS monolayer) with a 2 fs time step. During the simulation, all intramolecular motions involving hydrogen atoms were frozen with use of SHAKE/RATTLE algorithms.43 Physiological conditions were used in each simulation. Namely, the normal pressure (pN) was set to be 1 bar. The temperature was equal to 37 °C and the lateral tension (γ) in the monolayer was set to be 40 mN m−1 (γ is the surface tension measured in the presence of the surface active substance; γ0 is the surface tension for the clean air–water interface). This value was chosen, because the lateral pressure (π; π = γ0 − γ) value of 30 mN m−1 is considered,44 as corresponding to the arrangement of molecules in biological membranes. Temperature was controlled by Langevin dynamics with a damping parameter set to be 5 ps. The modified Nosé–Hoover Langevin piston was used (Langevin piston period = 200 fs, Langevin piston decay = 100 fs).45 All simulations were run with periodic boundary conditions. Short-range van der Waals interactions were switched off at 1.2 nm and the potential was smoothed to an asymptotic value starting at 0.9 nm. A particle-mesh Ewald summation46 was used to calculate the long-range electrostatic interactions. Equilibration was checked by means of convergence of pressure normal to the monolayer, and temperature, as well as the average surface per molecule. An additional, 5 ns production run for each system was performed and analyzed using the VMD graphical package.47
Results and discussion
Monolayer experiments
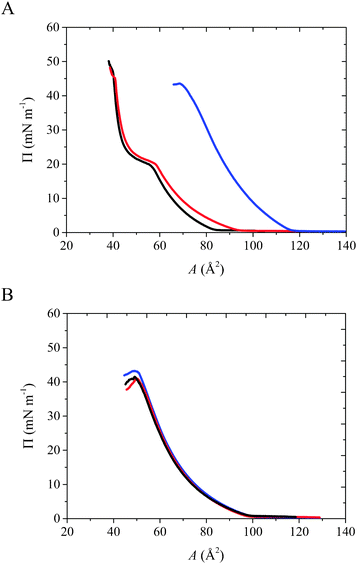
The π–A isotherms of phospholipid monolayers obtained in the absence (black) and in the presence of CX1 (blue) or mCX1 (red) in the subphase are shown in Fig. 2. The isotherm parameters at the most condensed state of the film (collapse point) are given in Table 1. The compressibility modulus (Cs−1; Cs−1 = −A(∂π/∂A)T)48 values were calculated directly from the π–A dependency. The effect of CX1 is significant for the negatively charged DMPS monolayers (Fig. 2A), while in the case of the neutral DMPC all curves are superimposed (Fig. 2B). Indeed, the isotherm corresponding to the DMPS monolayer spread on subphase containing CX1 is shifted to higher molecular areas compared to that on the pure water subphase. The effect of mCX1 is observed as well for the negatively charged lipid; the isotherm is slightly shifted to higher molecular areas. However, the effect is less pronounced compared to CX1. Moreover, the presence of CX1 changes the phase behavior of the DMPS monolayer. Namely, the liquid expanded – liquid condensed (LE–LC) phase transition observed in the DMPS film spread on pure water disappears in the presence of CX1. The disappearance of the LE–LC phase transition shows that the anionic lipid film formed on a CX1 aqueous solution is less stable and more liquid-like compared to the film formed on pure water or on a mCX1 solution. Data presented in Table 1 support this observation. The decreasing values of surface pressure at the collapse point (πcoll) and of Cs−1 for DMPS reveal less stable and more compressible monolayers formed in the presence of CX1 or mCX1 compared to the pure water subphase. It should be also noticed that values determined for DMPC monolayers are similar, regardless of the subphase composition.| A coll (Å2) | π coll (mN m−1) | C s −1 (mN m−1) | |
|---|---|---|---|
| DMPS on pure water | 40.0 | 46.8 | 366.5 |
| DMPS on 3.8 mg L−1 mCX1 | 40.9 | 45.1 | 332.0 |
| DMPS on 4.0 mg L−1 CX1 | 75.4 | 37.4 | 144.2 |
| DMPC on pure water | 51.6 | 39.2 | 129.6 |
| DMPC on 3.8 mg L−1 mCX1 | 51.9 | 39.7 | 126.9 |
| DMPC on 4.0 mg L−1 CX1 | 51.5 | 42.0 | 127.3 |
The compression isotherm data indicate that the modification of monolayer properties may be due to electrostatic interactions between positively charged CX1 or mCX1 and the negatively charged lipid. The CX1 activity against Gram-positive and Gram-negative bacteria can be attributed to the charge–charge interactions, because the bacterial surface is negatively charged. The charge–charge interactions between the guanidinium groups and the negatively charged polar heads of DMPS are responsible for the adsorption and incorporation of a large number of CX1 molecules in the lipid monolayer. This effect would be facilitated by the fact that the hydrophilicity of the hydroxyl groups of CX1 is low due to an intramolecular H-bond network. This may allow CX1 to penetrate into the hydrophobic part of the monolayer and stay even in the highly compressed lipid film. In the case of mCX1 the charge–charge interaction allows adsorption and partial penetration of monomer molecules to the negatively charged monolayers. However, at the surface pressure above 30 mN m−1 the mCX1 molecules are totally squeezed out from the monolayer. Such electrostatic interactions should not be important for the mammalian cells, which are mainly composed of zwitterionic phospholipids such as phosphatidylcholines, sphingomyelins, or the neutral cholesterol.
Molecular dynamics simulations
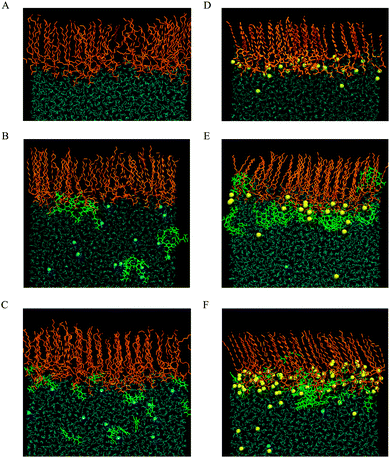
The impact of CX1 and mCX1 on DMPC and DMPS monolayers was further analyzed by molecular dynamics simulations. The snapshots of the equilibrated upper monolayers at the vacuum–water interface are collected in Fig. 3. For reasons of clarity, the hydrogen atoms in phospholipid molecules were excluded from the figure and the number of phospholipid and water molecules along the y axis was limited. The picture was obtained using a VMD graphical package. Panels A–C in Fig. 3 correspond to DMPC and panels D–F to DMPS monolayers. Panels A and D, B and E, or C and F show monolayers formed on pure water, on a CX1 solution, or on a mCX1 solution, respectively.It can be seen that CX1 and mCX1 molecules accumulate close to the DMPS monolayer. This effect can be attributed to the electrostatic attraction between negatively charged DMPS and positively charged CX1 or mCX1 molecules. This effect is not observed in the case of DMPC monolayers where CX1 or mCX1 molecules penetrate the bulk solution as well. Electrostatic interactions are also responsible for the accumulation of Na+ counter ions in the vicinity of the DMPS monolayer. Accordingly, the competition between Na+ and CX1 or mCX1 is observed for systems containing the latter two cations. The comparison of the organization of the lipid chains in DMPC and DMPS reveals that the latter contains more all-trans conformations.
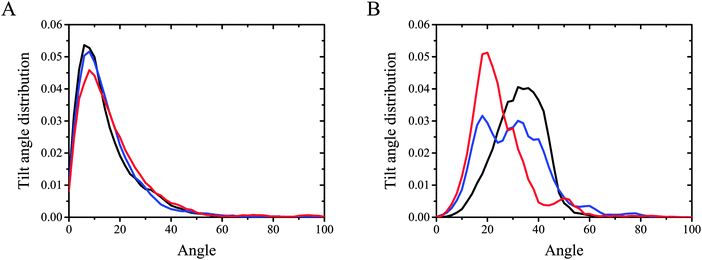
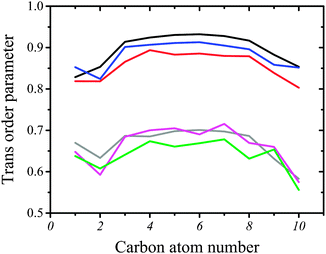
Fig. 5 illustrates tilt angle probability distribution in DMPC and DMPS monolayers (panel A and B, respectively), while Fig. 6 presents trans-conformation parameter along the myristoyl chains. The tilt angle of the hydrocarbon chain is defined by the angle between the vector originating on C2 and going to C14, and the normal to the surface. The height and width of the tilt angle probability distribution remain almost unchanged upon adding of CX1 or mCX1 cations to the DMPC monolayer (Fig. 5A). Also the most probable value of the tilt angle remains unaffected. The differences among curves are more pronounced in the case of the DMPS monolayer. As seen in Fig. 5B, the presence of CX1 significantly broadens the tilt angle probability distribution. The second maximum appeared, indicating the reorganization of the DMPS headgroups upon the introduction of CX1 and the existence of two different headgroup conformations. As a consequence, two different probable tilt angle values are observed. Contrary to CX1, the incorporation of mCX1 narrows the tilt angle probability distribution of DMPS.
The tilt angle probability plots for DMPC are asymmetric; therefore, the average tilt angles are shifted towards higher values. The average values for DMPC, DMPC/CX1, and DMPC/mCX1 are equal to 15.6, 15.7, and 15.7, respectively. The plots obtained with DMPS are more symmetric compared to DMPC. Moreover, the discrepancies between the most probable and the average value are smaller than those corresponding to DMPC. The corresponding values are equal to 33.6, 31.2, and 25.7 for DMPS, DMPS/CX1, and DMPS/mCX1, respectively.
Ordering of hydrophobic chains in DMPC and DMPS can be quantified using an average trans-conformation parameter, S = |3![[thin space (1/6-em)]](https://www.rsc.org/images/entities/char_2009.gif) cos2(θ) − 1|/2, where θ refers to the dihedral angle formed with the C–C bonds in the hydrocarbon chain. The total order in the chain (all-trans) corresponds to 1.0, whereas disorder corresponds to 0. The computed values of S are plotted as two sets of curves in Fig. 6. The upper set composed of three curves corresponds to pure DMPS (black line), DMPS/CX1 (blue line) and DMPS/mCX1 (red line) systems. The high value of S indicates that the all-trans conformation of the acyl chain is predominant in the case of DMPS. Such behavior of C–C bonds in the hydrophobic chains is also clearly seen in the snapshots shown in Fig. 3. Trans ordering in the pure DMPS monolayer is higher compared to the DMPS/CX1 monolayer. Ordering in DMPS/CX1 is slightly higher than in DMPS/mCX1. The second set of curves corresponds to DMPC. Here, the ordering in acyl chains is lower, indicating that the conformational changes are more probable compared to the systems containing DMPS. Nevertheless, the all-trans conformation is predominant (see also Fig. 3). The results obtained show that mCX1 introduces a slightly higher disorder in the acyl chains compared to CX1. Importantly, the conformational mobility is the highest for the terminal carbon atoms in the lipid hydrocarbon chains.
cos2(θ) − 1|/2, where θ refers to the dihedral angle formed with the C–C bonds in the hydrocarbon chain. The total order in the chain (all-trans) corresponds to 1.0, whereas disorder corresponds to 0. The computed values of S are plotted as two sets of curves in Fig. 6. The upper set composed of three curves corresponds to pure DMPS (black line), DMPS/CX1 (blue line) and DMPS/mCX1 (red line) systems. The high value of S indicates that the all-trans conformation of the acyl chain is predominant in the case of DMPS. Such behavior of C–C bonds in the hydrophobic chains is also clearly seen in the snapshots shown in Fig. 3. Trans ordering in the pure DMPS monolayer is higher compared to the DMPS/CX1 monolayer. Ordering in DMPS/CX1 is slightly higher than in DMPS/mCX1. The second set of curves corresponds to DMPC. Here, the ordering in acyl chains is lower, indicating that the conformational changes are more probable compared to the systems containing DMPS. Nevertheless, the all-trans conformation is predominant (see also Fig. 3). The results obtained show that mCX1 introduces a slightly higher disorder in the acyl chains compared to CX1. Importantly, the conformational mobility is the highest for the terminal carbon atoms in the lipid hydrocarbon chains.
To complete the data presented in Fig. 5 and 6, the rotational order parameter, g = 〈2![[thin space (1/6-em)]](https://www.rsc.org/images/entities/char_2009.gif) cos2(φ) − 1〉, was computed, where φ is the azimuthal angle of the tilt vector. The zero value indicates a complete disorder in the orientation while the ±1 value indicates a perfect ordering. The highest rotational ordering equal to 0.68 is observed in DMPS. This value goes down to 0.57 and 0.55 for DMPS/CX1 and DMPS/mCX1 systems, respectively. This indicates a long-range ordering in the lipid monolayer. These results are in accordance with the compression isotherm experiments showing a condensed character of the films formed with DMPS. Such ordering can also be seen in Fig. 3. In contrast to DMPS, the value of rotational order parameter for pure and mixed DMPC systems is close to zero. This indicates an orientational disorder and the formation of a liquid expanded phase. Indeed, both πcoll and Cs−1 values indicate that DMPC films spread on different subphases are less stable and more liquid-like compared to DMPS.
cos2(φ) − 1〉, was computed, where φ is the azimuthal angle of the tilt vector. The zero value indicates a complete disorder in the orientation while the ±1 value indicates a perfect ordering. The highest rotational ordering equal to 0.68 is observed in DMPS. This value goes down to 0.57 and 0.55 for DMPS/CX1 and DMPS/mCX1 systems, respectively. This indicates a long-range ordering in the lipid monolayer. These results are in accordance with the compression isotherm experiments showing a condensed character of the films formed with DMPS. Such ordering can also be seen in Fig. 3. In contrast to DMPS, the value of rotational order parameter for pure and mixed DMPC systems is close to zero. This indicates an orientational disorder and the formation of a liquid expanded phase. Indeed, both πcoll and Cs−1 values indicate that DMPC films spread on different subphases are less stable and more liquid-like compared to DMPS.
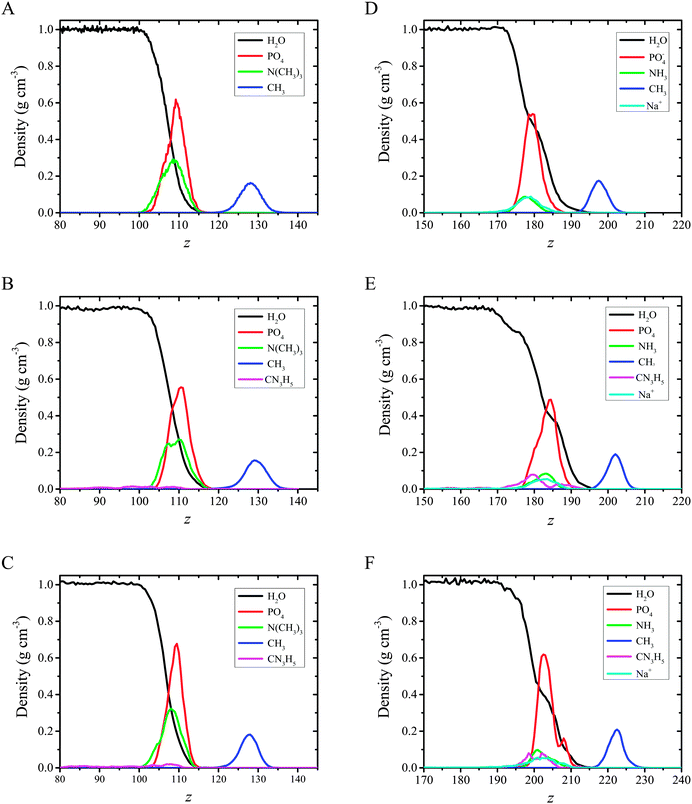
The plots presented in Fig. 7 indicate that the hydrophilic head groups and hydrophobic tails are oriented, respectively, toward water and the vapor phase. The density profiles show that water penetrates into the polar headgroup region. There is a difference in water profiles for DMPC and DMPS systems. Sodium cations associated with the negatively charged phospholipid are also associated with solvation water, which is shown as an inflection point on the water profiles (see Fig. 7, panels A and B vs. panels C and D). These findings indicate that the PO4− group in DMPS is more hydrated compared to DMPC. This effect was observed experimentally using polarization modulation infrared reflection–absorption spectroscopy (PM-IRRAS). Indeed, the asymmetric stretching vibration of phosphate moieties νas(PO2−) was observed at 1236 cm−1 for pure DMPC on the water subphase, while in the case of DMPS it was redshifted to 1219 cm−1. The similar behavior was observed for the CX1 and mCX1 aqueous subphases.24 Moreover, the presence of distinct maxima in the partial density profiles of Na+ is observed at the interface. These maxima coincide with those of amino groups (compare cyan and green lines in Fig. 7D–F) and are in the nearest vicinity of the inflection point of water profiles. To better illustrate this feature, an average number of water molecules around Na+ ions (the average hydration number) was calculated as an integral over radial pair distribution function (Fig. 8).
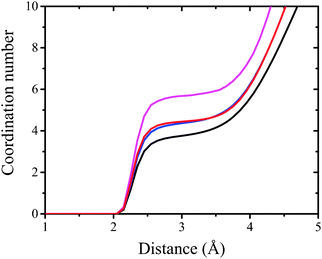 | ||
| Fig. 8 The integral over radial pair distribution function. Magenta, black, blue, and red curves correspond to periodic water box, DMPS, DMPS/CX1, and DMPS/mCX1 systems, respectively. | ||
It can be seen that hydration of Na+ in bulk water is close to 6 (Fig. 8, magenta line). Hydration of Na+ with respect to water goes down to 3.8 (Fig. 8, black line) at the interface (pure DMPS monolayer) and to 4.5 for DMPS/CX1 and DMPS/mCX1 systems (Fig. 8, blue and red lines, respectively). In the DMPS/CX1 and DMPS/mCX1 systems a higher number of Na+ ions is present in the bulk solution compared to the monolayer formed with DMPS on the pure water subphase. This effect is seen as well in Fig. 3.
Distribution of the CH3 groups in both DMPC and DMPS monolayers is broad and symmetric. This indicates a relatively high orientational freedom of the chains. The maxima in the DMPS systems are shifted towards the interface compared to DMPC. In other words, the terminal apolar groups in DMPS may reorient and go closer to the polar head region compared to DMPC. This observation is consistent with tilt angle probability distribution plots shown in Fig. 5.
Adsorption of CX1 and mCX1 to the anionic monolayer is clearly seen in partial density profiles (Fig. 7). Namely, distinct maxima in partial density profiles of guanidinium cations are observed at the interface for DMPS/CX1 (Fig. 7E) or DMPS/mCX1 (Fig. 7F). In the case of a neutral DPPC monolayer, guanidinium ions cover the whole range of variability along the z axis.
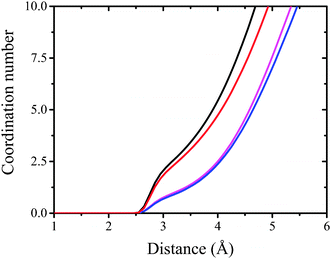 | ||
| Fig. 9 The integral over radial pair distribution function. Black, red, magenta and blue lines correspond to DMPC/mCX1, DMPS/mCX1, DMPC/CX1, and DMPS/CX1 systems, respectively. | ||
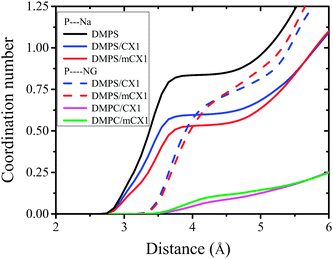
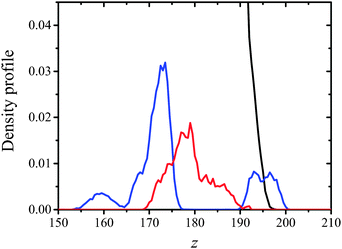
Electrostatic interactions are responsible for the adsorption of CX1 and mCX1 to the interface. As demonstrated with MD simulations, these molecules adsorb to the anionic but not to the neutral, zwitterionic monolayers (Fig. 3–9). However, this observation is not sufficient to understand the different impact of mCX1 or CX1 on the negatively charged monolayers observed experimentally (Fig. 2). In Fig. 3, the penetration of the hydrophobic part of the monolayer by CX1 cations can be observed. The transfer of the CX1 cation to the hydrophobic part of the monolayer is associated with a flip-flop movement of the calixarene derivative. Indeed, a change of the orientation of CX1 is necessary (180 degree rotation around the x or the y axis) to minimize unfavorable electrostatic interactions, with guanidinium groups immersed in water or partially neutralized by PO4− moieties. To demonstrate the reorientation effect, partial density profiles of water in DMPS/CX1 and DMPS/mCX1 systems were imposed and partial density profiles of OH groups were plotted (Fig. 10).
Two different bands were obtained in the case of DMPS/CX1, while DMPS/mCX1 yielded one band. The first DMPS/CX1 band (blue line) and the DMPS/mCX1 band (red line) appear in the water phase. However, the profile corresponding to DMPS/mCX1 is shifted closer to the lipid polar heads compared to DMPS/CX1. This indicates a more efficient penetration of mCX1 between the polar heads of DMPS. The existence of the second band in the case of DMPS/CX1, which is positioned at the interface, indicates that CX1 molecules penetrate into the hydrophobic part of the DMPS film.
Conclusions
Behavior of cationic tetra-p-guanidinoethylcalix[4]arene and p-guanidinoethylphenol cations in a membrane environment was investigated using molecular dynamics and surface compression isotherms. While none of the two molecules has any influence on the properties of the zwitterionic DMPC monolayers, significant effects were observed with the negatively charged DMPS. This result shows that the charge–charge interaction plays an important role in the process of adsorption of the positively charged CX1 and mCX1 to the lipid layer. It should be noted, however, that the impact of CX1 on the DMPS monolayers was more important compared to mCX1, as indicated by the compression isotherm shift to high molecular areas. This difference in the behavior of CX1 and mCX1 was interpreted in terms of the penetration of CX1 into the hydrophobic part of the monolayer due to a higher hydrophobicity of the calixarene aromatic crown, and to the intramolecular H-bonding compared to the phenol moiety present in mCX1. The energetically favorable interaction between DMPS and the calixarene derivative inside the monolayer is possible due to a 180 degree flip-flop inversion of the CX1 orientation upon penetration into the lipid phase, as shown with modeling. The tilt angle probability and the trans-conformation parameter indicate that this behavior of CX1 induces only a limited disordering of hydrocarbon chains. We propose that the isotherm shift to high molecular areas observed in the DMPS/CX1 monolayers is due to an important size of the calixarene derivative compared to mCX1, while the hydrocarbon chains would be disordered only locally. Penetration of CX1 into the monolayer may be responsible for its antibacterial activity.Acknowledgements
This work was supported by the Polish National Science Centre, Project No. 2012/07/B/ST5/00890. M.G. acknowledges the financial support from an Interdisciplinary PhD Studies project entitled “Molecular sciences for medicine” co-financed by the European Social Fund within the Human Capital Operational Programme. Calculations were performed at Faculty of Chemistry of Jagiellonian University on the computer cluster purchased with the financial support from the European Regional Development Fund within the framework of the Polish Innovation Economy Operational Program (Contract No. POIG.02.01.00-12-023/08) and on PL-Grid infrastructure at ACK CYFRONET with the support of the “HPC Infrastructure for Grand Challenges of Science and Engineering” Project.References
- C. D. Gutsche, B. Dhawan, K. H. No and R. Muthukrishnan, J. Am. Chem. Soc., 1981, 103, 3782–3792 CrossRef CAS.
- C. D. Gutsche, Top. Curr. Chem., 1984, 123, 1–47 CrossRef CAS.
- L. Baldini, A. Casnati, F. Sansone and R. Ungaro, Chem. Soc. Rev., 2007, 36, 254–266 RSC.
- A. De Fátima, S. A. Fernandes and A. A. Sabino, Curr. Drug Discovery Technol., 2009, 6, 151–170 CrossRef.
- http://www.who.int/mediacentre/factsheets/fs194/en/ .
- H. Ghodhbane, S. Elaidi, J.-M. Sabatier, S. Achour, J. Benhmida and I. Regaya, Infect. Disord.: Drug Targets, 2015, 15, 2–12 CrossRef CAS.
- H. Nikaido, Annu. Rev. Biochem., 2009, 78, 119–146 CrossRef CAS PubMed.
- Biology of Microorganisms, ed. T. D. Brock, Prentice-Hall, Englewood Cliffs, New Jersey, 1974 Search PubMed.
- S. N. Chatterjee and K. Chaudhuri, Springer Briefs in Microbiology, Springer, 2012 Search PubMed.
- T. J. Silhavy, D. Kahne and S. Walker, Cold Spring Harbor Perspect. Biol., 2010, 2, 123–140 Search PubMed.
- A. J. Verkleij, F. A. Zwal, B. Roelofsen, P. Comfurius, D. Kastelijn and L. L. M. Van Deenen, Biochim. Biophys. Acta, Biomembr., 1973, 323, 178–193 CrossRef CAS.
- M. Mourer, H. Massimba Dibama, P. Constant, M. Daffé and J.-B. Regnouf-de-Vains, Bioorg. Med. Chem., 2012, 20, 2035–2041 CrossRef CAS PubMed.
- J. G. Rodriguez Plaza, R. Morales-Nava, C. Diener, G. Schreiber, Z. D. Gonzalez, M. T. L. Ortiz, I. O. Blake, O. Pantoja, R. Volkmer, E. Klipp, A. Herrmann and G. Del Rio, J. Biol. Chem., 2014, 289, 14448–14457 CrossRef CAS PubMed.
- S.-C. Park, J.-Y. Kim, J.-K. Lee, S. Yoo, H. Kim, C. H. Seo, J.-W. Nah, K.-S. Hahm and Y. Park, Biopolymers, 2011, 96, 130–136 CrossRef CAS PubMed.
- J. Svenson, B.-O. Brandsdal, W. Stensen and J. S. Svendsen, J. Med. Chem., 2007, 50, 3334–3339 CrossRef CAS PubMed.
- M. Cudic, B. A. Condie, D. J. Weiner, E. S. Lysenko, Z. Q. Xiang, O. Insug, P. Bulet and L. Otvos, Peptides, 2002, 23, 2071–2083 CrossRef CAS.
- P. B. Savage, C. Li, U. Taotafa, B. Ding and Q. Guan, FEMS Microbiol. Lett., 2002, 217, 1–7 CrossRef CAS PubMed.
- M. Mourer, R. E. Duval, C. Finance and J. B. Regnouf-de-Vains, Bioorg. Med. Chem. Lett., 2006, 16, 2960–2963 CrossRef CAS PubMed.
- M. Mourer, H. M. Dibama, S. Fontanay, M. Grare, R. E. Duval, C. Finance and J. B. Regnouf-de-Vains, Bioorg. Med. Chem., 2009, 17, 5496–5509 CrossRef CAS PubMed.
- N. Derbel, I. Clarot, M. Mourer, J.-B. Regnouf-de-Vains and M. F. Ruiz-López, J. Phys. Chem. A, 2012, 116, 9404–9411 CrossRef CAS PubMed.
- M. Grare, M. Mourer, J. B. Regnouf-de-Vains, C. Finance and R. E. Duval, Pathol. Biol., 2006, 54, 470–476 CrossRef CAS PubMed.
- M. Grare, H. M. Dibama, S. Lafosse, A. Ribon, M. Mourer, J. B. Regnouf-de-Vains, C. Finance and R. E. Duval, Clin. Microbiol. Infect., 2010, 16, 432–438 CrossRef CAS PubMed.
- M. Grare, S. Fontanay, H. M. Dibama, M. Mourer, J. B. Regnouf-de-Vains, C. Finance and R. E. Duval, Pathol. Biol., 2010, 58, 46–51 CrossRef CAS PubMed.
- G. Sautrey, M. Orlof, B. Korchowiec, J.-B. Regnouf-de-Vains and E. Rogalska, J. Phys. Chem. B, 2011, 115, 15002–15012 CrossRef CAS PubMed.
- C. Formosa, M. Grare, E. Jauvert, A. Coutable, J. B. Regnouf-de-Vains, M. Mourer, R. E. Duval and E. Dague, Sci. Rep., 2012, 2, 575 CAS.
- C. Stefaniu, G. Brezesinski and H. Mohwald, Adv. Colloid Interface Sci., 2014, 208, 197–213 CrossRef CAS PubMed.
- B. Korchowiec, M. Gorczyca, A. Ben Salem, J. B. Regnouf-de-Vains and E. Rogalska, Colloids Surf., B, 2013, 103, 217–222 CrossRef CAS PubMed.
- K. Czapla, B. Korchowiec, M. Orlof, J. R. Magnieto and E. Rogalska, J. Phys. Chem. B, 2011, 115, 9290–9298 CrossRef CAS PubMed.
- B. M. Korchowiec, T. Baba, H. Minamikawa and M. Hato, Langmuir, 2001, 17, 1853–1859 CrossRef CAS.
- S. L. Duncan and R. G. Larson, Biophys. J., 2008, 94, 2965–2986 CrossRef CAS PubMed.
- M. Khabiri, M. Roeselova and L. Cwiklik, Chem. Phys. Lett., 2012, 519–520, 93–99 CrossRef CAS.
- S. Yuan, L. Ma, X. Zhang and L. Zheng, Colloids Surf., A, 2006, 289, 1–9 CrossRef CAS.
- S. Baoukina and D. P. Tieleman, Methods Mol. Biol., 2013, 924, 431–444 CAS.
- D. Rose, J. Rendell, D. Lee, K. Nag and V. Booth, Biophys. Chem., 2008, 138, 67–77 CrossRef CAS PubMed.
- B. Korchowiec, J. Korchowiec, M. Gorczyca, J. B. Regnouf-de-Vains and E. Rogalska, J. Phys. Chem. B, 2015, 119, 2990–3000 CrossRef CAS PubMed.
- J. A. Freites, Y. Choi and D. J. Tobias, Biophys. J., 2003, 84, 2169–2180 CrossRef CAS PubMed.
- S. Rovillard, E. Perez, R. Ionov, M. Voué and J. De Coninck, Langmuir, 1999, 15, 2749–2754 CrossRef CAS.
- M. Pickholz, O. N. Oliveira Jr and M. S. Skaf, J. Phys. Chem. B, 2006, 110, 8804–8814 CrossRef CAS PubMed.
- J. C. Phillips, R. Braun, W. Wang, J. Gumbart, E. Tajkhorshid, E. Villa, C. Chipot, R. D. Skeel, L. Kale and K. Schulten, J. Comput. Chem., 2005, 26, 1781–1802 CrossRef CAS PubMed.
- B. R. Brooks, R. E. Bruccoleri, B. D. Olafson, D. J. States, S. Swaminathan and M. Karplus, J. Comput. Chem., 1983, 4, 187–217 CrossRef CAS.
- A. D. MacKerell, D. Bashford, M. Bellott, R. L. Dunbrack, J. D. Evanseck, M. J. Field, S. Fischer, J. Gao, H. Guo, S. Ha, D. Joseph-McCarthy, L. Kuchnir, K. Kuczera, F. T. K. Lau, C. Mattos, S. Michnick, T. Ngo, D. T. Nguyen, B. Prodhom, W. E. Reiher, B. Roux, M. Schlenkrich, J. C. Smith, R. Stote, J. Straub, M. Watanabe, J. Wiorkiewicz-Kuczera, D. Yin and M. Karplus, J. Phys. Chem. B, 1998, 102, 3586–3616 CrossRef CAS PubMed.
- Y. H. Zhang, S. E. Feller, B. R. Brooks and R. W. Pastor, J. Chem. Phys., 1995, 103, 10252–10266 CrossRef CAS.
- H. C. Andersen, J. Comput. Phys., 1983, 52, 24–34 CrossRef CAS.
- D. Marsh, Biochim. Biophys. Acta, Rev. Biomembr., 1996, 1286, 183–223 CrossRef CAS.
- S. E. Feller, Y. H. Zhang, R. W. Pastor and B. R. Brooks, J. Chem. Phys., 1995, 103, 4613–4621 CrossRef CAS.
- U. Essmann, L. Perera, M. L. Berkowitz, T. Darden, H. Lee and L. G. Pedersen, J. Chem. Phys., 1995, 103, 8577–8593 CrossRef CAS.
- W. Humphrey, A. Dalke and K. Schulten, J. Mol. Graphics Modell., 1996, 14, 33–38 CrossRef CAS.
- J. T. Davies and E. K. Rideal, Interfacial phenomena, Academic Press, 2nd edn, 1963 Search PubMed.
| This journal is © The Royal Society of Chemistry 2016 |

