Self-assembled metallogels formed from N,N′,N′′-tris(4-pyridyl)trimesic amide in aqueous solution induced by Fe(III)/Fe(II) ions†
Jin-Lian
Zhong
ab,
Xin-Jian
Jia
b,
Hui-Jin
Liu
b,
Xu-Zhong
Luo
*b,
San-Guo
Hong
*a,
Ning
Zhang
a and
Jian-Bin
Huang
*c
aInstitute of Applied Chemistry, College of Chemistry, Nanchang University, Nanchang, Jiangxi 330031, P. R. China. E-mail: nzhang.ncu@163.com
bKey Laboratory of Organo-Pharmaceutical Chemistry of Jiangxi Province, Gannan Normal University, Ganzhou, 341000, China. E-mail: zhong.luo-supermolecule@outlook.com
cCollege of Chemistry and Molecular Engineering, Peking University, Beijing 100871, P. R. China. E-mail: jbhuang@pku.edu.cn
First published on 2nd October 2015
Abstract
In this work, we report self-assembled metallogels formed from a ligand of trimesic amide, N,N′,N′′-tris(4-pyridyl)trimesic amide (TPTA), induced by Fe(III)/Fe(II) ions. TPTA is difficult to dissolve in water even in the presence of some metal ions such as Cu2+, Co2+, Ni2+, K+, Na+ and Mg2+ under heating, and it exhibits no gelation ability. Interestingly, upon heating TPTA can be dissolved easily in aqueous solution containing Fe3+/Fe2+, and subsequently self-assembled into metallogels after cooling. The metallogels could also be formed in aqueous solutions of mixed metal ions containing Fe3+/Fe2+, indicating that the other metal ions do not affect the formation of Fe(III)–TPTA and Fe(II)–TPTA metallogels. The high selectivity of metallogel formation to Fe3+/Fe2+ may be used for application in the test of Fe3+/Fe2+. The metallogels obtained are characterized by scanning electron microscopy, Fourier transform infrared spectra, nuclear magnetic resonance spectra, rheological measurements and scanning tunneling microscopy. The results indicate that TPTA can self-assemble into fibrous aggregates in Fe3+/Fe2+ aqueous solution through the metal–ligand interactions and intermolecular hydrogen bonding. This kind of metallogel also possesses good mechanical properties and thermoreversibility.
1. Introduction
Self-assembly has emerged as a powerful process for the production of well-ordered supramolecular structures at the nanometer scale. Supramolecular gels formed from small molecules (i.e., supramolecular gelators or molecular gelators) and liquids have recently triggered enormous research activities because of their wide potential applications in drug-delivery systems,1–3 organic transistors,4 soft organic nanomaterials,5,6 biofilm simulation7–9 and other fields.10–13 Recently, great efforts have been directed toward the synthesis of the supramolecular gels based on hydrogen bonding,14,15 host–guest interactions,16–18 metal–ligand coordination19,20 and acid–base interactions.21 As one kind of “smart” soft material, the unique property of supramolecular hydrogels allows them easily to be biocompatible and biodegradable, and their resemblance to extracellular matrices has stimulated efforts to design and synthesize novel supramolecular hydrogelators as materials for biomedical applications.22,23One of the most rapidly developing areas of functional materials nowadays is metallogels.24,25 The incorporation of metal ions into gels brings new properties to the system. Examples are catalytic and redox activity, conductivity, luminescence, and magnetism which significantly increase when they are used as catalysts, electronic devices, sensors etc. The self-assembly of Fe(III) ions with small molecules to form metallogels has attracted increasing interest in recent years. For example, Fe3+-based metallogels formed in organic liquids were reported by Banerjee26a and Weiss26b groups. Several metallogels based on trimesic amide derivatives and the other metal ions were also extended by Dastidar et al.27 Although there are many reports on the low molecular weight metallogels, it is very difficult to control the self-assembly of low weight molecules in the metallogel formation process. So, it still remains a great challenge to synthesize metallogels derived from the low weight molecules through a facile method.
Herein, we develop a facile method to synthesize low molecular weight metallogels derived from Trimesic Amide. We design and synthesize a compound, N,N′,N′′-tris(4-pyridyl)trimesic amide (TPTA), which contains the pyridine N atom as a coordination atom and amide groups as hydrogen-bond acceptors and donors. TPTA is difficult to dissolve in water even in the presence of some metal ions such as Cu2+, Co2+, Ni2+, K+, Na+ and Mg2+ under heating, and it exhibits no gelation ability under that condition. Interestingly, upon heating TPTA can be dissolved easily in aqueous solution containing Fe3+/Fe2+, and subsequently self-assembled into metallogels after cooling. The high selectivity of the formation of metallogels to Fe3+/Fe2+ may assign the metallogel application in the test of metal ions. The obtained metallogels possess good mechanical properties and thermoreversibility.
2. Experimental section
2.1 Materials
All chemicals were commercially available. Deuterium oxide and dimethyl sulfoxide-d6 were purchased from J&K chemical company.N,N′,N′′-Tris(4-pyridyl)trimesic amide (TPTA) was synthesized according to the method reported in ref. 28a. The product obtained was characterized by IR, NMR and MS (Scheme S1, Fig. S1–S3 in the ESI†).
2.2 Gelation experiments
The gelation ability of TPTA was investigated by a typical test tube experiment. Weighted amounts of TPTA and metal ion aqueous solution were placed into a sealed scintillation vial with a cap. The scintillation vial was heated in a water bath until the solid material dissolved. The resulting solutions were slowly cooled to room temperature and the formation of the gels was confirmed by inverting the scintillation vial containing the solution.2.3 Characterization
Scanning electron microscopy (SEM) images were performed using a FEI QUANTA 450 with an accelerating voltage of 15.0 kV. The preparation of samples for SEM involved placing a drop of the hydrogel on the copper substrate. The hydrogel was subjected to shock-freezing by liquid nitrogen, followed by lyophilization for 3 h. It was then subjected to a SEM scan after gold-coating for 3 min. Fourier transform infrared (FT-IR) spectra measurements were carried out on a Nicolet iS50 FTIR spectrophotometer. CaF2 substrates and KBr pellets were used for transmission spectra of the xerogel and the crystal, respectively. A drop of the metallogel was cast onto CaF2 substrates, which was dried at 60 °C by a vacuumizing method and then the obtained xerogel was subjected to FT-IR spectra measurements. Small-angle X-ray scattering (SAXS) patterns of the dried hydrogel were recorded on a Bruker D8 Focus diffractometer using the CuKα radiation. X-ray was generated with a Cu anode and the CuKα beam (λ = 1.5418 Å) was taken out via a graphite monochrometer. 1H Nuclear Magnetic Resonance (1H NMR) spectra were measured on a Bruker AVANCE 400 MHz spectrometer. Differential scanning calorimetry (DSC) was conducted on a Setaram μDSC7-Evo instrument (heating rate, 1 °C min−1). Rheological measurements were performed using a stress-controlled rheometer (HAAKE RheoStress 6000) with parallel plate type geometry (plate diameter, 3.5 cm). A solvent trap equipped with a rheometer was used to protect the sample from evaporation. Temperature dependencies of the storage shear moduli (G′) and the loss shear moduli (G′′) were studied by heating the sample at a rate of 0.1 °C S−1. The viscoelastic moduli were monitored under small-amplitude oscillatory shear at an applied frequency of 1 Hz and a stress of 1 Pa. Frequency sweeps at selected temperatures were carried out over a range of 0.1–100 rad s−1 and at a stress of 1 Pa. Scanning tunneling microscopy (STM) measurements were performed by using a Nanoscope 3D (Bruker) with mechanically formed Pt/Ir (80/20) tips. A droplet (2 mL) of the 1-phenyloctane solutions was deposited on a freshly cleaved HOPG surface and immediately observed by STM in the constant current mode. The assemblies were formed by subsequent deposition of the components onto a freshly cleaned HOPG (grade ZYB, Veeco Metrology, USA) surface. The specific tunneling conditions are given in the corresponding figure captions. UV absorption spectra were obtained using a UV-1800 UV-Vis spectrophotometer. In the experiments, for SEM, IR, DSC, NMR, UV and rheological measurement, FeCl3·6H2O and FeSO4·7H2O have been used for gel and solution preparation. For STM measurements, FeCl2·4H2O and FeCl3·6H2O have been used for solution preparation.3. Results and discussion
3.1 Gelation test
By experiments, we found that TPTA was difficult to dissolve in water even upon heating. Previous report28b,c revealed that TPTA could form stable thermoreversible gels in some polar organic solvent containing a certain amount of water. While some other trimesic amide derivatives could form stable gels in water29a,b and some organic solvents.29c–f TPTA contains pyridine groups which can coordinate with metal ions. In order to understand the effect of metal ions on the gelation abilities of TPTA, the gelation test of TPTA in aqueous solution containing metal ions was performed. The results are listed in Table S1 in the ESI.† TPTA was difficult to dissolve in aqueous solution containing most metal ions tested in the experiment such as Cu2+, Co2+, Ni2+, K+, Na+ and Mg2+ ions even upon heating and no hydrogels were formed. Interestingly, TPTA can be dissolved easily in aqueous solution containing Fe3+/Fe2+ upon heating and gelatinized aqueous solution efficiently after cooling to form a metallogel (Fig. 1, denoted by Fe(III)–TPTA and Fe(II)–TPTA gel, respectively). The results indicate that the formation of TPTA metallogels has a high selectivity for Fe3+ and Fe2+. In order to determine the gelatinizing ability of TPTA in Fe3+/Fe2+ aqueous solution, the minimum gelator concentration (MGC) is measured. The minimum amounts of TPTA dissolved in 1 L Fe3+/Fe2+ aqueous solution of different concentrations necessary for gelatinizing aqueous solution efficiently were assigned to MGC of TPTA. The MGCs of TPTA in Fe3+/Fe2+ aqueous solution were listed in Table 1. From Table 1, it can be known that the MGCs increase with the concentrations of Fe3+/Fe2+. For example, the MGCs of Fe(III)–TPTA are 11.2 g and 45.0 g for 0.050 mol L−1 and 0.20 mol L−1 Fe3+ aqueous solution, respectively.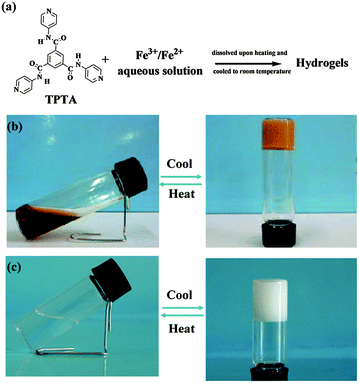 | ||
| Fig. 1 (a) Metallogel formation; the photographs of the gel–sol transition process of (b) Fe(III)–TPTA; (c) Fe(II)–TPTA. | ||
| Gelators | Concentration of Fe3+ (mol L−1) | Concentration of Fe2+ (mol L−1) | The MGC of hydrogel (g L−1) |
|---|---|---|---|
| TPTA | 0.050 | — | 11.2 |
| 0.10 | — | 22.8 | |
| 0.15 | — | 33.7 | |
| 0.20 | — | 45.0 | |
| TPTA | — | 0.010 | 4.4 |
| — | 0.020 | 9.1 | |
| — | 0.030 | 14.4 | |
In addition, TPTA does not dissolve in the aqueous solution of K3[Fe(CN)6] and K4[Fe(CN)6] and exhibits no gelation ability (Table S1 in the ESI†), indicating that only free ions of Fe3+/Fe2+ could induce TPTA to self-assemble into the hydrogel. On the other hand, metallogels are also formed in aqueous solution using Fe3+/Fe2+ salts of Cl−, NO3− and SO42−, indicating that anions cannot affect the formation of hydrogels. Similar results were also observed in metallogels formed from Cu(II) ions and a tetratopic ligand rctt-1,2-bis(3-pyridyl)-3,4-bis(4-pyridyl) cyclobutane.30
The effects of other metal ions on the Fe(III)–TPTA and Fe(II)–TPTA gel formation were also studied (Fig. S4 in the ESI†). TPTA does not dissolve in aqueous solution containing Na+, Cu2+, Mn2+, Co2+, K+ and Cr2+ ions, respectively, or their mixed solution even under the condition of heating. However, TPTA exhibits good solubility in aqueous solutions of mixed metal ions containing Fe3+/Fe2+ upon heating. When a certain amount of TPTA was dissolved in aqueous solutions of mixed metal ions containing Fe3+/Fe2+ upon heating, a metallogel can be formed after the solution cooled to room temperature. The results indicate that the other metal ions do not affect the formation of Fe(III)–TPTA and Fe(II)–TPTA metallogels. Therefore, Fe(III)–TPTA and Fe(II)–TPTA metallogels have a good test function for Fe3+/Fe2+.
Previous reports28b,c revealed that the addition of the polar solvent to water can enhance the solubility of TPTA significantly and thermo-reversible gels were formed upon cooling the heated solutions to room temperature, although TPTA is difficult to dissolve in water. The aggregation behaviour of some asymmetric benzene-1,3,5-tricarboxamides in organic solvents was systematically studied by Meijer et al.29g Their results revealed that even small changes in the molecular structure of substituted benzene-1,3,5-tricarboxamides would affect their self-assembly behaviour in dilute solutions. In our work, we find that the addition of HCl can also enhance the solubility of TPTA significantly in water, but no gel formation is observed. That the addition of Fe3+/Fe2+ enhances the solubility of TPTA significantly in water and stable gels are formed upon cooling the heated solutions to room temperature may be ascribed to self-assembly induced by the coordination effect of Fe3+/Fe2+ and TPTA, which would be confirmed further by scanning tunneling microscopy (STM) observation and the experiments of determining the coordination number of TPTA–Fe3+ (vide infra).
3.2 Morphologies and thermal properties
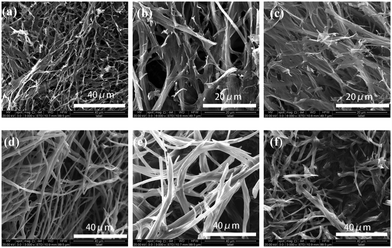
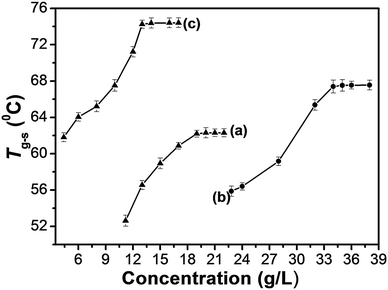
In order to gain an insight into the aggregate morphology, xerogels were studied by scanning electron microscopy. The xerogels were obtained by freeze–drying the hydrogels for avoiding damage from the high vacuum or drying of the samples. As shown in Fig. 2, the xerogels of Fe(III)–TPTA and Fe(II)–TPTA metallogels are composed of fibrous structures at different concentrations. It indicated that the concentrations of Fe3+ and Fe2+ cannot change the aggregate morphology of gelators in metallogels. On the basis of a fibrous structure, the inter-twisted and interlocked fibers form a 3D porous network structure. Large amounts of entangled fibers and fiber bundles are clearly observed. The width of a fiber bundle is approximately 1–3 μm, and the small fiber diameter ranged from 0.1 to 0.4 μm. It indicated that the observed fiber bundles are composed of smaller fibers. It is obvious that the original fibers, aggregates formed from TPTA induced by Fe3+/Fe2+, proceed to assemble into small fibers, and then get entangled to form a close-knit porous network. Gelator molecules created complex three dimensional networks by entangling numerous tiny fibers and entrapped abundant water in the interspace of the networks by surface tension and capillary forces, leading to the formation of metallogels.31Facile thermoreversible gel–sol transition is a notable feature of supramolecular gels.32 Typical heating and cooling DSC curves of metallogels obtained from varying the concentrations of TPTA in aqueous solution containing Fe(III)/Fe(II) ions are studied (Fig. S5 in ESI†). The gel–sol transition temperatures (Tg–s) of metallogels at different concentrations of TPTA were obtained from DSC experiments. By visual inspection, the samples were liquids above Tg–s and then became gels below Tg–s. Shown in Fig. 3a–c are the gel–sol transition temperature (Tg–s) profiles of metallogels prepared by varying concentrations of TPTA in aqueous solution containing 0.050 mol L−1 Fe3+, 0.10 mol L−1 Fe3+ and 0.010 mol L−1 Fe2+, respectively.
It can be known from Fig. 3 that the thermal stability of the Fe(II)–TPTA gels is greater than that of the corresponding Fe(III)–TPTA gels at the same concentrations of TPTA. Tg–s increased gradually and eventually reached a plateau with the increasing of the concentration of TPTA when the concentration of Fe3+/Fe2+ remained unchanged. The temperature of the plateau region was denoted as a concentration-independent Tg–s. The plateau regions occurred at beginning TPTA concentrations of 19.0, 34.0 and 13.0 g L−1 for Fe(III)–TPTA([Fe3+] = 0.050 mol L−1), Fe(III)–TPTA([Fe3+] = 0.10 mol L−1) and Fe(II)–TPTA([Fe2+] = 0.010 mol L−1) gels, respectively. The corresponding concentration-independent Tg–s are 44.6, 55.6 and 74.5 °C, respectively. These results imply that at the beginning, the intricately and densely entangled fibres were formed and the thermal stability of each gel was gradually enhanced following the increasing of the concentration of TPTA. Thereby, a high temperature is needed to break the fibrous structure.33,34 However, when the concentration increased to a certain value, Tg–s reached a constant.
3.3 Rheological properties
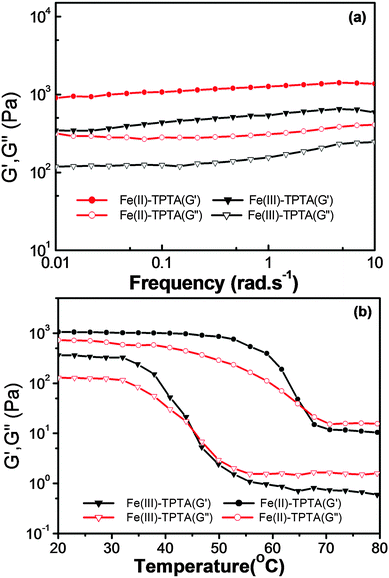
The mechanical performance of a material is extremely important for its practical uses.35 To explore the properties of a gel in detail, rheological measurements were conducted on Fe(III)–TPTA and Fe(II)–TPTA gels. According to Fig. 4a, frequency sweep exhibits typical solid-like rheological behavior with the storage moduli (G′) dominating the loss moduli (G′′) over the investigated oscillating frequency range. Below a certain level of stress, G′ and G′′ are independent of the stress and the deformation is always close to 0, which infers that the gel structure is kept completely intact.36 The G′ and G′′ slightly increase with the frequency from 0.01 to 10 Hz and the value of G′ is always larger than that of G′′ in the whole range (0.01–10 Hz), suggesting that the gels are fairly tolerant to the external force.Additionally, variable-temperature studies were conducted to characterize the thermo-responsive behaviors of Fe(III)–TPTA and Fe(II)–TPTA gels.37Fig. 4b shows the variation tendency of the storage shear moduli (G′) and loss shear moduli (G′′) of gels with increasing temperature. As shown in Fig. 4b, both G′ and G′′ of the Fe(III)–TPTA gel (0.10 mol L−1 Fe3+, 28.0 g L−1 TPTA) almost keep constant from room temperature to 35 °C, above which both G′ and G′′ decrease rapidly with the increase of temperature, indicating the gradual transformation from gel to solution. When the temperature reaches 45 °C, a cross-over point where G′ equals to G′′ appears, marking the transition from primarily elastic to viscous properties. Upon further heating to 55 °C, G′′ exceeds G′, indicating that gel transforms into solution completely. The result is consistent with Tg–s obtained by DSC experiments. Similiar results were observed for the Fe(II)–TPTA gel (0.010 mol L−1 Fe2+, 6.0 g L−1 TPTA) (Fig. 4b).
3.4 IR and 1H NMR Spectral Studies
It is well-known that FT-IR spectroscopy is a powerful tool for investigating intermolecular hydrogen bonding interactions. In order to gain insight into the hydrogen-bonding environment of the amide C![[double bond, length as m-dash]](https://www.rsc.org/images/entities/char_e001.gif) O group, FT-IR experiments were performed. As shown in Fig. 5, the FT-IR spectrum of crystal TPTA is characterized by bands appearing at 3235 and 1687 cm−1 attributed to the N–H and C
O group, FT-IR experiments were performed. As shown in Fig. 5, the FT-IR spectrum of crystal TPTA is characterized by bands appearing at 3235 and 1687 cm−1 attributed to the N–H and C![[double bond, length as m-dash]](https://www.rsc.org/images/entities/char_e001.gif) O stretching bands of amide, respectively. Generally, N–H and C
O stretching bands of amide, respectively. Generally, N–H and C![[double bond, length as m-dash]](https://www.rsc.org/images/entities/char_e001.gif) O stretching bands of amide for a free secondary amide group locate at 3440, 1680 cm−1, respectively.38,39 The red shift of the N–H stretching band of amide for crystal TPTA compared to a free secondary amide group may be attributed to the strong hydrogen-bonding interactions. The C
O stretching bands of amide for a free secondary amide group locate at 3440, 1680 cm−1, respectively.38,39 The red shift of the N–H stretching band of amide for crystal TPTA compared to a free secondary amide group may be attributed to the strong hydrogen-bonding interactions. The C![[double bond, length as m-dash]](https://www.rsc.org/images/entities/char_e001.gif) O stretching band of amide is close to a free amide indicating that the C
O stretching band of amide is close to a free amide indicating that the C![[double bond, length as m-dash]](https://www.rsc.org/images/entities/char_e001.gif) O group is free. The analyses agree well with the previously reported crystal structure of TPTA by our group28a and Dastidar et al.28c In the crystal TPTA, only the hydrogen bonds between N–H of amide and N of pyridine can form and the C
O group is free. The analyses agree well with the previously reported crystal structure of TPTA by our group28a and Dastidar et al.28c In the crystal TPTA, only the hydrogen bonds between N–H of amide and N of pyridine can form and the C![[double bond, length as m-dash]](https://www.rsc.org/images/entities/char_e001.gif) O groups of amides are free.
O groups of amides are free.
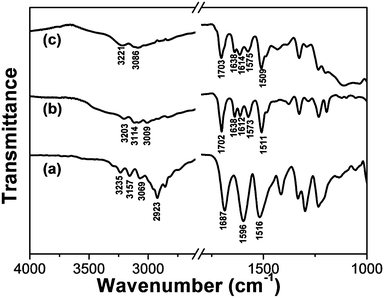 | ||
| Fig. 5 FT-IR spectra of (a) crystal TPTA; (b) the xerogel of Fe(III)–TPTA; (c) the xerogel of Fe(II)–TPTA. | ||
For the Fe(III)–TPTA xerogel (Fig. 5b), the N–H stretching band of amide appears at 3203 cm−1, implying that N–H of the amide group takes part in the formation of intermolecular hydrogen bonds and no free N–H group exists. The C![[double bond, length as m-dash]](https://www.rsc.org/images/entities/char_e001.gif) O stretching bands of amides appear at 1702 and 1638 cm−1, ascribing to free and strong hydrogen bonding amide groups respectively. These results demonstrate that some of the C
O stretching bands of amides appear at 1702 and 1638 cm−1, ascribing to free and strong hydrogen bonding amide groups respectively. These results demonstrate that some of the C![[double bond, length as m-dash]](https://www.rsc.org/images/entities/char_e001.gif) O groups of amides participate in the formation of intermolecular hydrogen bonds and the others are in the free state. Compared to the IR results of crystal TPTA, it can be deduced that the intermolecular hydrogen bonds between adjacent amide groups and the intermolecular hydrogen bonds between N–H of amide and N of pyridine have formed in the Fe(III)–TPTA gel. The shift of C
O groups of amides participate in the formation of intermolecular hydrogen bonds and the others are in the free state. Compared to the IR results of crystal TPTA, it can be deduced that the intermolecular hydrogen bonds between adjacent amide groups and the intermolecular hydrogen bonds between N–H of amide and N of pyridine have formed in the Fe(III)–TPTA gel. The shift of C![[double bond, length as m-dash]](https://www.rsc.org/images/entities/char_e001.gif) O stretching vibration of the free C
O stretching vibration of the free C![[double bond, length as m-dash]](https://www.rsc.org/images/entities/char_e001.gif) O group from 1687 (for crystal TPTA) to 1702 cm−1 (for Fe(III)–TPTA xerogel) may be ascribed to the influence of the coordination interaction between Fe(III)/Fe(II) and TPTA. The IR spectrum of the Fe(II)–TPTA xerogel (Fig. 5c) is almost the same as that of the Fe(III)–TPTA gel (Fig. 5b), suggesting that the pattern of hydrogen bonding in the Fe(II)–TPTA xerogel is close to that in the Fe(III)–TPTA gel. The result indicates that all the N–H groups take part in the formation of intermolecular hydrogen bonds. Two types of intermolecular hydrogen bonds have formed. One is between adjacent amide groups and the other is between N–H of amide and N of pyridine.
O group from 1687 (for crystal TPTA) to 1702 cm−1 (for Fe(III)–TPTA xerogel) may be ascribed to the influence of the coordination interaction between Fe(III)/Fe(II) and TPTA. The IR spectrum of the Fe(II)–TPTA xerogel (Fig. 5c) is almost the same as that of the Fe(III)–TPTA gel (Fig. 5b), suggesting that the pattern of hydrogen bonding in the Fe(II)–TPTA xerogel is close to that in the Fe(III)–TPTA gel. The result indicates that all the N–H groups take part in the formation of intermolecular hydrogen bonds. Two types of intermolecular hydrogen bonds have formed. One is between adjacent amide groups and the other is between N–H of amide and N of pyridine.
It is well known that 1H NMR techniques can give a great deal of information on the self-assembly process in the gel state. Especially, 1H NMR experiments may provide an insight into how molecules are orientated with respect to one another in a self-assembled state.40–42 In general, 1H NMR signals of molecules in solution at moderate field strengths are sharp, while those of samples in the liquid crystal, glass, and gel state broaden and also shift from their usual 1H NMR frequency values. Thus, a correlation of the 1H NMR spectra of the species in solution with that of gel provides an insight into the self-assembly process.
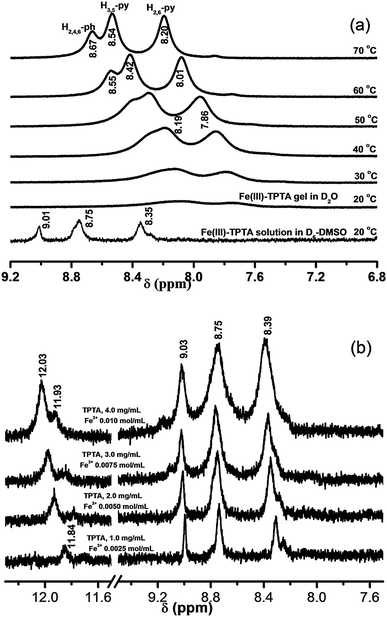
Fig. 6(a) shows the 1H NMR spectra of a solution of Fe(III)–TPTA in D6-DMSO and the gel of Fe(III)–TPTA in D2O at various temperatures. As shown in Fig. 6a, aromatic proton signals of Fe(III)–TPTA in the solution phase appeared at 9.01 (s, H2,4,6-ph), 8.75 (b, H3,5-py) and 8.35 ppm (s, H2,6-py) at 20 °C, while those in the gel phase further broadened, to the extent that they almost disappeared, suggesting that almost all of the Fe(III)–TPTA was incorporated into the gel, rendering it more solid-like, and thus its molecular motion was restricted. Upon heating, the aromatic proton signals in the gel phase gradually appeared with downfield shift from 8.07 (b, H3,5-py) and 7.75 (b, H2,6-py) at 20 °C to 8.54 (b, H3,5-py) and 8.20 ppm (b, H2,6-py) at 70 °C, respectively. Recoveries of the resonance lines of aromatic protons were observed closer to the gel-melting temperature (50 °C) and there was a dramatic sharpening of these resonance lines upon complete gel melting (60 °C). The upfield shift of the aromatic protons in the gel phase may arise from π–π stacking interactions.
For understanding the information of hydrogen bond formation in the solution phase, concentration-dependent 1H NMR studies were conducted. The 1H NMR spectra of a solution containing different amounts of Fe(III)–TPTA in D6-DMSO at 20 °C are shown in Fig. 6(b). It is seen that the signals of the amide protons shifted gradually to lower field (from 11.84 to 12.03(11.93) ppm) upon increasing the concentration of the gelator from 1.0 to 4.0 mg mL−1, suggesting that intermolecular hydrogen bonds have formed in D6-DMSO solution of Fe(III)–TPTA at a relatively high concentration. The signals of the amide protons at 12.03 and 11.93 ppm for solution of 4.0 mg mL−1 Fe(III)–TPTA can be attributed to different types of intermolecular hydrogen-bonded N–H groups.41b The above results imply that no free N–H groups exist in a relatively high concentration solution of Fe(III)–TPTA in D6-DMSO. According to the above analyses, it can be deduced that in a gel of Fe(III)–TPTA, all the N–H groups take part in the formation of intermolecular hydrogen bonds because the concentration of a gel is much higher than a solution. The result is consistent with that obtained by IR experiments.
Similarly, 1H NMR spectroscopy of the Fe(II)–TPTA gel in D2O at various temperatures showed significant line broadening of the protons of the aromatic ring at 20 °C (Fig. S6a in ESI†). Upon heating to 60 °C, the resonance peaks started to become sharp with a downfield shift from 8.45 (s, H2,4,6-ph), 8.31 (b, H3,5-py) ppm and 7.99 (b, H2,6-py) to 9.02 (s, H2,4,6-ph), 8.88 (b, H3,5-py) and 8.53 ppm (b, H2,6-py), respectively, indicating π–π stacking interactions of Fe(II)–TPTA in the gel phase. This observation was consistent with the understanding that the TPTA molecules experience severe mobility restrictions in a gel and that gel melting would indirectly imply melting of that TPTA are now in a state of higher mobility, thereby averaging out or minimizing the dipolar interactions between 1H nuclei.41c The results of 1H NMR of a solution containing different amounts of Fe(II)–TPTA in D6-DMSO at 20 °C (Fig. S6b in the ESI†) also suggest that in a gel of Fe(II)–TPTA, all the N–H groups take part in the formation of intermolecular hydrogen bonds.
3.5 SAXS study
SAXS is a powerful technique for characterizing the morphologies of various types of colloidal dispersions.43 The aggregated structures of Fe(III)–TPTA and Fe(II)–TPTA gels were characterized by SAXS.As shown in Fig. 7, there is no clear diffraction peak at a concentration of 22.8 g L−1, while two clear diffraction peaks appear at 5.02° and 24.50°, corresponding to the d-spacing values of 1.78 nm and 0.36 nm, respectively, at a concentration of 28.0 g L−1. At a concentration of up to 35.0 g L−1, three clear diffraction peaks appear at 5.02°, 10.95° and 24.50°, corresponding to the spacings of 1.78 nm, 0.81 nm and 0.36 nm, respectively. The ratio of the three spacings suggests a lamellar structure with a layer distance of 1.78 nm. These results indicate that with increasing concentration of Fe(III)–TPTA, the aggregation structures of xerogels gradually transformed from amorphous to polycrystalline in the Fe3+ ion solution. In addition, similar results were also obtained for Fe(II)–TPTA gels, of which there are no clear diffraction peaks at low concentration, but with increasing concentration of Fe(II)–TPTA, more and more clear diffraction peaks appear.
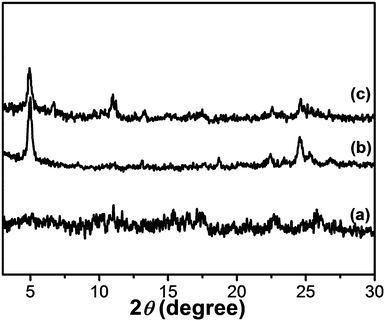 | ||
| Fig. 7 SAXS diagrams of the xerogel formed by Fe(III)–TPTA ([Fe3+] in mol L−1, [TPTA ] in g L−1): (a) 0.10 mol L−1, 22.8 g L−1; (b) 0.10 mol L−1, 28.0 g L−1; (c) 0.10 mol L−1, 35.0 g L−1. | ||
3.6 The structure of a self-assembled gel
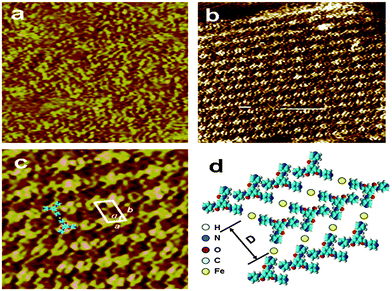
In order to understand the effect of the Fe3+/Fe2+ on the enhancement of the solubility of TPTA in water and supramolecular structures at the single molecule level, scanning tunneling microscopy (STM) is used to investigate the assembly structures. STM images of TPTA and the Fe(III)–TPTA assembling structure are presented in Fig. 8. Owing to the higher electronic density of states of the aromatic rings, the aromatic ring appears in higher contrast than in the image. From Fig. 8a, disordered arrangements can be observed when the pure TPTA solution is deposited on the graphite surface. STM investigation into the 2D assembly of Fe(III)–TPTA is presented in Fig. 8b. The adjacent molecules in the same rows are parallel to each other with a uniform direction. The bright dots in the image can be assigned to TPTA. The parameters were measured to be a = 1.0 ± 0.1 nm, b = 1.6 ± 0.1 nm and α = 60 ± 1.0°, respectively. In order to get detail information on the microstructure of the assembly structures, the coordination molar ratio and coordination stability constant of Fe3+ to TPTA in aqueous solution were determined by spectrophotometry (Fig. S7, in ESI†). The coordination molar ratio and coordination stability constant of Fe3+ to TPTA obtained by the experiment are 1.0 and 2.14 × 10⁵, respectively. In accordance with the STM image (Fig. 8c) and the coordination molar ratio of Fe3+ to TPTA described above, the corresponding two dimensional molecular model is proposed in Fig. 8d.The coordination molar ratio and coordination stability constant of Fe2+ to TPTA in aqueous solution determined by spectrophotometry are 1.0 and 2.73 × 10⁵, respectively (Fig. S8, in the ESI†). STM investigation (Fig. S9, in ESI†) also reveals that order assemblies of Fe(II)–TPTA in two dimension are formed in solution. Considering the disordered arrangements of TPTA in solution, it can be inferred that the coordination of Fe3+/Fe2+ to TPTA is responsible for the formation of the order aggregates of TPTA in solution.
Based on the results of SEM, FT-IR, 1H NMR and SAXS, it can be deduced that the TPTA molecules in the two dimensional molecular layer (Fig. 8d) were connected by coordination and the intermolecular hydrogen bonds between N–H of amide and N of pyridine. The two dimensional molecular layer was further connected by inter-layer hydrogen bonds between part adjacent amide groups and π–π stacking interactions to form a hydrogen bond network and then develop a three dimensional network superstructure. The metal–ligand coordination interactions, hydrogen bonding and π–π stacking interactions played important roles in the self-assembling process.
4. Conclusions
In summary, self-assembled metallogels have been successfully fabricated from TPTA in aqueous solution induced by Fe(III) /Fe(II) ions. The high selectivity of the formation of metallogels to Fe3+/Fe2+ may be used for the application in the test of Fe3+/Fe2+. The experimental results reveal that the driving forces are intermolecular hydrogen bonding, π–π stacking interactions and coordination interactions between Fe3+/Fe2+ and N-py of TPTA. These interactions are responsible for the formation of three dimensional network superstructures, which finally gelate the water. The obtained metallogels possess good mechanical properties and thermoreversibility. These gels may have potential application as biomaterials.Acknowledgements
This work was financially supported by the National Natural Science Foundation of China (51268002, 21363002), NSF of Jiangxi Province (2014ACB20009, 2014BCB22007), Gan Po 555 Engineering Excellence of Jiangxi Province and the Research Programs of Gannan Normal University (15zb07). We thank Dr Yibao Li for the assistance in STM measurements.Notes and references
- A. Motulsky, M. Lafleur, A. C. Couffin-Hoarau, D. Hoarau, F. Boury, J. P. Benoit and J. C. Leroux, Biomaterials, 2005, 26, 6242–6253 CrossRef CAS PubMed.
- S. L. Cao, X. W. Ren, Q. Z. Zhang, E. Chen, F. Xu, J. Chen, L. C. Liu and X. G. Jiang, Int. J. Pharm., 2009, 365, 109–115 CrossRef CAS PubMed.
- Z. Yang and B. Xu, J. Mater. Chem., 2007, 17, 2385–2393 RSC.
- H. C. Moon, T. P. Lodge and C. D. Frisbie, J. Am. Chem. Soc., 2014, 136, 3705–3712 CrossRef CAS PubMed.
- J. H. van Esch and B. L. Feringa, Angew. Chem., Int. Ed., 2000, 39, 2263–2266 CrossRef CAS.
- Y. Qiao, Y. Y. Lin, S. Liu, S. F. Zhang, H. F. Chen, Y. J. Wang, Y. Yan, X. F. Guo and J. B. Huang, Chem. Commun., 2013, 49, 704–706 RSC.
- A. Blanazs, R. Verber, O. O. Mykhaylyk, A. J. Ryan, J. Z. Heath, C. W. I. Douglas and S. P. Armes, J. Am. Chem. Soc., 2012, 134, 9741–9748 CrossRef CAS PubMed.
- R. Verber, A. Blanazs and S. P. Armes, Soft Matter, 2012, 8, 9915–9922 RSC.
- R. J. H. Hafkamp, B. P. A. Kokke, I. M. Danke, H. P. M. Geurts, A. E. Rowan, M. C. Feiters and R. J. M. Nolte, Chem. Commun., 1997, 545–546 RSC.
- P. Sahoo, I. Chakraborty and P. Dastidar, Soft Matter, 2012, 8, 2595–2598 RSC.
- X. J. Fu, N. X. Wang, S. Z. Mang, H. Wang and Y. J. Yang, J. Inorg. Mater., 2008, 23, 393–397 CrossRef CAS.
- J. F. Yin, G. L. Yang, H. L. Wang and Y. Chen, Chem. Commun., 2007, 4614–4616 RSC.
- I. A. Coates and D. K. Smith, Chem. – Eur. J., 2009, 15, 6340–6344 CrossRef CAS PubMed.
- M. D. Loos, J. V. Esch, R. M. Kellogg and B. L. Feringa, Angew. Chem., Int. Ed., 2001, 40, 613–616 CrossRef.
- B. Adhikari, J. Nanda and A. Banerjee, Soft Matter, 2011, 7, 8913–8922 RSC.
- X. Z. Yan, T. R. Cook, J. B. Pollock, P. F. Wei, Y. Y. Zhang, Y. H. Yu, F. H. Huang and P. J. Stang, J. Am. Chem. Soc., 2014, 136(12), 4460–4463 CrossRef CAS PubMed.
- L. X. Jiang, Y. Yan and J. B. Huang, Soft Matter, 2011, 7, 10417–10423 RSC.
- A. Friggeri, O. Gronwald, K. J. C. Van Bommel, S. Shinkai and D. N. Reinhoudt, J. Am. Chem. Soc., 2002, 124, 10754–10758 CrossRef CAS PubMed.
- Z. Y. Li, Y. Y. Zhang, C. W. Zhang, L. J. Chen, C. Wang, H. W. Tan, Y. H. Yu, X. P. Li and H. B. Yang, J. Am. Chem. Soc., 2014, 136(24), 8577–8589 CrossRef CAS PubMed.
- (a) M. Burnworth, L. M. Tang, J. R. Kumpfer, A. J. Duncan, F. L. Beyer, G. L. Fiore, S. J. Rowan and C. Weder, Nature, 2011, 472, 334–337 CrossRef CAS PubMed; (b) W. Li, Y. J. Kim, J. F. Li and M. Lee, Soft Matter, 2014, 10, 5231–5242 RSC.
- (a) M. George and R. G. Weiss, Langmuir, 2003, 19, 1017–1025 CrossRef CAS; (b) X. Z. Luo, Z. X. Chen, W. Xiao, Z. F. Li, Q. Wang and J. L. Zhong, J. Colloid Interface Sci., 2011, 362, 113–117 CrossRef CAS PubMed; (c) I. Kapoor, E. M. Schön, J. Bachl, D. Kühbeck, C. Cativiela, S. Saha, R. Banerjee, S. Roelens, J. J. Marrero-Tellado and D. D. Díaz, Soft Matter, 2012, 8, 3446–3456 RSC.
- (a) A. M. Bieser and J. C. Tiller, Chem. Commun., 2005, 3942–3944 RSC; (b) Y. G. Yang, M. Suzuki, H. Shirai, A. Kurose and K. Hanabusa, Chem. Commun., 2005, 2032–2034 RSC; (c) Z. M. Yang, G. L. Liang, M. L. Ma, Y. Gao and B. Xu, J. Mater. Chem., 2007, 17, 850–854 RSC.
- (a) M. Suzuki, M. Nanbu, M. Yumoto, H. Shirai and K. Hanabusa, New J. Chem., 2005, 29, 1439–1444 RSC; (b) M. Suzuki, S. Owa, M. Kimura, A. Kurose, H. Shirai and K. Hanabusa, Tetrahedron Lett., 2005, 46, 303–306 CrossRef CAS; (c) S. L. Zhou, S. Matsumoto, H. D. Tian, H. Yamane, A. Ojida, S. Kiyonaka and I. Hamachi, Chem. – Eur. J., 2005, 11, 1130–1136 CrossRef CAS PubMed; (d) M. Suzuki, Y. Nakajima, T. Sato, H. Shirai and K. Hanabusa, Chem. Commun., 2006, 377–379 RSC.
- M.-O. M. Piepenbrock, G. O. Lloyd, N. Clarke and J. W. Steed, Chem. Rev., 2010, 110, 1960–2004 CrossRef CAS PubMed.
- (a) J. M. J. Paulusse, D. J. M. van Beek and R. P. Sijbesma, J. Am. Chem. Soc., 2007, 129, 2392–2397 CrossRef CAS PubMed; (b) A. Tam, K. Wong and V. Yam, J. Am. Chem. Soc., 2009, 131, 6253–6260 CrossRef CAS PubMed; (c) S. Y. Zhang, S. J. Yang, J. B. Lan, Y. R. Tang, Y. Xue and J. S. You, J. Am. Chem. Soc., 2009, 131, 1689–1691 CrossRef CAS PubMed.
- (a) H. B. Aiyappa, S. Saha, B. Garai, J. Thote, S. Kurungot and R. Banerjee, Cryst. Growth Des., 2014, 14(7), 3434–3437 CrossRef CAS; (b) M. George, G. P. Funkhouser, P. Terech and R. G. Weiss, Langmuir, 2006, 22, 7885–7893 CrossRef CAS PubMed.
- (a) M. Paul, K. Sarkar and P. Dastidar, Chem. – Eur. J., 2015, 21, 255–268 CrossRef CAS PubMed; (b) S. Banerjee, N. N. Adarshb and P. Dastidar, Soft Matter, 2012, 8, 7623–7629 RSC; (c) S. Banerjee, N. N. Adarsh and P. Dastidar, Soft Matter, 2012, 8, 7623–7629 RSC.
- (a) X. Z. Luo, X. J. Jia, J. H. Deng, J. L. Zhong, H. J. Liu, K. J. Wang and D. C. Zhong, J. Am. Chem. Soc., 2013, 135, 11684–11687 CrossRef CAS PubMed; (b) N. Shi, H. Dong, G. Yin, Z. Xu and S. H. Li, Adv. Funct. Mater., 2007, 17, 1837–1843 CrossRef CAS; (c) D. K. Kumar, D. A. Jose, P. Dastidar and A. Das, Chem. Mater., 2004, 16, 2332–2335 CrossRef CAS.
- (a) R. C. T. Howe, A. P. Smalley, A. P. M. Guttenplan, M. W. R. Doggett, M. D. Eddleston, J. C. Tan and G. O. Lloyd, Chem. Commun., 2013, 49, 4268–4270 RSC; (b) A. Bernet, R. Q Albuquerque, M. Behr, S. T. Hoffmann and H.-W. Schmidt, Soft Matter, 2012, 8, 66–69 RSC; (c) J. Park, J. Kim, M. Seo, J. Lee and S. Y. Kim, Chem. Commun., 2012, 48, 10556–10558 RSC; (d) S. Maity, S. Sarkar, P. Jana, S. K. Maity, S. Bera, V. Mahalingam and D. Haldar, Soft Matter, 2012, 8, 7960–7966 RSC; (e) Y. He, Z. Bian, C. Kang, Y. Cheng and L. Gao, Tetrahedron, 2010, 66, 3553–3563 CrossRef CAS; (f) K. Hanabusa, C. Koto, M. Kimura, H. Shirai and A. Kakehi, Chem. Lett., 1997, 429–430 CrossRef CAS; (g) P. J. M. Stals, M. M. J. Smulders, R. Martín-Rapún, A. R. A. Palmans and E. W. Meijer, Chem. – Eur. J., 2009, 15, 2071–2080 CrossRef CAS PubMed.
- T. D. Hamilton, D. K. Bucar, J. Baltrusaitis, D. R. Flanagan, Y. J. Li, S. Ghorai, A. V. Tivanski and L. R. MacGillivray, J. Am. Chem. Soc., 2011, 133, 3365–3371 CrossRef CAS PubMed.
- X. Huang, P. Terech, S. R. Raghavan and R. G. Weiss, J. Am. Chem. Soc., 2005, 127, 4336–4344 CrossRef CAS PubMed.
- X. Z. Luo, B. Liu and Y. Q. Liang, Chem. Commun., 2001, 1556–1557 RSC.
- Y. Ishioka, N. Minakuchi, M. Mizuhata and T. Maruyama, Soft Matter, 2014, 10, 965–971 RSC.
- A. R. Hirst, D. K. Smith, M. C. Feiters and H. P. M. Geurts, Langmuir, 2004, 20, 7070–7077 CrossRef CAS PubMed.
- W. G. Weng, J. B. Beck, A. M. Jamieson and S. J. Rowan, J. Am. Chem. Soc., 2006, 128, 11663–11672 CrossRef CAS PubMed.
- Y. B. Li, L. X. Cheng, C. H. Liu, Y. Z. Xie, W. Liu, Y. L. Fan, X. Li and X. L. Fan, Soft Matter, 2014, 10, 8261–8267 RSC.
- L. A. Fielding, J. A. Lane, M. J. Derry, O. O. Mykhaylyk and S. P. Armes, J. Am. Chem. Soc., 2014, 136, 5790–5798 CrossRef CAS PubMed.
- R. S. Clegg and J. E. Hutchison, Langmuir, 1996, 12, 5239–5243 CrossRef CAS.
- R. E. Richards and H. W. Thompson, J. Chem. Soc., 1947, 237, 1248–1260 RSC.
- M. Tata, V. T. John, Y. Y. Waguespack and G. L. McPherson, J. Am. Chem. Soc., 1994, 116, 9464–9470 CrossRef CAS.
- (a) D. C. Duncan and D. G. Whitten, Langmuir, 2000, 16, 6445–6452 CrossRef CAS; (b) E. Snip, S. Shinkai and D. N. Reinhoudt, Tetrahedron Lett., 2001, 42, 2153–2156 CrossRef CAS; (c) H. Basit, A. Pal, S. Sen and S. Bhattacharya, Chem. – Eur. J., 2008, 14, 6534–6545 CrossRef CAS PubMed.
- R. G. Weiss, J. Am. Chem. Soc., 2014, 136, 7519–7530 CrossRef CAS PubMed.
- D. J. Abdallah, S. A. Sirchio and R. G. Weiss, Langmuir, 2000, 16, 7558–7561 CrossRef CAS.
Footnote |
| † Electronic supplementary information (ESI) available: Synthesis and characterization of TPTA, the measurement data of SEM, DSC, 1H NMR, STM and UV-Vis spectra, Table S1, and Fig. S1–S9. See DOI: 10.1039/c5sm01513h |
| This journal is © The Royal Society of Chemistry 2016 |

