Reactive crystallization of β-lactam antibiotics: strategies to enhance productivity and purity of ampicillin
Luis G.
Encarnación-Gómez
,
Andreas S.
Bommarius
and
Ronald W.
Rousseau
*
School of Chemical and Biomolecular Engineering, Georgia Institute of Technology, Atlanta, GA 30332-0100, USA. E-mail: rwr@gatech.edu
First published on 1st March 2016
Abstract
Seeded reactive crystallization in the manufacture of semi-synthetic β-lactam antibiotics is described and the beneficial effects on yield are discussed. Conventional enzymatic synthesis of β-lactam is limited by secondary hydrolysis reactions that consume the desired product as it is being produced. Recent work in this area has pointed to the potential advantage of performing reactions at conditions that allow product crystallization to reduce the rate of secondary hydrolysis by protecting ampicillin in the solid phase. However, these approaches led to crystallization of both D-phenylglycine and ampicillin, which will greatly increase downstream processing. In the work described here, seeded crystallization is used to promote secondary nucleation of the desired ampicillin while it is being produced by the synthesis reaction, thereby selectively crystallizing ampicillin. Quantification of the solid phase confirmed selective crystallization of ampicillin with purities greater than 95% wt in all runs.
1. Introduction
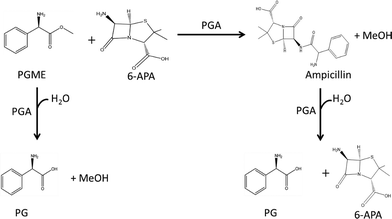
β-Lactam antibiotics are among the top in the list of most used pharmaceutical compounds worldwide. In fact, antibiotics span 5% of the global pharmaceutical market with sales greater than $42 billion.1 β-Lactams have been of great utility during the past decades because of their effectiveness in treating bacterial infections. For this reason β-lactams are listed by the World Health Organization (WHO) as an essential medicine in any country. Conventional production of β-lactam antibiotics includes several chemical processes in which sub-zero temperatures, organochloride solvents, protection and deprotection groups, and additional raw materials are required during the process.2 As with many pharmaceutical products, such processes have a high E-factor (35 kg of waste (not including water)/kg of product).An alternative route for the manufacture of β-lactam antibiotics is the enzymatic synthesis catalyzed by penicillin G acylase (PGA). This enzyme can catalyze the acyl transfer from an activated side-chain donor to the nucleophilic β-lactam to form the desired antibiotic. As for example, enzymatic synthesis of ampicillin can be achieved by reacting 6-aminopenicillanic acid (6-APA) with D-phenylglycine methyl ester (D-PGME) in the presence of PGA. Similarly, other β-lactam products can be synthesized by simply changing the initial reactants.
The overall reaction scheme is presented in Fig. 1, which also shows that in addition to PGA catalyzing the synthesis of ampicillin it also catalyzes the hydrolysis of D-PGME to D-phenylglycine (primary hydrolysis) and the hydrolysis of ampicillin to D-phenylglycine and 6-APA (secondary hydrolysis). In addition, production of the 6-APA starting material can be achieved through hydrolysis of penicillin G by PGA.3
The multiple reaction-engineering strategies that have been used to improve the conversion of 6-APA to ampicillin can be classified into thermodynamically controlled reactions or kinetically controlled reactions. The first relies on optimization of the reaction medium to shift the reversibility of the enzymatic reaction towards the synthesis reaction. Based on the fact that the undesired reaction is an hydrolysis reaction,3–5 used organic co-solvents to shift equilibrium towards synthesis, thereby improving the equilibrium constants, but, unfortunately, reducing the kinetics of reaction drastically. However, the synthesis of ampicillin illustrated in Fig. 1 is kinetically controlled, i.e. an activated carboxylic acid electrophile forms an acyl–enzyme complex before the nucleophile, here 6-APA, replaces the active site serine and forms ampicillin.
Reaction optimization is enabled by acquiring information about the three main reactions: (1) synthesis of ampicillin, (2) primary hydrolysis, and (3) secondary hydrolysis. Significant work has been done in this area, including building kinetic models, optimization of pH and temperature of the reaction, heterogeneous reactions, and complex reactor design.6–9 Among these, reaction with product crystallization seems to be a promising option due to the advantage of obtaining high concentrations of product and its recovery in the solid phase. Several authors have reported the possibility of precipitating ampicillin while it is being produced in solution.9,10 However, ampicillin precipitation was accompanied by precipitation of D-phenylglycine, which has downstream disadvantages: namely, it will be necessary to design a strategy for separation of the two crystallized species.11
In the present work we have developed a reaction–crystallization protocol in which ampicillin is the only product crystallized. To achieve this goal, we have obtained and combined information about solution thermodynamics as well as reaction and crystallization kinetics. The experimental results led to a protocol to ensure high product recovery and purity with a reactive seeded crystallization. In the following sections we demonstrate the process by showing reaction data and the effect on the concentration profile of adding seed crystals to the system.
2. Materials and methods
2.1. Chemicals
D-Phenylglycine methyl ester (PGME) was purchased from Sigma Aldrich USA (St. Louis, MO), 6-aminopenicillanic acid (6-APA), phenylglycine (PG) and ampicillin (Amp) were purchased from VWR USA (Radnor, PA). Penicillin G acylase from E. coli was obtained from DSM-Sinochem (Delft, The Netherlands). Pen G acylase activity towards ampicillin was calculated to be 599 U mg−1 enzyme at a pH of 7.00. Protein concentration of the solution (>99% purity of PGA) was measured to be 17 mg mL−1. All the chemicals and enzyme were used without further purification.2.2. Enzymatic reaction
The enzymatic synthesis of ampicillin was performed in 10 mL test tubes with a working volume of 5 mL. The temperature was maintained at 25 °C using a water-bath shaker operated at 150 rpm. The reactants were added to the 10 mL test tubes in solid form, dissolved in deionized water, and adjusted to the desired pH using 5 N ammonia. Reactions were started by addition of 50 μL of the enzymatic solution. Samples were withdrawn as a function of time to construct concentration profiles by removing 50 μL aliquots from solution. If product precipitation was evident approximately 0.5 mL of the slurry were filtered and the clean solution was used to obtain the 50 μL aliquots.2.3. Scale-up and particle tracking
Reaction crystallization experiments were scaled up from 5 mL to 250 mL using the 1 L OptiMax Synthesis Station from Mettler Toledo (Columbus, OH) shown in Fig. 2. Reaction mixtures were prepared by dissolving the desired amount of 6-APA and D-PGME and adjusting the pH using 5 N ammonia. Solution temperature was maintained at 25 °C and a stirrer speed of 300 rpm. Samples were withdrawn using a syringe. Whenever two phases were present, the solution was withdrawn with a syringe and a 0.45 μm filter was used to remove particles from the solution. Chord-length distributions of crystals were monitored using a Focus Beam Reflectance Measurement (FBRM) apparatus from Mettler Toledo. Further details on the probe can be found elsewhere.122.4. Analytical methods
Solution concentration was analyzed using a Shimazdu (Kyoto, Japan) SCL-10 A high-pressure liquid chromatography (HPLC) system. Aliquots of 50 μL where withdrawn using a micropipette and diluted in 1 mL of HPLC solution with 1 vol% 2 M HCl to quench the reaction. If particles were present in solution, approximately 0.5 mL of slurry was withdrawn with a syringe and filtered prior to taking the 50 μL aliquot. HPLC solution consisted of an aqueous solution of 0.68 g L−1 KH2PO4, 0.68 g L−1 SDS at a pH of 3.0 and acetonitrile (70 vol% aqueous/30 vol% organic). A C18 Kinetix column from Phenomenex (Torrance, CA) was used.Calibration curves were obtained at pH values of 6.00 and 7.00 to ensure that the absorbance of the components was independent of pH value. Some peaks split when the pH of solution was changed as charged species had a different retention time than zwitterions; however, charged and neutral species exhibit the same UV absorbance as a function of concentration.
3. Results and discussion
3.1. Solubility
Since the goal of this work is to design a reactive crystallization scheme that facilitates recovery of high-purity ampicillin, it was necessary to obtain information about the solubility of all components in the system. Fig. 3 shows the solubilities of ampicillin, D-phenylglycine, and 6-APA as a function of pH.13 Since the solubility of D-PGME is significantly higher than that of other components in the system, it was not included in the present analysis. As shown in the figure, solubilities of ampicillin and D-phenylglycine are significantly lower than that of 6-APA. These results indicate the feasibility of designing a reactive crystallization scheme since the concentration of ampicillin reaches its solubility with only partial conversion of 6-APA. Additionally, the solubilities of ampicillin and 6-APA strongly depend on pH, which is in contrast to D-phenylglycine. The behavior can be attributed to differences in pKa.14,15 Ampicillin and 6-APA have lower pKa values, 7.3 and 4.9, respectively, meaning that their fractions of negatively charged species will be higher, and, typically, charged molecules exhibit a higher solubility in water than their zwitterion counterparts. | ||
| Fig. 3 Solubility of ampicillin (left axis), D-phenylglycine (left axis), and 6-APA (right axis) as a function of pH at 298 K. Data from Santana et al. 2010. | ||
3.2. Reaction at highly concentrated conditions
Based on the solubilities of ampicillin, D-phenylglycine, and 6-APA presented in the previous section, ampicillin should saturate the solution during its synthesis when using relatively high concentrations of substrate. Hence, we tested reactions at conditions in which ampicillin crystallization should be possible ([6-APA]0 = 200 mM); at these conditions, only ∼15% conversion is necessary to reach the solubility of ampicillin. Fig. 4 shows the concentration of ampicillin as a function of time at multiple initial concentrations of D-PGME. The data show that the rate of synthesis was enhanced when the concentration of D-PGME was increased. However, Fig. 5 shows that such conditions also enhanced the rate of production of D-phenylglycine, which decreased the selectivity of the reaction. | ||
| Fig. 4 Synthesis of ampicillin at 25 °C and pH of 7. Initial concentration of 0.20 M 6-APA and 0.10–0.30 M D-PGME. | ||
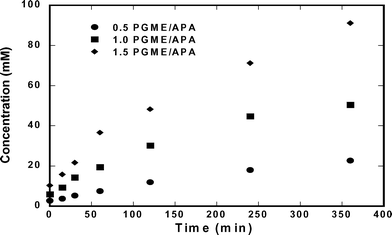 | ||
| Fig. 5 Accumulation of D-phenylglycine at 25 °C and pH of 7.00. Initial concentration of 0.2 M 6-APA and D-PGME 0.10 to 0.30 M. | ||
Youshko et al. developed a model that predicts reaction kinetics for this complex reaction.7 The results are shown in eqn (1), which indicates that an increase in D-PGME concentration at constant concentration of [6-APA] will decrease the selectivity of the reaction towards ampicillin (Amp) because a significant amount of substrate is lost through primary hydrolysis.
 | (1) |
As observed in Fig. 4, the concentration of ampicillin did not decrease at any point during the runs. This indicates that crystallization did not occur even though supersaturations (S = [Amp]/[Amp*]) in the range of 2 to 5 were reached.
Since product crystallization occurred in none of the previous examples, the initial concentration of 6-APA was raised to 0.50 M and that of D-PGME to 0.75 M. Concentration profiles of ampicillin and D-phenylglycine for subsequent reactions are given in Fig. 6, which shows the concentration of ampicillin reached 0.30 M before showing a slight decrease in concentration, but that D-phenylglycine concentration started to decrease after 100 mM, and crystals were observed in the system after 100 minutes. This means that D-phenylglycine precipitation was taking place. Analysis of the solid phase indicated a purity of only 4.85 wt% ampicillin. Hence, we attribute a significant portion of the decay in ampicillin concentration to secondary hydrolysis because high concentrations of ampicillin favor that reaction. In the next section, we will discuss why ampicillin crystallization was not possible at considerable levels of supersaturation.
 | ||
| Fig. 6 Concentration profiles of ampicillin and D-phenylglycine, substrate composition 0.50 M 6-APA and 0.75 M D-PGME. | ||
3.3. Ampicillin nucleation and crystallization
When a homogeneous supersaturated solution reaches sufficiently high supersaturation, a new crystalline solid phase forms and the mechanism of its formation is referred to as primary nucleation. Primary nucleation kinetics can be related to induction time, that is the time that elapses between a solution becoming supersaturated and when crystals of a detectable size are observed in solution.16 The induction time can be divided into the time required to create a nucleus and the time required for the nucleus to grow to a detectable size:| tind = tN + tG | (2) |
In most cases it is acceptable to assume that nucleation is the limiting step (i.e. tN ≫ tG), so that induction periods can be related to the rate of primary nucleation.
| tind = B1−1 | (3) |
 | (4) |
Substitution of eqn (4) into eqn (3) leads to an expression that can be used to relate induction time to primary nucleation.
 | (5) |
Linearization of eqn (5) yields an expression whose slope represents the exponential primary nucleation constant, B0. This constant controls the onset of primary nucleation and can be used to obtain relationships between supersaturation and induction periods.
 | (6) |
More details on induction periods and the physical meaning embodied in the constants can be found elsewhere.16
Ottens et al. reported on induction-time experiments performed to estimate the primary nucleation rate constant B0.17 In a later work by the same group, the effect of multiple impurities on ampicillin crystallization was reported.18 According to their results, reaction substrates and by-products inhibit ampicillin crystallization. This behavior is illustrated for three different initial concentrations of 6-APA in Fig. 7, which shows induction periods as a function of initial supersaturation based on the functional form of eqn (6). Clearly, as 6-APA concentration increases the slope of the semi-logarithmic plot also increases, meaning that a higher supersaturation was necessary to induce nucleation.
 | ||
| Fig. 7 Log of induction time against log of inverse of initial substrate concentration squared. Data obtained from Ottens et al., 2004. | ||
The slope of each plot represents the primary nucleation constant B0 for the given 6-APA concentration. As shown in Fig. 8, the slopes follow a linear relationship over the experimental range of 6-APA concentrations.
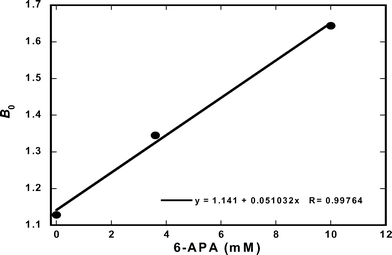 | ||
| Fig. 8 Nucleation rate constant Bo as a function of 6-APA concentration. Data obtained from Ottens et al., 2004. | ||
For qualitative purposes we extrapolated the nucleation rate constant to higher concentrations of 6-APA (up to 150 mM) to estimate the expected induction time as a function of the concentration of 6-APA. As shown in Fig. 9, 6-APA concentration strongly affects induction periods, which can explain why ampicillin crystallization did not occur in our experiments at a supersaturations of 5. In fact, at the experimental conditions, our calculations show that a supersaturation of approximately 10 is necessary for primary nucleation.
 | ||
| Fig. 9 Extrapolation of induction time against 6-APA concentration at multiple supersaturation levels. | ||
Extremely high supersaturations generally are undesirable in crystallization processes because they induce uncontrolled nucleation leading to small crystals and incorporation of impurities. Additionally, as mentioned in the previous section, increasing the concentration of the substrates led to D-phenylglycine precipitation as this by-product has a low solubility. Hence, to reduce the required initial supersaturation for crystallization and thereby improve solid-phase purity, addition of seed crystals was explored and is described in the next section.
3.4. Seeded reactive crystallization
Since relying on primary nucleation to produce ampicillin crystals did not lead to that outcome, except at very high substrate concentrations, we undertook the exploration of using seed crystals to promote secondary nucleation, which should occur at significantly lower supersaturations than primary nucleation. Fig. 10 and 11 show results of the seeded reactive crystallizations conducted at various conditions. In these experiments the solution was seeded with 0.05 g of ampicillin crystals 2 hours after initiating the reaction. The time to add seed crystals was selected based on the concentration profiles from unseeded reactions; in other words, Fig. 4 shows that after 2 hours of reaction time the concentration of ampicillin had reached a value greater than its solubility at the conditions of the reaction. Hence, solutions were seeded after two hours of reaction, and, as shown in Fig. 10, the ampicillin concentration started to decrease 4 hours after starting the reaction. Unseeded reactions at the same conditions resulted in continued increase in ampicillin concentration. | ||
| Fig. 10 Generation of ampicillin at 25 °C and pH 7.00. Initial concentration of 0.20 M 6-APA and 0.20 M or 0.30 M D-PGME, and 0.05 g of seed crystals added after 2 hours of starting the reaction. | ||
In contrast to the results for unseeded crystallization, Fig. 11 shows that the D-phenylglycine concentration profiles for the same experiments increased continuously, suggesting that crystallization of D-phenylglycine did not occur during the process. The data demonstrate one of the potential advantages of seeded reactive crystallization: i.e. the desired product is selectively recovered in the solid phase as it is synthesized and, therefore, subsequent product recovery and purification is not necessary.
The effect of the specific time at which the seed crystals were added was determined by maintaining the amount of seed crystals constant and varying the time at which they were added to the system. Fig. 12 and 13 show the concentration profiles of ampicillin and D-phenylglycine when the seed crystals were added at 30 min, 60 min, and 120 min. Fig. 12 shows that adding seed crystals at 30 min maintained lower ampicillin concentration as ampicillin crystallization was promoted earlier in the process. Fig. 13 shows there was an insignificant effect on the concentration of D-phenylglycine, providing further evidence that the seed crystals promoted only secondary nucleation of ampicillin.
Fig. 14 shows the effects of adding different amounts of seed crystals to the reaction system after 2 hours of operation. Consistent with expectations, larger amounts of seed crystals enhanced crystallization rates and maintained lower concentrations of ampicillin in solution. While the addition of ampicillin seed crystal had an impact on the way ampicillin concentration evolved during the reaction, Fig. 15 shows that the crystallization resulting from addition of seed crystals also reduced the production of D-phenylglycine. Such behavior is consistent with a reduction in secondary hydrolysis.
 | ||
| Fig. 14 Concentration of ampicillin in solution at 25 °C and pH 7.00. Initial concentrations of 0.200 M 6-APA and 0.30 M D-PGME using 0.01 g, 0.05 g, and 0.10 g of seed crystals. | ||
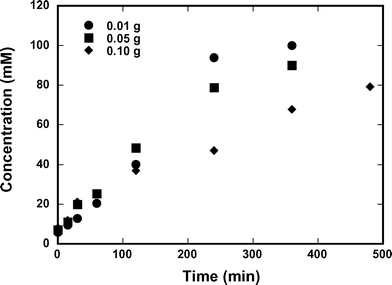 | ||
| Fig. 15 Generation of D-phenylglycine at 25 °C and pH 7.00. Initial concentrations of 0.200 M 6-APA and 0.30 M D-PGME using 0.01 g, 0.05 g, and 0.10 g of seed crystals. | ||
The solutions described in the preceding runs were filtered after 6 h of run time to recover product crystals, which were then dried at room temperature and their purity determined through HPLC analysis. The results in Table 1 show that greater than 90% purity and in most cases greater than 99% purity was obtained from runs in which seed crystals were employed. In fact, the mole fractions of D-phenylglycine in the solid phase were similar to those of 6-APA and D-PGME, which implies that the impurities in the solid phase resulted from entrapment or adherence of the filtered solution to the recovered crystals. It is worth noting that the recovered crystals were not washed, which undoubtedly would have increased their purity still further.
| Run | [6-APA]0 (M) | [D-PGME]0 (M) | Seed mass (mg) | Seeding time (min) | Crystal purity (wt%) |
|---|---|---|---|---|---|
| 1 | 0.20 | 0.30 | 0.00 | — | — |
| 2 | 0.20 | 0.30 | 50.0 | 30 | 98.4 |
| 3 | 0.20 | 0.30 | 50.0 | 60 | 99.1 |
| 4 | 0.20 | 0.30 | 10.0 | 120 | 99.4 |
| 5 | 0.20 | 0.30 | 50.0 | 120 | 95.2 |
| 6 | 0.20 | 0.30 | 100.0 | 120 | 92.3 |
| 7 | 0.20 | 0.20 | 50.0 | 120 | 99.8 |
| 8 | 0.50 | 0.75 | 0.00 | — | 4.85 |
The previous experiments were performed with a total volume of 5 mL. Additionally, during the experiments aliquots of approximately 0.5 mL were withdrawn every time a sample was prepared, meaning roughly 60% of the material was lost through sampling. This does not consider all the material lost during transferring and filtration; thus, the total material recovered is certainly less than that produced by the process. Hence, the total amount of crystalline product was approximated from the following equation:
| Crystal mass = ([Amp]Run 1 − [Amp])·V·MWAmp | (7) |
The equation assumes that the concentration at the end of run would correspond to that exhibited by unseeded Run 1. We then attribute differences in concentration between Run 1 and subsequent runs to crystallization of ampicillin, leading to the results in Table 2 for generated crystal mass after 6 h or reaction and crystallization. Typical progress of two runs is shown in Fig. 16 as the initially clear solutions progressed to cloudy mixtures after addition of seed crystals and then to nearly completely white as the population of ampicillin crystals increased.
| Run | [6-APA]0 (M) | [D-PGME]0 (M) | Crystals mass (mg) |
|---|---|---|---|
| 1 | 0.20 | 0.30 | 0.0 |
| 2 | 0.20 | 0.30 | 84.7 |
| 3 | 0.20 | 0.30 | 75.3 |
| 4 | 0.20 | 0.30 | 34.3 |
| 5 | 0.20 | 0.30 | 67.7 |
| 6 | 0.20 | 0.30 | 72.73 |
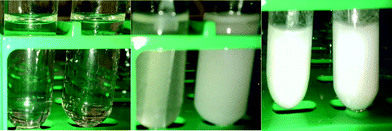 | ||
| Fig. 16 Reactive-crystallization Runs 4 and 5 when reaction started (left), after seeding (center), and after 6 hours (right). | ||
3.5. Scale-up and CLD evolution
The reaction was scaled up from 5 mL to 250 mL, which allowed use of an FBRM probe to monitor the chord length distribution (CLD) of crystals in the slurry. Additionally, the final mass of crystals can be obtained more accurately as losses during the experiment are insignificant in comparison to the mass of crystals recovered. Fig. 17 shows the concentration profile for such a run in which 2.5 g of ampicillin seed crystals were added after 1 hour of reaction time. The concentration profile looks very similar to those obtained using the 5 mL vessels in which a decay in concentration was observed after it reached approximately 80 to 100 mM ampicillin. | ||
| Fig. 17 Reactive crystallization scaled-up to 250 mL (6-APA 0.20 M, D-PGME 0.30 M, 25 °C, and pH 7.00). | ||
Fig. 18 and 19 show FBRM data for the run described in the preceding paragraph. The increase in chord counts at around 200 minutes in Fig. 18 is thought to result from secondary nucleation, which is consistent with the nearly simultaneous decrease in ampicillin concentration shown in Fig. 18. Additionally, we note that 30 to 60 minutes after such nucleation, the number of small crystals (assumed to be characterized by chord lengths of 0 to 50 μm) started to decay while the number of larger crystals (chord lengths 50 to 300 μm) continued to increase. We hypothesize that after nucleation a depletion of supersaturation is caused predominantly by crystal growth rate rather than additional nucleation. Evolution of the chord length distributions, as shown in Fig. 19, is thought to reflect growth of ampicillin crystals.
Finally, 8.5 g of crystals were obtained from the run by filtration and drying process similar to that followed in earlier experiments. The recovered mass included 2.5 g of seed crystals, so that 6.0 g of ampicillin were produced in the process representing a total yield of 67% ampicillin, based on the 6-APA fed to the reactor. Additionally, crystal purity was determined by HPLC to be 99.05 wt% ampicillin. Even with the care taken, we recognize that ampicillin yield is likely to be slightly higher as some material was lost during downstream processing and unrecoverable material remaining in the reactor.
4. Conclusions
In this work we have demonstrated advantages of using a reactive seeded crystallization process for the synthesis of ampicillin. Reaction systems in which ampicillin seed crystals were not added failed to produce product ampicillin crystals, even though the solution had an ampicillin concentration corresponding to a supersaturation (i.e. [Amp]/[Amp*]) of 5. Increasing substrate concentrations in attempts to induce product crystallization without using seed crystals led mainly to crystallization of D-phenylglycine, even though product crystals were determined to contain about 5 wt% ampicillin. All runs in which ampicillin seed crystals were added to the reaction vessel resulted in the production of ampicillin crystals with very high purity (typically >99 wt%). We think this is the first example of a completely selective reactive crystallization of ampicillin. Additionally, the effects of multiple seeding protocols were demonstrated.Moreover, as do other reactive crystallization processes, the operation shown in this work has the advantage of reducing the rates of secondary hydrolysis because ampicillin is protected from the enzyme whenever it is in the solid phase. We also showed that primary hydrolysis could be reduced by adjusting the ratio of substrates fed to the reactor.
Symbols
| [Amp] | Ampicillin concentration (mM) |
| [PG] | D-Phenylglycine concentration (mM) |
| [PGME] | D-Phenylglycine methyl ester concentration (mM) |
| [APA] | 6-Aminopenicillanic acid concentration (mM) |
| t ind | Induction period (s) |
| t N | Induction period (s) |
| t G | Growth period (s) |
| B o | Primary nucleation exponential constant |
| B 1 | Rate of primary nucleation (# per s m3) |
| k B 1 | Primary nucleation constant (# per s m3) |
| S o | Initial supersaturation (mM mM−1) |
Greek letters
| α | Synthesis vs. hydrolysis kinetic constant (dimensionless) |
| β 0 | Synthesis vs. hydrolysis kinetic saturation constant (M−1) |
| γ | Synthesis vs. hydrolysis kinetic constant (dimensionless) |
Acknowledgements
Financial support from the Cecil J. “Pete” Silas Endowment and the Georgia Research Alliance is acknowledged gratefully. We are thankful to DSM-Sinochem (Delft, The Netherlands) for their generous donation of penicillin G acylase from E. coli.References
- B. Hamad, Nat. Rev. Drug Discovery, 2010, 9, 675–675 CrossRef CAS PubMed.
- S. Ospina, E. Barzana, O. T. Ramirez and A. LopezMunguia, Enzyme Microb. Technol., 1996, 19, 462–469 CrossRef CAS.
- O. Abian, C. Mateo, G. Fernandez-Lorente, J. M. Guisan and R. Fernandez-Lafuente, Biotechnol. Prog., 2003, 19, 1639–1642 CrossRef CAS PubMed.
- M. G. Kim and S. B. Lee, J. Mol. Catal. B: Enzym., 1996, 1, 71–80 CrossRef CAS.
- A. Illanes, S. Anjari, R. Arrieta and C. Aguirre, Appl. Biochem. Biotechnol., 2002, 97, 165–179 CrossRef CAS PubMed.
- M. I. Youshko and V. K. Svedas, Biochemistry, 2000, 65, 1367–1375 CAS.
- M. I. Youshko, G. G. Chilov, T. A. Shcherbakova and V. K. Svedas, Biochim. Biophys. Acta, Proteins Proteomics, 2002, 1599, 134–140 CrossRef CAS PubMed.
- M. I. Youshko, L. M. van Langen, E. de Vroom, F. van Rantwijk, R. A. Sheldon and V. K. Svedas, Biotechnol. Bioeng., 2002, 78, 589–593 CrossRef CAS PubMed.
- A. L. O. Ferreira, Ind. Eng. Chem. Res., 2007, 46, 7695–7702 CrossRef CAS.
- M. I. Youshko, L. M. van Langen, E. de Vroom, H. M. Moody, F. van Rantwijk, R. A. Sheldon and V. K. Svedas, J. Mol. Catal. B: Enzym., 2000, 10, 509–515 CrossRef CAS.
- M. A. Hoeben, P. van Hee, R. G. J. M. van der Lans, G. Kwant and L. A. M. van derWielen, Ind. Eng. Chem. Res., 2009, 48, 7753–7766 CrossRef CAS.
- B. Shi, W. J. Frederick and R. W. Rousseau, Ind. Eng. Chem. Res., 2003, 42, 2861–2869 CrossRef CAS.
- M. Santana, M. P. A. Ribeiro, G. A. Leite, R. L. C. Giordano, R. C. Giordano and S. Mattedi, AIChE J., 2010, 56, 1578–1583 CrossRef CAS.
- P. D. Pessoa and G. Maurer, Fluid Phase Equilib., 2008, 269, 25–35 CrossRef.
- L. F. M. Franco, S. Mattedi and P. D. Pessoa, Fluid Phase Equilib., 2013, 354, 38–46 CrossRef CAS.
- O. Sohnel and J. W. Mullin, J. Colloid Interface Sci., 1988, 123, 43–50 CrossRef CAS.
- M. Ottens, B. Lebreton, M. Zomerdijk, M. P. W. M. Rijkers, O. S. L. Bruinsma and L. A. M. van der Wielen, Ind. Eng. Chem. Res., 2001, 40, 4821–4827 CrossRef CAS.
- M. Ottens, B. Lebreton, M. Zomerdijk, M. P. W. M. Rijkers, O. S. L. Bruinsma and L. A. M. van der Wielen, Ind. Eng. Chem. Res., 2004, 43, 7932–7938 CrossRef CAS.
| This journal is © The Royal Society of Chemistry 2016 |

