Systematic understanding of the potential manganese-adsorption components of a screened Lactobacillus plantarum CCFM436
Yanjun Tonga,
Gang Wangac,
Qiuxiang Zhanga,
Fengwei Tianac,
Xiaoming Liuac,
Jianxin Zhaoac,
Hao Zhangac and
Wei Chen*abc
aState Key Laboratory of Food Science and Technology, School of Food Science and Technology, Jiangnan University, Wuxi 214122, People's Republic of China. E-mail: tongyanjun@jiangnan.edu.cn; chenwei66@jiangnan.edu.cn
bBeijing Innovation Centre of Food Nutrition and Human Health, Beijing Technology & Business University, Beijing 100048, People's Republic of China
cInternational Joint Research Laboratory for Probiotics at Jiangnan University, People's Republic of China
First published on 21st October 2016
Abstract
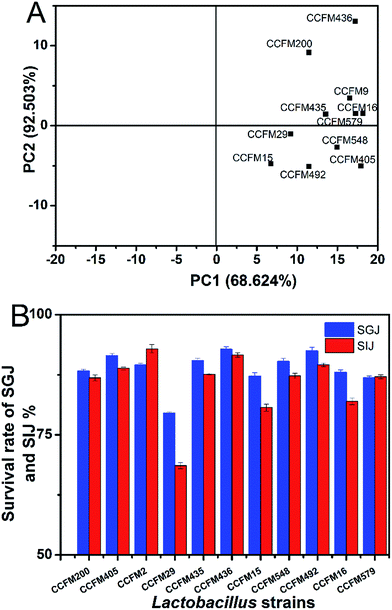
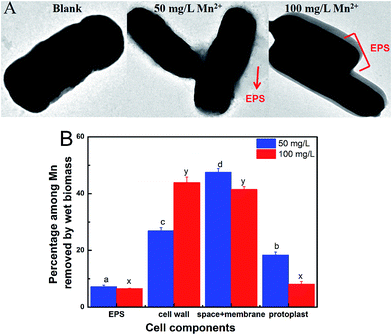
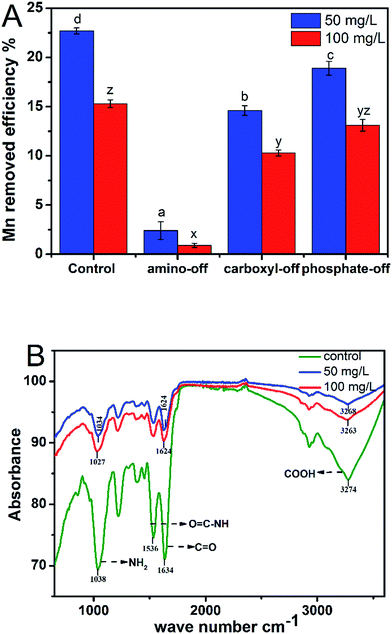
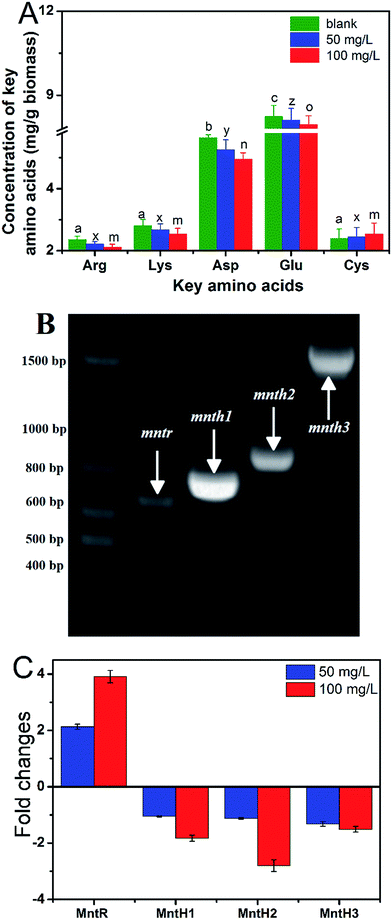
Manganese (Mn) is a toxic heavy metal that has a variety of adverse effects on human health under excess exposure. Here, we screened the lactic acid bacteria Lactobacillus plantarum CCFM436, which displayed a good potential Mn adsorption capacity, from 34 isolates via the Mn binding ability, antioxidative activity and tolerance in simulated gastrointestinal solution. The Mn adsorption of L. plantarum CCFM436 was mainly accomplished by extracellular components (extracellular polysaccharides 6.50–7.22%, cell wall 26.87–43.90%, wall-membrane space, and membrane 41.48–47.51%), whereas only 8.12–18.40% of Mn was transferred into intracellular protoplast. Transmission electron microscope observation indicated that more EPS was secreted with higher levels of Mn stress. Fourier transform infrared spectroscopy showed that the carboxyl and amino groups of L. plantarum CCFM436 made the greatest contribution to the Mn adsorption ability. High performance liquid chromatography analysis indicated that the levels of amino acids (aspartic, glutamic, arginine and lysine) rich in amino/carboxyl groups decreased and cysteine increased, further favorable to tolerance the intracellular Mn stress. The manganese transport operon (mntr) and manganese transporters (mnth1/mnt2/mnt3) were identified by PCR-sequencing. Moreover, qRT-PCR analysis proved that MntH 1–3 were the potential Mn importers and negatively regulated by MntR. This study contributes our scientific understanding of the health-benefits of probiotics and provides a new potential reference in food applications against Mn toxicity.
Introduction
Manganese (Mn) is an essential trace element that is required in many of the enzymatic reactions of metabolism and antioxidant activity.1–3 However, excess Mn exposure has become increasingly common due to increasing Mn contamination from airborne dust, polluted water, and inadequately protected food.3,4 Oxidative stress is generally recognized as an important mechanism of Mn toxicity.4,5 Under higher oxidative stress, the abnormal production of reactive oxygen species and antioxidant enzymes are inhibited, resulting in higher lipid peroxidation and oxidative damage to the DNA.1,6 The prevailing symptoms of Mn exposure include skeletal and cardiovascular dysfunctions, hepatic, and renal damage and reproductive disorders.7 In view of the Mn-induced health effects in humans, the Agency for Toxic Substances and Disease Registry (ATSDR) in the United States sets a minimal risk level (MRL) at 0.3 μg Mn per m3 for chronic-duration inhalation exposure to inorganic Mn.8 With more stringent health requirements, a growing body of research has focused on the removal of Mn in recent decades.To date, no specific treatment for alleviating Mn poisoning has been comprehensively confirmed. Most Mn-deduction treatments focus on chelation therapies, which are deficient in safety or efficacy.2,6 Thus, it is necessary to develop novel strategies to deal with Mn pollution. As a natural inhabitant of the human gastrointestinal tract, Lactobacillus plantarum, has the potential in decreasing intestinal heavy metal absorption and alleviating hepatic oxidative stress in tissues.9,10 It has been intensively reported that some lactic acid bacteria (LAB), including L. plantarum, L. rhamnosus, Bifidobacterium breve and Bifidobacterium lactis, possess the ability to adsorb various heavy metals in vitro.11–13 It has been also clearly demonstrated that the LAB strain can effectively against Mn-induced oxidative stress via its antioxidative properties in humans.14,15 On the basis of these special functions, daily LAB consumption could prove to be a protective dietary strategy for the populations exposed to excess Mn stress. However, the understanding of Mn adsorption by L. plantarum is still in its inception phase. In particular, the knowledge of the detailed mechanism of intracellular homeostasis was limited. Therefore, it is crucial to further explore potential Mn adsorptive role of L. plantarum and to develop a systemic understanding of its detailed functional components to deepen our familiarity with the running mechanism in similar probiotics.
In our previous study, multiple L. plantarum strains with potential Cd, Pb, and Cu adsorption capacity were successfully screened and identified.16–19 In this study, we provide a novel probiotic with potential Mn adsorption and revel its protective effect mechanism from different perspectives based on the above-mentioned properties. First, a LAB strain with good potential Mn adsorption was primarily screened from 34 LAB strains. Second, the Mn adsorption ability, the antioxidative activity of LAB, and resistance in simulated gastric and intestinal juices of LAB were demonstrated. Third, the Mn adsorption efficiency function of the key surface group (N–H, –COOH, and PO43−) was determined via chemical mask treatment and FTIR analysis. Fourth, the intracellular Mn homeostasis mechanism from free amino acid and the transcriptional levels of the transporter genes were determined by HPLC and qRT-PCR analysis, respectively.
Methods and materials
Strains and culture condition
Thirty-four LAB strains, previously preserved in the Culture Collections of Food Microbiology (CCFM), were used in this study. All of the strains were isolated from fermented dairy products, fermented pickles, or the feces of healthy people. The LAB strains were cultured in MRS broth at 37 °C for 18 h. L. plantarum CCFM436 strain was screened from the wine cake sample of shanlan wine from Hainan, China. The optimal culture condition for L. plantarum CCFM436 was 37 °C and pH 6.2–6.4, respectively.Mn adsorption assay
The Mn adsorption ability of the 34 LAB strains was analyzed as previously described with minor modifications. All of the LAB strains were cultured for 18 h, and harvested by centrifuging at 8000 × g for 10 min. The obtained cells were washed once with ultrapure water to obtain the thallus. Samples of 0.2 g of wet thallus were re-suspended in 50 or 100 mg L−1 of Mn solution (50 mL) to obtain a final concentration (4.0 g L−1). The samples were incubated for 2 h at 37 °C then the suspensions were centrifuged at 8000 × g for 10 min, and the residual Mn concentration of the supernatant was analyzed by flame atomic absorption spectrophotometry. The Mn removal rate (%) = (C0 − C1)/C0 × 100%. C0: the initial Mn concentration; and C1: the residual Mn concentration after LAB strain adsorption.Determination of the antioxidative activity of LAB strains
A 2,2-diphenyl-1-picrylhydrazyl (DPPH) scavenging assay was performed as follows. A mixture of 1 mL of DPPH solution (0.2 mM) and the same volume of intact cells was incubated at 37 °C for 30 min in the dark. A mixture of DPPH and PBS buffer was used as the blank. The DPPH scavenging rate was determined by measuring the absorbance at 517 nm after centrifugation at 6000 × g for 10 min. The scavenging rate (%) = (1 − A517 nm of sample/A517 nm of blank) × 100%.The hydroxyl radical clearance ability of the LAB strains was determined as follows. For the sample analysis, the measurement mixture was contained of 1 mL of 1, 10-phenanthroline, 1 mL of PBS buffer, 1 mL of intact LAB cells, 1 mL of FeSO4, and 1 mL of H2O2. After incubation at 37 °C for 1.5 h, the absorbance was measured at 536 nm, and the data were served as the A536 sample. 1 mL of dH2O was added into the sample mixture instead of 1 mL of intact LAB cells, and the data were expressed as A536 nm blank under the same operation condition. For the control sample, 1 mL H2O2 was replaced by the same volume H2O, and the data were as A536 nm control. The scavenging rate (%) = (A536 nm sample − A536 nm blank)/(A536 nm control − A536 nm blank) × 100%.
The reducing ability of the LAB strains was performed as follows. First, 0.5 mL of intact cells was mixed with 0.5 mL of potassium ferricyanide (1%) and 0.5 mL of PBS buffer (pH 6.6). The mixture was incubated at 50 °C for 20 min. Then 0.5 mL of 10% trichloroacetic acid was added into the mixture after it was cooled rapidly. 1 mL of supernate was mixed with 1 mL of 0.1% ferric chloride after centrifugation at 3000 × g for 10 min. The absorbance of the mixture system was analyzed at 700 nm after 10 min of incubation. Cysteine was used as the standard for expression of the reducing activity of the LAB strains.
Determination of the resistance of the LAB strains in simulated gastrointestinal conditions
Simulated gastric juices were prepared by suspending pepsin (final concentration of 0.3%) in a buffer (6.2 g L−1 NaCl, 2.2 g L−1 KCl, 0.22 g L−1 CaCl2, 1.2 g L−1 NaHCO3). The simulated gastric juices were adjusted pH to 3.0 with HCl, and then were sterilized by 0.22 μm filter membrane. Simulated small intestinal juices were prepared by adding trypsin (final concentration of 0.1%) in the buffer (1.28 g L−1 NaCl, 0.239 g L−1 KCl, 6.4 g L−1 NaHCO3, 0.3% cholate). Then the mixture solution was adjusted to pH 7.4 with HCl, and was sterilized by 0.22 μm filter membrane.The harvested thallus of the LAB strains was re-suspended in the simulated gastric juices, and incubated at 37 °C for 2 h. 0.5 mL of the culture was added to 4.5 mL of intestinal juices, and incubated at 37 °C for 5 h. The tolerance to the simulated gastrointestinal conditions was analyzed by determining the total viable count of each LAB strain after incubation with the simulated gastric juices for 2 h or with the simulated intestinal juices for 5 h. The viable counts of each LAB strain were measured with MRS agar plates after serial dilution. The LAB strains were cultured at 37 °C for 48 h. The experiments were repeated three times, and the survival rate was calculated as follows. Survival rate (%) = (lgCFU N1)/(lgCFU N0) × 100%. N1: the total viable count of each LAB strain after treatment with simulated gastrointestinal juices; N0: the total viable count of each LAB strain before treatment.
Observation of cell morphology with transmission electron microscopy
The morphologies of L. plantarum CCFM436 during different Mn adsorption processes were compared under a transmission electron microscope (TEM). 5 mL of cultured medium was harvested and handled at 4 °C for 0.5 h by glutaraldehyde. The cells were immobilized with agar and immersed in phosphate buffer (2.5% glutaraldehyde). The slices were added to an osmium tetroxide solution and treated with a uranyl acetate solution. After dehydration using ethanol and propylene oxide, the slices were stained by uranyl acetate. Finally, the slices were implanted into epoxy and observed by transmission electron microscopy.Determination of the Mn adsorption capacity of each cell component
The Mn adsorption capacity of each cell component was assayed according to a previous report with slight modification.21 (1) An Mn adsorption experiment was performed according to the above-mentioned Mn adsorption assay as the complete adsorption process. (2) 10 mL ddH2O was added to the control system, and the mixture was shaken evenly and centrifuged at 12![[thin space (1/6-em)]](https://www.rsc.org/images/entities/char_2009.gif) 000 × g for 20 min to separate the extracellular polysaccharide (EPS). (3) 10 mL of 0.1 mol L−1 sodium citrate buffer solution was added. The mixture was shaken evenly and centrifuged at 5000 × g for 15 min. This procedure was repeated for 3 times, and the Mn ion content of the supernatant plus was measured to as the adsorption capacity of Mn of cell wall. (4) The cells obtained by centrifugation were added to 1.4 mL of lysozyme solution and 2.6 mL containing 0.8 mol L−1 mannitol PBS buffer, and were further incubated at 37 °C conditions for 3 h. The mixture was centrifuged at 3000 × g for 10 min to ensure complete component separation. (5) The remaining protoplast was digested under microwave condition. The Mn concentration in each step was determined. The Mn adsorption capacity of each cell component = (adsorption amount of Mn for each component/complete adsorption) × 100%.
000 × g for 20 min to separate the extracellular polysaccharide (EPS). (3) 10 mL of 0.1 mol L−1 sodium citrate buffer solution was added. The mixture was shaken evenly and centrifuged at 5000 × g for 15 min. This procedure was repeated for 3 times, and the Mn ion content of the supernatant plus was measured to as the adsorption capacity of Mn of cell wall. (4) The cells obtained by centrifugation were added to 1.4 mL of lysozyme solution and 2.6 mL containing 0.8 mol L−1 mannitol PBS buffer, and were further incubated at 37 °C conditions for 3 h. The mixture was centrifuged at 3000 × g for 10 min to ensure complete component separation. (5) The remaining protoplast was digested under microwave condition. The Mn concentration in each step was determined. The Mn adsorption capacity of each cell component = (adsorption amount of Mn for each component/complete adsorption) × 100%.
Determination of the Mn adsorption associated with different surface groups
Amino chemical treatment: based on a previous method, the surface amino group was neutralized by methylation.22 Cells were added to a formaldehyde–acid mixed solution (v/v 1![[thin space (1/6-em)]](https://www.rsc.org/images/entities/char_2009.gif) :
:![[thin space (1/6-em)]](https://www.rsc.org/images/entities/char_2009.gif) 2). The carboxyl anions were neutralized by methylation.23 The cells were added to an anhydrous methanol solution containing 0.1 mol L−1 of HCl, making a final concentration of 1.0 g L−1 dry cell weight. Chemical processing of phosphate groups: based on the previous method, the cell surface phosphate groups were treated by esterification.24 The cells were added to the triethylphosphite (97%)–nitromethane mixed solution at a ratio 1.25
2). The carboxyl anions were neutralized by methylation.23 The cells were added to an anhydrous methanol solution containing 0.1 mol L−1 of HCl, making a final concentration of 1.0 g L−1 dry cell weight. Chemical processing of phosphate groups: based on the previous method, the cell surface phosphate groups were treated by esterification.24 The cells were added to the triethylphosphite (97%)–nitromethane mixed solution at a ratio 1.25![[thin space (1/6-em)]](https://www.rsc.org/images/entities/char_2009.gif) :
:![[thin space (1/6-em)]](https://www.rsc.org/images/entities/char_2009.gif) 1. The cells were incubated at room temperature for 24 h (amino group), 6 h (carboxyl group) and 6 h (phosphate group) and washed with ddH2O for 3 times. The Mn adsorption ability of the treated cells was measured as above mentioned section.
1. The cells were incubated at room temperature for 24 h (amino group), 6 h (carboxyl group) and 6 h (phosphate group) and washed with ddH2O for 3 times. The Mn adsorption ability of the treated cells was measured as above mentioned section.
Determination of intracellular amino acid by HPLC
50 mL of cells grown in different Mn concentrations (16, 50, 100 mg L−1) for 18 h were harvested by centrifugation at 8000 × g for 5 min and washed three times with ddH2O. The cells were re-suspended in 1 mL of 5% trichloroacetic acid at 37 °C for 1 h, and then the cell debris were discarded by centrifugation at 12![[thin space (1/6-em)]](https://www.rsc.org/images/entities/char_2009.gif) 000 × g for 10 min. The supernatants with intracellular amino acid were assayed by HPLC in accordance with a previously reported method.25 Phenyl isothiocyanate (PITC) was used as a derivatization reagent. The Sepax AA (250 mm × 4.6 mm, 5 μm) was used as analytical column, 0.1 M sodium acetate (contained 7% acetonitrile, pH 6.5) was used as mobile phase A, 75% acetonitrile solution was selected as mobile phase B, and gradient elution was conducted at a flow rate of 1.0 mL min−1. The detection wavelength was at 254 nm, and all the amino acids were eluted during about 28 min detection.
000 × g for 10 min. The supernatants with intracellular amino acid were assayed by HPLC in accordance with a previously reported method.25 Phenyl isothiocyanate (PITC) was used as a derivatization reagent. The Sepax AA (250 mm × 4.6 mm, 5 μm) was used as analytical column, 0.1 M sodium acetate (contained 7% acetonitrile, pH 6.5) was used as mobile phase A, 75% acetonitrile solution was selected as mobile phase B, and gradient elution was conducted at a flow rate of 1.0 mL min−1. The detection wavelength was at 254 nm, and all the amino acids were eluted during about 28 min detection.
Identification of key transporter genes by PCR/sequencing
The whole DNA of cells grown in different Mn concentrations (16, 50, 100 mg L−1) for 18 h was extracted according to the phenol–chloroform protocol. The sequences of MntHs or MntR genes from other L. plantarum strains were blasted by DNAMAN software, and the PCR primers were designed on the basis of the comparison results (Table 1). The PCR reaction conditions were set as follows. Pre-denaturation at 95 °C for 5 min, denaturation at 95 °C for 30 s, annealing at 55 °C for 30 s, extension at 72 °C for 90 s, and posterior extension 72 °C for 10 min. The PCR products were varied by 0.8% agarose gel electrophoresis and sequenced in Sangon Bioetch, Shanghai, China. The sequences of MntHs or MntR genes of L. plantarum CCFM436, and other closely related L. plantarum strains from the National Center for Biotechnology Information were compared by the Blast Alignment tool.| Application | Genes | Primers sequence (5′-3′) |
|---|---|---|
| PCR identification | mnth1 | F: ATGTTAAAAGTACAAAACCTCACCGTGGC |
| R: TCATCGCGTTTCCTCCTTCGTAAACAGGAC | ||
| mnth2 | F: ATGCAATCAATTACGACCTTTATGGCTGC | |
| R: TCATGCTGTCACCCGTCGCGCTGCTGCTTG | ||
| mnth3 | F: ATGAGCGAAAAGACGAACACCCCAAACCG | |
| R: TTATTTGTTGGCCTCCTTTGCTGCTGCAG | ||
| mntr | F: ATGACCCCCATGAAGGAAGATTACT | |
| R: TTACTTTACAAAGACATTGTGCGCCGC | ||
| qRT-PCR analysis of the transcription level | mnth1 | F: TCACCGTGGCATACAGTGACACAC |
| R: TGAAATTGTTTTAGCGCACGACCT | ||
| mnth2 | F: TACGTGGCATGTCGATGATGG | |
| R: CACGACCGTCGTCGTCATCATATC | ||
| Mnth3 | F: TACATGGATCCCGGTAACTGGTCAAC | |
| R: GATCCATCTGACTCACGATACCAAG | ||
| mntr | F: TATTTTCGAGCTTGGTGGTACGAA | |
| R: CTAAGAAATCTTCCCAGATTCGGTG | ||
| 16S rRNA | F: AGCAGCCGCGGTAATACGTAGGTG | |
| R: GACCAGACAGCCGCCTTCGCCACAC |
Quantitative RT-PCR analysis of the transcriptional levels of transporters
qRT-PCR analysis was used to quantify the transcriptional levels of the transporters. Total RNA was extracted from different samples with TRIzol reagent. The reverse transcription reactions were proceeded at 42 °C for 2 min with a PrimeScrip™RT reagent kit. The primers are listed in Table 2. Then the RT-PCR reaction was processed with a 20 μL mixture comprising 1 μL of PrimerScript RT Enzyme Mix, 1 μL of RT Primer Mix, 4 μL of 5 × PrimerScript Buffer, 4 μL of RNase Free dH2O, and 10 μL of removing the genome DNA reaction mixture. qRT-PCR was performed with SYBR Premix Ex Taq II. The PCR reaction mixture of 20 μL contained 10 μL of SYBR Premix Ex Taq II, 1 μL of PCR forward primer (10 μM), 1 μL of PCR reverse primer (10 mM), 1 μL of sample cDNA, 7 μL of dH2O. PCR specificity was verified by melt-curve analysis of the samples. The cycle threshold (Ct) value was measured, and the relative quantification of specific gene expression was determined using the 2−ΔΔCt method.26 16S rRNA of L. plantarum CCFM436 was used as an internal control in PCR amplification.| Strain | Scavenging rate of DPPH (%) | Scavenging rate of hydroxyl radical (%) | Reducing ability |
|---|---|---|---|
| L. plantarum CCFM436 | 23.31 ± 0.27 | 21.08 ± 0.16 | 160.80 ± 1.34 |
| L. plantarum CCFM200 | 15.02 ± 0.23 | 13.89 ± 0.36 | 36.39 ± 0.45 |
| L. plantarum CCFM405 | 10.73 ± 0.31 | 32.02 ± 0.57 | 172.67 ± 1.12 |
| L. plantarum CCFM435 | 11.72 ± 0.19 | 21.15 ± 0.33 | 119.76 ± 1.23 |
| L. casei CCFM9 | 15.06 ± 0.17 | 25.57 ± 0.29 | 15.68 ± 0.34 |
| L. plantarum CCFM548 | 10.26 ± 0.24 | 25.51 ± 0.43 | 173.19 ± 1.56 |
| L. plantarum CCFM579 | 14.53 ± 0.34 | 27.64 ± 0.62 | 119.76 ± 0.89 |
| L. gasseri CCFM15 | 1.28 ± 0.01 | 13.21 ± 0.28 | 21.32 ± 0.22 |
| L. bulgaricus CCFM29 | 5.92 ± 0.12 | 15.41 ± 0.18 | 36.65 ± 0.43 |
| L. rhamnosus CCFM492 | 5.56 ± 0.11 | 20.91 ± 0.36 | 134.99 ± 1.21 |
| B. bifidum CCFM16 | 21.57 ± 0.53 | 25.41 ± 0.38 | 44.32 ± 0.23 |
Statistical analysis
Each assay was performed three times and the data were expressed as the mean ± the standard error of the mean. The differences between the means of the test were analyzed using one-way analysis of variance, followed by Tukey's post hoc test. The statistical analysis of the data was performed by SPSS 16.0, and a p value of <0.05 was defined as statistically significant. For the principal component analysis (PCA), the input data matrix was extracted in terms of a complementary set of scores and loading plots.Results and discussion
Mn adsorption ability of LAB strains from different sources
With the initial 50 mg L−1 of Mn ions, the Mn adsorption abilities of the 34 LAB strains are shown in Fig. 1. There are obvious differences between the LAB strains, with the Mn removal efficiencies of ranging from 4.91% to 24.34%. The standard of Mn clearance rate was set at >18% for ensuring a higher Mn removal efficiency of screened LAB strain. As a result, the LAB strains L. bulgaricus CCFM29, L. plantarum CCFM200, 405, 435, 436, 548, 579, L. rhamnosus CCFM492, L. gasseri CCFM15, L. casei CCFM9, and B. bifidum CCFM16 were screened out. Seven strains had an Mn clearance rate of 20.0%, while L. plantarum CCFM436 had the highest Mn adsorption of 24.34%. To further demonstrate the removal efficiencies of the preliminary obtained 11 LAB strains, a binding assay was conducted using a higher initial Mn concentration (100 mg L−1). A varied Mn-adsorption ability exists under different Mn concentrations (see Fig. 1B). However, L. plantarum CCFM436 continued to show the best binding capacity, indicating a better Mn binding ability although under a higher Mn stress. Related research about Mn biosorption by LAB strains was very limited. Compared to other bacterial Mn-adsorption reports, the maximum uptake of Aspergillus tamarii system as 46.99% with 5 mg L−1 initial concentration.27 Considering their comparatively higher Mn adsorption ability, these 11 LAB strains were used in further analysis experiment (antioxidative activity and tolerance).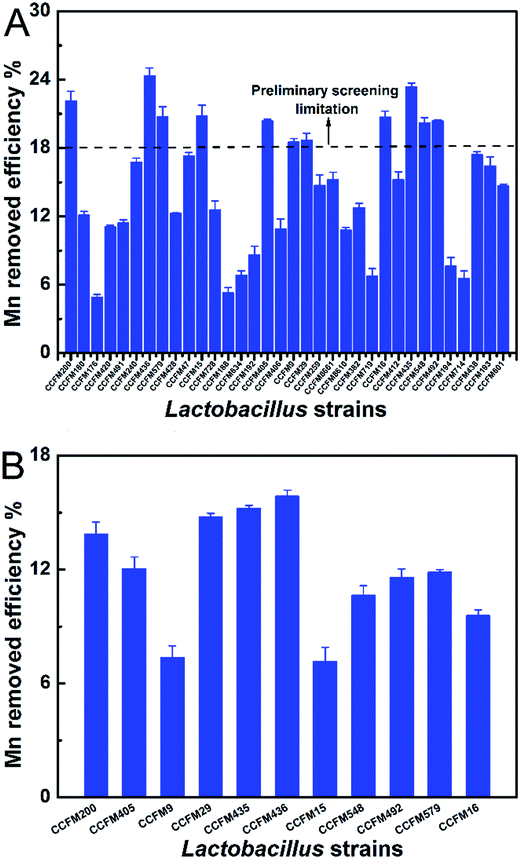 | ||
| Fig. 1 Mn ability of LAB strains in different Mn concentrations of 50 mg L−1 (A) and 100 mg L−1 Mn2+ (B). Values are mean ± SEM of three determinations. | ||
Antioxidative activity and tolerance of the LAB strains
Functional verification of the surface groups in Mn adsorption
| R–NH2 + MnX → R–NH2·Mn–X | (1) |
| R–COOH + Mn(OH)+ ↔ (R–COO)–MnOH + H+ | (2) |
| R–COOH + Mn2+ ↔ (R–COO)2–Mn + 2H+ | (3) |
| R–HPO4/R–H2PO4 + Mn2+ → (R–PO4)2−–Mn + 2H+ | (4) |
![[double bond, length as m-dash]](https://www.rsc.org/images/entities/char_e001.gif) O stretching and O–H stretching groups were generally involved in the metal biosorption.20,30 The FTIR spectrum displayed a number of absorption peaks at 1030, 1220, 1390, 1530, 2920, and 3270 cm−1. Under higher Mn stress, more complicated peaks were found due to the increased derivatives. The characterized amide group absorption peak movement occurred at 1570–1510 cm−1 (1536 cm−1), indicating the functional amino group of the protein adsorbed Mn ions to some extent. Changes in the carboxyl group have caused multiple absorption peaks at 915–995, 1440–1210, 1760–1685, and 3300–2500 cm−1 (especially C
O stretching and O–H stretching groups were generally involved in the metal biosorption.20,30 The FTIR spectrum displayed a number of absorption peaks at 1030, 1220, 1390, 1530, 2920, and 3270 cm−1. Under higher Mn stress, more complicated peaks were found due to the increased derivatives. The characterized amide group absorption peak movement occurred at 1570–1510 cm−1 (1536 cm−1), indicating the functional amino group of the protein adsorbed Mn ions to some extent. Changes in the carboxyl group have caused multiple absorption peaks at 915–995, 1440–1210, 1760–1685, and 3300–2500 cm−1 (especially C![[double bond, length as m-dash]](https://www.rsc.org/images/entities/char_e001.gif) O 1634 cm−1; C–H 3274 cm−1) due to the stretching vibration of a carboxyl group with Mn ion complexation or the ion exchange effect. In addition, the peak of 1020–1050 cm−1, which is closely related to the polysaccharide backbone, showed a slight vibration after adsorbing a certain degree of displacement. This vibration occurs because the electron cloud density of functional groups is reduced by the complex interaction between the oxygen atom of the polysaccharide structure and metal ions, which further changes their vibration frequency and intensity. According to the FTIR results, the heavy metal ion uptake occurs via –OH and –NH groups of Aspergillus tamarii biomass.27 In addition, FTIR analysis demonstrated that the groups of O–H, C–O, C
O 1634 cm−1; C–H 3274 cm−1) due to the stretching vibration of a carboxyl group with Mn ion complexation or the ion exchange effect. In addition, the peak of 1020–1050 cm−1, which is closely related to the polysaccharide backbone, showed a slight vibration after adsorbing a certain degree of displacement. This vibration occurs because the electron cloud density of functional groups is reduced by the complex interaction between the oxygen atom of the polysaccharide structure and metal ions, which further changes their vibration frequency and intensity. According to the FTIR results, the heavy metal ion uptake occurs via –OH and –NH groups of Aspergillus tamarii biomass.27 In addition, FTIR analysis demonstrated that the groups of O–H, C–O, C![[double bond, length as m-dash]](https://www.rsc.org/images/entities/char_e001.gif) O–C and C–O–C of Arthrobacter ps-5 were the main functional groups in the biosorption of Cu2+, Pb2+ and Cr6+.14 Based on the result of group shielding and FTIR analysis, the amino and carboxyl groups were found to play an important role in the Mn adsorption process.
O–C and C–O–C of Arthrobacter ps-5 were the main functional groups in the biosorption of Cu2+, Pb2+ and Cr6+.14 Based on the result of group shielding and FTIR analysis, the amino and carboxyl groups were found to play an important role in the Mn adsorption process.Intracellular Mn homeostasis mechanism from the amino acid and transcriptional levels of the transporter genes
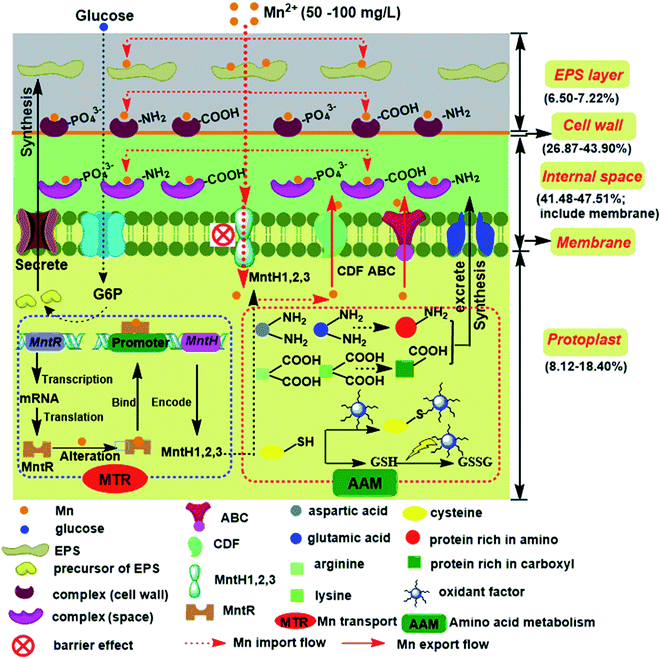
qRT-PCR was used to determine the roles the genes played in Mn transport from the transcription levels (Fig. 5C). Under a 50 mg L−1 Mn concentration, the transcriptional levels of MntH 1–3 were significantly decreased, but the mRNA of the MntR gene increased. MntR was shown to be a transcriptional regulator that could bind two Mn atoms in Mn-replete cells, and the transcription of MntHs was repressed by the MntR:Mn2+ form, thereby the decreasing expression of MntHs.35 Under a 100 mg L−1 Mn concentration, the transcriptional levels of MntH 1–3 continuously decreased, but the rate of decline was lower. Mn transporters may be primarily responsible for transporting Mn to the intracellular of L. plantarum CCFM436. It was reported that a single operon encoding a manganese-dependent repressor protein (MntR) could mediate Mn tolerance in a concerted fashion by changing the affinity between MntR and the cis-regulatory element (negative regulation model).34,35 An overview of the potential Mn-adsorption components and internal homeostasis mechanism involved in L. plantarum CCFM436 during the Mn adsorption process is summarized in Fig. 6 based on the above results.
Conclusion
Based on the analysis of the Mn binding ability, antioxidative activity and tolerance in simulated gastrointestinal conditions, L. plantarum CCFM436 was screened from 34 isolates for its Mn-adsorption potential. The most Mn adsorption efficiency (82–92%) was contributed by extracellular components (extracellular polysaccharides, cell wall, space and membrane). Both of chemical masking treatment and FTIR analysis demonstrated that the amino and carboxyl groups on the cell surface made the greatest contribution to the efficiency of Mn adsorption. HPLC analysis of the intracellular free amino acids indicated that aspartic, glutamic, arginine, lysine, and cysteine might participate in the Mn homeostasis mechanism. With the PCR/sequencing and qRT-PCR analysis, the manganese transport operon (mntr) and manganese transporters (mnth1/mnt2/mnt3) were identified, and MntH 1–3 were the potential Mn importers (negatively regulated by MntR). These results suggest that L. plantarum has a great potential to act as a novel reference to alleviate Mn toxicity in food application.Acknowledgements
This work was supported by State Key Program of National Natural Science Foundation of China (No. 31530056), the Science and Nature Foundation of Jiangsu Province (No. BK 20160169), the Jiangsu Province Postdoctoral Science Foundation Funded Project (No. 1601183C), the China Postdoctoral Science Foundation Funded Project (No. 2015M581727), the 111 Project B07019, the Program for Changjiang Scholars and Innovative Research Team in University (IRT1249), and the Program of Collaborative innovation center of food safety and quality control in Jiangsu Province.Notes and references
- L. Stefanie O'Neal, J. W. Lee, W. Zheng and J. R. Cannon, NeuroToxicology, 2014, 44, 303–313 CrossRef PubMed.
- B. A. Eijkelkamp and C. A. McDevitt, BioMetals, 2015, 28, 491–508 CrossRef CAS PubMed.
- X. Zhang, H. H. Yang and Z. J. Cui, RSC Adv., 2016, 6, 27963–27968 RSC.
- M. E. kady, H. Shokryc and H. Hamad, RSC Adv., 2016, 6, 82244–82259 RSC.
- J. M. Williams, D. Milatovic, J. C. Gore, M. Aschner and M. J. Avison, Toxicol. Sci., 2010, 114, 310–322 CrossRef CAS PubMed.
- K. Blecharz-Klin, A. Piechal, I. Joniec-Maciejak, J. Pyrzanowska and E. Widy-Tyszkiewicz, Toxicol. Appl. Pharmacol., 2012, 265, 1–9 CrossRef CAS PubMed.
- J. S. Schneidera, C. Williamsa, M. Aulta and T. R. Guilarte, NeuroToxicology, 2015, 48, 217–222 CrossRef PubMed.
- ATSDR, retrieved from, http://www.atsdr.cdc.gov/toxguides/toxguide-151.pdf, accessed 21.01.15, 2012.
- J. N. Bhakta, K. Ohnishi, Y. Munekage, K. Iwasaki and M. Q. Wei, J. Appl. Microbiol., 2012, 112, 1193–1206 CrossRef CAS PubMed.
- E. J. Gudiña, E. C. Fernandes, J. A. Teixeira and L. R. Rodrigues, RSC Adv., 2015, 5, 90960–90968 RSC.
- J. R. Broadbent, R. L. Larsen, V. Deibel and J. L. Steele, J. Bacteriol., 2008, 192, 2445–2458 CrossRef PubMed.
- S. Das, H. R. Dash and J. Chakraborty, Appl. Microbiol. Biotechnol., 2016, 100, 2967–2984 CrossRef CAS PubMed.
- S. V. Dilna, H. Surya, R. G. Aswathy, K. K. Varsha, D. N. Sakthikumar, A. Pandey and K. M. Nampoothiri, LWT--Food Sci. Technol., 2015, 64, 1179–1186 CrossRef CAS.
- S. H. Ye, M. P. Zhang, H. Yang, H. Wang, S. Xiao, Y. Liu and J. H. Wang, Carbohydr. Polym., 2014, 30(101), 50–56 Search PubMed.
- H. An, F. P. Douillard, G. Wang, Z. Zhai, J. Yang, S. Song, J. Cui, F. Ren, Y. Luo, B. Zhang and Y. Hao, Mol. Cell. Proteomics, 2014, 13, 2558–2572 CAS.
- Q. X. Zhai, F. W. Tian, G. Wang, J. X. Zhao, X. M. Liu, K. Cross, H. Zhang, A. Narbad and W. Chen, RSC Adv., 2016, 6, 5990–9997 RSC.
- J. L. Xing, G. Wang, Z. N. Gu, X. M. Liu, Q. X. Zhang, J. X. Zhao, H. Zhang, Y. Q. Chen and W. Chen, RSC Adv., 2015, 5, 37626–37634 RSC.
- L. L. Yu, Q. X. Zhai, X. M. Liu, G. Wang, Q. X. Zhang, J. X. Zhao, A. Narbad, H. Zhang, F. W. Tian and W. Chen, Appl. Microbiol. Biotechnol., 2016, 100, 1891–1900 CrossRef CAS PubMed.
- F. W. Tian, Y. Xiao, X. X. Li, Q. X. Zhai, G. Wang, Q. X. Zhang, H. Zhang and W. Chen, PLoS One, 2015, 10, 143318–143333 Search PubMed.
- A. Hernandez, D. Guzman and H. Garcia, J. Appl. Microbiol., 2009, 107, 395–403 CrossRef PubMed.
- H. Teemu, S. Seppo and M. Jussi, Int. J. Food Microbiol., 2008, 125, 170–175 CrossRef CAS PubMed.
- S. K. Das, A. R. Das and A. K. Guha, Environ. Sci. Technol., 2007, 41, 8281–8287 CrossRef CAS PubMed.
- S. S. Majumdar, S. K. Das and T. Saha, Colloids Surf., B, 2008, 63, 138–145 CrossRef CAS PubMed.
- R. Chakravarty and P. C. Banerjee, Bioresour. Technol., 2012, 108, 176–183 CrossRef CAS PubMed.
- K. Senouci-Rezkallah, P. Schmitt and M. P. Jobin, Food Microbiol., 2011, 28, 364–372 CrossRef CAS PubMed.
- S. F. Muhd Radzi, C. Ruckert, S. S. Sam, B. T. Teoh, P. F. Jee, W. H. Phoon, S. Abubakar and K. Zandi, Sci. Rep., 2015, 5, 14007, DOI:10.1038/srep14007.
- K. M. H. Mata, O. M. Amaya, M. T. C. Barragan, F. J. A. Tapia and E. A. Felix, Int. J. Photoenergy, 2013, 578729 Search PubMed.
- Q. X. Zhai, R. J. Yin, L. L. Yu, G. Wang, F. W. Tian, R. P. Yu, J. X. Zhao, X. M. Liu, Y. Q. Chen, H. Zhang and W. Chen, Food Control, 2015, 54, 23–30 CrossRef CAS.
- R. Chakravarty and P. C. Banerjee, Extremophiles, 2008, 12, 279–284 CrossRef CAS PubMed.
- M. Feng, X. Chen, C. Li, R. Nurgul and M. Dong, J. Food Sci., 2012, 77, T111–T117 CrossRef CAS PubMed.
- R. J. Yin, Q. X. Zhai, L. L. Yu, Y. Xiao, G. Wang, R. P. Yu, F. W. Tian and W. Chen, Eur. Food Res. Technol., 2016, 242, 1621–1629 CrossRef CAS.
- K. Parvathi, R. Nareshkumar and R. Nagendran, Environ. Technol., 2007, 28, 779–784 CrossRef CAS PubMed.
- T. E. Gunter, B. Gerstner, K. K. Gunter, J. Malecki, R. Gelein, W. M. Valentine, M. Aschner and D. I. Yule, NeuroToxicology, 2013, 34, 118–127 CrossRef CAS PubMed.
- K. Hantke, Curr. Opin. Microbiol., 2001, 4, 172–177 CrossRef CAS PubMed.
- Z. Ma, F. E. Jacobsen and D. P. Giedroc, Chem. Rev., 2009, 109, 4644–4681 CrossRef CAS PubMed.
| This journal is © The Royal Society of Chemistry 2016 |

