DOI:
10.1039/C6RA23099G
(Paper)
RSC Adv., 2016,
6, 108777-108790
Corrosion inhibition of X70 sheets by a film-forming imidazole derivative at acidic pH
Received
16th September 2016
, Accepted 2nd November 2016
First published on 8th November 2016
Abstract
The anticorrosion potential of a chemisorbed film formed from 3-imidazol-1-ylpropan-1-amine (IMPA) against the degradation of X70 steel in 1 M HCl has been investigated using electrochemical impedance spectroscopy (EIS) and potentiodynamic polarization techniques. IMPA has been found to reduce the corrosion of X70 in the aqueous medium at pH 0 to a great extent; an inhibition efficiency (IE%) up to 90% has been achieved for 500 ppm IMPA concentration at room temperature. Corrosion inhibition by IMPA is concentration-dependent and becomes more stable by virtue of adsorption of IMPA film on the X70 substrate. This adsorption phenomenon has been probed by scanning electron microscopy (SEM), atomic force microscopy (AFM) and infra-red (IR) spectroscopy. The formation of this film on the X70 surface fosters improved impedance against the flow of ionic currents of corrosive ions and molecules. IMPA acted as a mixed-type film-forming inhibitor as demonstrated from the results of potentiodynamic scans. The mechanism of X70 corrosion inhibition has been proposed using quantum structure/activity relations to explain the extent of influence of the molecular structure of IMPA on the corrosion inhibition of the IMPA film.
1. Introduction
Crude oil and gas products transported through various pipelines have an impact on the inner walls, thereby degrading them. Even when pretreated to remove potential impurities, the residual portions of these unwanted chemicals in crude products still adversely affect the integrity of pipelines due to corrosion processes. In the gaseous forms, some of these impurities (not limited to CO2, H2S, etc.) are dissolved into the aqueous phase, and this results in a subsequent decrease in the pH of the medium, and metal degradation is accelerated.1 To increase the efficiency of hydrocarbon transportation through steel-based pipelines and safeguard them against spillage, oil and gas industries are now implementing various corrosion control procedures to alter the corrosion dynamics. The use of organic corrosion inhibitors in control internal degradation of pipelines transporting hydrocarbons is popular and has been widely reported in the last decade due to ease in application and unique chemistries/economics of repairs. Film-forming organic compounds are generally effective due to their ability to form protective passive layers of metal surfaces, thereby reducing corrosion rate. Their efficiency is also affected by the composition of the corrosive environments, shear stress and temperature induced by the flow contents of the pipeline.1,2
To enhance oil recovery, some oil companies deploy “well acidizing” methods; a collection of recovery techniques where oil stimulation is initiated by injecting acid mixtures and custom acid blends through carbon steel tubing to the reservoir rocks. The penetration of these oxidizing mixtures through the rock pores at some defined pressures dissolve mud-solids and sediments thereby facilitating the flow of oil.2,3 Both pure forms and acid mixtures have been deployed in acidization process; including mineral acids (e.g. HCl) and the organics (e.g. CH3COOH). Unfortunately, the presence of these acids also initiates aggressive attack on steel tubing, and in the process, slowly degrading these materials. To reduce the rate of internal corrosion, the introduction of corrosion inhibitor molecules is pertinent.4 Most film-forming inhibitor molecules function by isolating metal surfaces from corrosive ions, and in the process, reducing their rate of corrosion. Iron and iron alloys as materials for pipeline fabrications will degrade and spill their contents if the corrosion is not reduced; they are also capable of undergoing compositional transformation at some pressure and temperature.5 Over the years, the use of imidazoles in most corrosion inhibition formulations for oil-field applications has resulted in increased productivity. These film-forming compounds also represent an environmental-friendly class of corrosion inhibitors for API pipeline steels. Imidazoles are among the class of nitrogen-bearing organic compounds with effective corrosion inhibition potentials due to the unique electronic π-orbital characters and electron density around their basic N-heteroatoms.6 These N-heteroatoms serve as active adsorption sites where the probability of electron pair transfer to metallic orbitals is high: hence, their mechanism of corrosion inhibition. Imidazoles are green compounds and are safe substitutes to the highly toxic corrosion inhibitor compounds (e.g. chromates, vanadates, arsenates, etc.) that are deployed as additives in most anticorrosion formulations. Their potential for corrosion inhibition increases as the imidazole moieties are substituted with alkyl or aryl functional groups. They also possess unique aromatic characters that allows for chemical modification in order to enhance metal surface interaction.7
Recently, several researchers worldwide have investigated the effectiveness of imidazole/imidazole derivatives and their ionic liquids in acid medium for some metal substrates. For example, El-Haddad and Fouda8 have reported the use of imidazole (IM) and methyl imidazole (IMI) as inhibitors against the corrosion of aluminum (99.99% Al) in 0.5 M HCl. These compounds were found to be mixed-type corrosion inhibitor systems (though predominantly cathodic) with IMI being the most effective inhibitor. A magnitude of corrosion inhibition efficiency (IE%) up to 76% was recorded for 18 × 10−5 M IMI compared to 70% observed for IM at the same concentration. The corrosion inhibition of AIAI 316L steel in 0.5 M H2SO4 by N-methyl-N′-(2-{[(4-methyl-1H-imidazol-5-yl)methyl]thio}ethyl)thiourea has also been reported.9 More than 80% (IE%) was recorded for 8 μM concentration of this compound at room temperature. Corrosion inhibition in the presence of this compound was attributed to the formation of a protective thin film on the metal surface; this was confirmed by scanning electron microscopy (SEM) and atomic force microscopy (AFM) techniques. Rao and Reddy10 have also reported the effectiveness of self-assembling (SA) of 1-octadecyl-1H-imidazole film on copper in 0.02 M NaCl. Up to 99.9% IE% was achieved for copper substrate with SA film prepared from 0.20 M concentration of the imidazole compound after an hour immersion period in the saline electrolyte at 30 °C. Abdallah et al.11 have investigated the synergistic effect of Fe (from Fe2(SO4)3) ion additive on the corrosion inhibition of carbon steel (L52) in the presence of imidazole in 0.5 M H2SO4. Improved corrosion inhibition was observed in the presence of both compounds combined, when compared to each of them at the same experimental condition. This synergy in corrosion inhibitions from both compounds was attributed to the formation of Fe–imidazole type complex on the metal surface.
However, the use of imidazole derivatives, especially those with multiple adsorption sites, as corrosion inhibitors for X70 pipeline steel in stimulated acid media is scanty.12 To the best of our knowledge, there is no available report on the anticorrosive properties of 3-imidazol-1-ylpropan-1-amine (IMPA) in 1 M HCl; so, as our contribution to the study of corrosion inhibition systems for metals with potential film-forming abilities, the present work reports the use of IMPA as corrosion inhibitor for X70 steel substrate. The corrosion resistance of the film is investigated electrochemically and also complemented with the study of the charged metal/solution interface. We have also explored the molecular/electronic structure of IMPA with focus on the contributions of its molecular properties on corrosion inhibition. Limited studies on the inhibition of X70 corrosion have been reported for a number of corrosive media using different corrosion inhibition systems: NaNi(H2PO3)3·H2O in saline produced water;13 rare earth metals in 3.5 wt% NaCl;14 methyl acrylate/N-alkylpyridinium bromide in 5 M HCl;15 thiourea in CO2 saturated NaCl medium;16 N-alkyl-4-(4-hydroxybut-2-ynyl)pyridinium bromides in 5 M HCl;17 and methyl acrylate/N-cetylpyridinium bromide in N-cetyl-3-(2-methoxycarbonylvinyl)pyridinium bromide in 5 M HCl.18
2. Experimental
2.1. Materials and regents
API X70 (with composition reported elsewhere19,20) was deployed in this study as the working electrode. The steel was cut into sheets with 3 × 3 × 1 cm dimension from a large X70 pipeline strip (Fig. 1). The X70 sheets were then polished with emery papers: from the roughest to the finest available grits (from #4000 to 100) before sonicating in 50% ethanol, dried and stored in a desiccator. Every polished sheet needed for respective corrosion test was taken from this collection. All corrosion tests were conducted in 1 M HCl (pH 0), prepared from HCl stock (Fisher Scientific, Canada). IMPA (more than 97% purity) was deployed as the organic inhibitor against acid-assisted X70 degradation at room temperature. IMPA was used as received without further purification; four concentrations between 50 and 500 ppm were prepared from using 1 M HCl as the stock solution. The 13C nuclear magnetic resonance (NMR) spectral data of IMPA is given as: 13C NMR (CDCl3) δ (ppm): 34.4 (CH2), 38.5 (CH2), 44.3 (CH2), 118.3 (CH), 129.4 (CH), 137.3 (CH).
 |
| Fig. 1 (a) A sample of X70 pipeline steel strip used as the metal substrate in this study; (b) the dimension and appearance of the X70 pre-cut sheets before polishing [the arrows show rolling direction]. | |
2.2. Electrochemical measurements
The electrochemical tests in this study were conducted in accordance with the ASTM G3-89 standards21 using a ParaCell™ electrochemical cell kit (three electrode system) connected to a Potentiostat/Galvanostat/ZRA (Interface 1000, Gamry Instruments, US). Every collected experimental data were analyzed using the Gramy software. The polished X70 sheets served as the working electrodes (surface area of approx. 3 cm2), while the graphite and saturated calomel electrode (SCE) were used as counter and reference electrodes, respectively. Measured electrode potentials throughout the test sessions were done relative to SCE. Prior to every test, the X70 sheets were completely immersed in the acidic test electrolytes for 1 h in order for the substrates to equilibrate with the test solutions while attaining stable open circuit potential (Eoc). Electrochemical impedance spectroscopy (EIS) was conducted by applying a small amplitude perturbation (10 mV) between a frequency range, 100 kHz to 100 mHz, using an alternative current (ac) signal at Eoc. Due to the destructive nature of the potentiodynamic polarization technique, it was conducted after EIS in order to avoid surface-related influences on the morphology of the substrate. With it, Tafel curves were collected at a potentiodynamic scan rate of 0.5 mV s−1 between −0.25 V and +0.25 V relative to Eoc. The curves presented in this study are from respective tests using different X70 sheets without replacement in order to avoid interferences from previous measurements.9
2.3. Surface analysis
Series of experiments were further conducted to complement the electrochemical corrosion analyses of the X70 sheets in both blank solution (1 M HCl) and in the presence of the highest concentration of IMPA (500 ppm).
2.3.1. SEM and AFM studies. Pre-cleaned X70 sheets were completely immersed in the acid test electrolyte (1 M HCl) with and without 500 ppm IMPA for 72 h at room temperature in order to comparatively study their morphologies. After this immersion period, each steel sheet was twice rinsed with water before air-drying at room temperature. The morphologies of the surfaces in the presence and the absence IMPA were recorded with SEM (Hitachi SU6600 scanning electron microscope, Hitachi High Tech., Japan) and AFM (PicoSPM instrument [Molecular Imaging, USA]) techniques. The AFM of the surfaces was operated in intermittent contact mode.
2.3.2. Fourier transform infra-red (FTIR) spectroscopy. After the immersion of the X70 sheet in the acid solution containing 500 ppm within the test period reported for the AFM and SEM studies, the adhering corrosion product was analyzed for its functional group chemistry. This allowed for the probing of the possibility of adsorption of IMPA molecules on the surface of X70. The FTIR spectrum obtained from the adhering corrosion product was compared to the pure IMPA compound after recording them at 16 scans with a Bio-RAD FTS-40 spectrophotometer (Bio Rad, US).8,22 The IR spectra for these samples, the pure IMPA and its adsorb film, were collected in transmittance mode between 400–4000 cm−1 with a resolution of 8 cm−1. The IMPA absorbed film was neatly scraped from the surface of X70 coupon and then made into KBr pellet; similar operation was deployed for pure IMPA in a different trail. For the film, the IR spectrum was the same as if directly recorded from the film on X70 using a different sample chamber.
2.4. Quantum chemical study
The molecular structure of the inhibitor compound (IMPA) in this study was built with a HyperChem® (Professional version 8.0.10, Hypercube Inc., USA) tool. Selected quantum chemical parameters related to the spatial molecular structures and properties of IMPA as a corrosion inhibitor were computed. Full geometric optimization was also performed with the semi-empirical parameterization [Method 3 (PM3)] approach using the Polar-Ribiere (maximum of 32
650 cycles of conjugate gradient) algorithm with a convergence set of 0.001 kcal Å−1 mol−1 RMS gradient.23 All computations were conducted at the Restricted Hartree–Fock (RHF) level. Some quantum chemical descriptors were then obtained, but not restricted to: energies associated with the highest occupied molecular orbital (EHOMO) and lowest unoccupied molecular orbital (ELUMO), energy gap (ΔE = ELUMO − EHOMO), total energy, dipole moment (μ), and atomic Mulliken charge distribution.24 Koopman's theorem (Tjalling Koopmans, 1934) clearly postulates that in closed-shell Hartree–Fock theory, certain quantum parameters e.g. ionization potential (I), electron affinity (A), chemical hardness (η), electronegativity (χ), global chemical softness (σ) electrophilicity (ω) and nucleophilicity (ε) can be correlated with the frontier orbital energies,18,25 hence:
The magnitudes of χ, η, σ, ω and ε can then be derived from eqn (3)–(7):
|
 | (3) |
|
 | (4) |
|
 | (5) |
|
 | (6) |
|
 | (7) |
The fraction of electrons transferred (ΔN) transferred from IMPA during the molecular interaction with iron was also computed for (eqnn (8)):18,24,26
|
 | (8) |
In this equation, the magnitudes of χFe and ηFe (global hardness of bulk iron) are 7 eV mol−1 and 0 eV mol−1, respectively. This section was designed to theoretically correlate the electronic structure and molecular properties of IMPA with the compound's potential for corrosion inhibition. Previous studies have also revealed satisfactory results with the use of similar semi-empirical approach for some other corrosion inhibition systems with organic molecules using the HyperChem program 24,27–29.
3. Results and discussion
3.1. Electrochemical analyses
The trend of changes in the electrochemical results for X70 corrosion in 1 M HCl in the presence of IMPA will first be discussed in the following section, and then by means of surface analytical measurements.
3.1.1. Measuring open circuit potential (Eoc). Before the EIS measurements, the variation in Eoc for every second up to an hour was measured for X70 substrate immersed in 1 M HCl with and without IMPA. Associated Eoc vs. time curves for X70 in 1 M HCl solution alone and in the presence of 50 and 500 ppm IMPA at room temperature are presented in Fig. 2. Without the inhibitor molecules, the curve for X70 starts just above −0.69 V and increases sharply until 250 s after which it builds up gradually until the 3600th second. On the other hand, with both concentrations of IMPA chosen for this study (50 and 500 ppm IMPA), the Eoc vs. time curves are observed to be more positive compared to X70 in the blank acid solution. Both curves for the inhibitor systems display stable plateau throughout the observed period of study; with the curve for 500 ppm being the most positive. From this result, we can deduce that more direct shifts in Eoc for X70 are possible upon increased IMPA concentration in 1 M HCl. And with a steady state Eoc value achieved up to 3600 s, an hour immersion period was chosen as the optimum immersion time for all tests involving electrochemical measurements in this study. This unique electrochemical behaviour observed for X70 in the presence of IMPA reveals an evidence of molecular adsorption on the metal surface with improved corrosion protection at prolonged immersion period.4,30,31 Most researchers have further classified corrosion inhibitor systems on the basis of shifts in Eoc values relative to the blank solution, especially when their magnitudes are within ±85 mV for most metal substrates.4,30–32
 |
| Fig. 2 Eoc vs. time (s) plots for X70 substrate immersed in 1 M HCl solution alone and in the acid medium containing the least and highest concentrations of IMPA deployed in the study. | |
3.1.2. EIS results. The electrochemical response of the X70/HCl system in IMPA was examined using EIS technique; the impedance curves obtained for each concentration of IMPA relative to the blank (1 M HCl) solution are presented in Fig. 3. The Nyquist plots (Fig. 3a) represented are relatively depressed one-time constant curves with capacitive loops equally shaded into semi-circles with varying diameters; curves with larger diameters were attained at higher concentration of IMPA relative to the blank solution for X70 steel. The depressed capacitive loops could be related to inherent X70 surface unevenness consistent with dispersion effects. The possibility of unchanged corrosion mechanism in the presence of IMPA could also be the reason why the Nyquist curves possess “arch-like” shapes.4,8 Some authors have discoursed that the observed depressions on the curves, though common amongst metal-type solid electrodes, could be also be caused by adsorption phenomenon associated with inhibitor mass-transfer or the steady formation of porous films of these electrodes.4,33,34 The observed widening of the Nyquist curve diameters with increasing inhibitor concentrations also denotes the formation of protective films of the inhibiting molecules on the metal surface. This must have been initiated by a charge transfer process controlling the corrosion of X70 substrate in HCl.35,36 Such trend is also reproduced in the impedance modulus and phase angle plots (Fig. 3b). The primary axis displays a steady increase in the impedance modulus (Zmod) of the charged interface due to IMPA adsorption, especially at low frequencies. The variation of Zmod and the frequency seems to be indistinct at the higher frequency region, but soon begins to phase out mid-way between 10 and 1000 Hz. At lower frequency, the impedance of varying concentration of IMPA is distinct and is greater for acid solution with more molecules of IMPA, and this is consistent with corrosion inhibition. Magnitude of Zmod up to 564 Ω cm2 is attained for 500 ppm IMPA against 58 Ω cm2 recorded for the bank acid (1 M HCl) solution at 0.1 Hz. The Bode phase angle (secondary axis) curves are all “minima” at mid-frequency though more negative values of Zphz are recorded at higher concentrations of IMPA; denoting corrosion inhibition.
 |
| Fig. 3 Nyquist (a) and Bode (b) [modulus (primary axis) and phase angle (secondary axis)] plots for X70 steel substrate immersed in 1 M HCl in the absence and presence of different concentrations of IMPA at room temperature; the legends in square brackets [ ] show data from Bode phase angle plot on the secondary axis. | |
To further explain the X70 corrosion system in the presence of IMPA, appropriate equivalent Randle circuit model (Fig. 4) was fitted to the experiment data displayed in the impedance plots. The Nyquist curves in Fig. 3a reveals that the obtained experimental data best fit the circuit model for each system. The EIS parameters collected from the circuit model for X70 immersed for different concentrations of IMPA and the blank (1 M HCl) solution are presented in Table 1. These parameters represent the perceived electrochemical behaviour of the metal/solution interface as well as the reactions occurring on the electrode surface. In the proposed circuit model, a “constant phase element (CPE)” component was introduced to account for the surface unevenness/inhomogeneity as previously discussed in ref. 37 and 38. Rs and Rct components of the circuit represent the magnitudes of solution and charge transfer resistance, respectively, while the impedance of CPE (ZCPE) is mathematically expressed in eqn (9).
 |
| Fig. 4 The equivalent circuit model deployed in fitting the experimental impedance data (adopted from EChem Analyst's circuit model editor). | |
Table 1 Impedance parameters for X70 steel in 1 M HCl containing different concentrations of IMPA at room temperature
Systems (ppm) |
Rs (Ω cm2) |
Rct (Ω cm2) |
CPE |
Cdl (μF cm−2) |
IE% |
Yo (μF cm−2 s−(1−αc)) |
α |
Blank (1 M HCl) |
3.32 |
50.34 |
337.10 |
0.80 |
212.51 |
— |
50 |
2.92 |
139.00 |
238.60 |
0.85 |
119.92 |
63.79 |
100 |
2.45 |
320.80 |
146.50 |
0.86 |
90.39 |
84.31 |
300 |
3.81 |
469.20 |
129.40 |
0.84 |
77.42 |
89.27 |
500 |
3.56 |
583.60 |
105.10 |
0.87 |
71.26 |
91.37 |
In this equation, Yo is a constant of proportionality associated with the properties of surfaces and electroactive species; j is imaginary and could also be expressed as the square root of negative one; fmax is the value of frequency at maximum impedance (easily extrapolated from the Nyquist curve); ω is the angular frequency (ω = 2πf; measured in rad s−1). The quantity α is associated with phase shift (−1 ≤ α ≤ 1) and its magnitude explains the characteristics of the metal/solution interface. The values of α obtained in this study are relatively higher and close to unity for IMPA in 1 M HCl. This trend is consistent with reduced metal surface heterogeneity due to the formation of protective inhibitor films and the distribution of dielectric relaxation times in frequency space.4
The variation of electrochemical parameters at varying concentrations of IMPA relative to the blank for X70 steel are displayed on Table 1, and it could also be observed that values of Rs are similar. The introduction of IMPA to the solution of the acid electrolyte had a remarkable effect on the metal substrate; this is reflected by a steady increase in the magnitude of Rct in line with the diameter of the Nyquist curve diameters in Fig. 3a. Increase in Rct denotes reduced rate of corrosion reaction at the metal/solution interface; hence, it is a measure of corrosion inhibition.4,33 According to Obot and Madhankumar,39 the reason for the increase in Rct with increased inhibitor concentration could also be attributed to the formation of protective layer on the metal surface that in turn decreased the rate of metal dissolution in the acid electrolyte. Magnitudes of Rct up to 469 and 584 Ω cm2 are attained for 300 and 500 ppm IMPA as against 50 Ω cm2 obtained for the bank acid solution. Unlike the Rct, values of double layer capacitance (Cdl) are observed to decrease with IMPA concentration and the highest value is recorded for X70 substrate immersed in the blank solution. The decrease in the magnitude of Cdl suggests the adsorption of molecules of the inhibitor on the metal surface. Some authors40,41 have suggested that this trend also corresponds to:
“a possible decrease in the dielectric constant and/or an increase in the thickness of protective double-layer initiated by the adsorption of inhibitor molecules; and the displacement of adsorbed water molecules at the metal/solution interface”.
Cdl is culled from the Helmholtz equation (eqn (10)) and relates to the interfacial electrical double layer structure; it was computed from eqn (11). An attempt was also made to compute the inhibition efficiency (IE%) for every concentration of IMPA in this study using eqn (12). The corresponding values of IE% are presented in Table 1; it can be observed that IE% increases with IMPA concentration up to 64 and 91% for 50 and 500 ppm, respectively.
|
 | (10) |
|
Cdl = Yo(2πfmax)(α−1)
| (11) |
|
 | (12) |
In these equations, ε and εo are the dielectric constant of the medium and vacuum permittivity, respectively; A is the area of the electrode and δ is the thickness of the protecting layer on steel; fmax is the value of frequency at maximum impedance; R0ct and Rct represents the magnitudes of charge transfer resistance respectively in the absence and presence of the IMPA.
3.1.3. Potentiodynamic polarization measurements. The Tafel curves obtained from the dc experiments for X70 immersed in 1 M HCl solution in the absence and presence of different concentrations of IMPA are displayed in Fig. 5. From these curves, the values of corrosion current density (icorr), corrosion potential (Ecorr), anodic (βa) and cathodic Tafel (βc) slopes were obtained by Tafel fitting and these data are presented in Table 2. Linear Tafel fitting for curves of every system under study was performed after remotely selecting portions on the anodic and cathodic branches and extrapolating to Ecorr in order to obtain the magnitudes of icorr. An increment in the amounts of IMPA in the acid electrolyte resulted in a steady reduction in the values of icorr, relative to the blank solution. The magnitude of icorr of X70 in 1 M HCl containing the lowest concentration of corrosion inhibitor (50 ppm IMPA) stands at 99.10 μA cm−2 but further reduces to 20.64 μA cm−2 as the concentration increases to 500 ppm in the same acid corrodent. The values of icorr for X70 in the blank solution is 60% higher than that of the same metal substrate in 50 ppm IMPA in 1 M HCl. This is indicative of corrosion reduction initiated by the selective blocking effects of adsorbed neutral and/or protonated imidazole moiety in IMPA on the X70 steel.8,39 Changes in the values of the Tafel slope (recorded here as anodic (βa) and cathodic (βc) Tafel constants) with IMPA concentration are also observed. Though the changes in the slopes do not follow defined trends (being suggestive of a mixed-type corrosion inhibitor system), the values of Ecorr also appear to trend towards more positive potentials. The magnitude of Ecorr (−483.00 mV) for X70 steel in the blank solution is closer to that of the acid solution containing 50 ppm IMPA (−477.00 mV) than the same metal in 500 ppm IMPA + 1 M HCl (−439.00 mV). This trend indicates that the adsorption of IMPA impacted both anodic and cathodic reactions of X70 corrosion process in 1 M HCl; and this is suggestive of a mixed-type corrosion inhibitor system for IMPA. Just like the EIS technique, the inhibition efficiency (% IE) of IMPA against X70 corrosion was computed for using eqn (13): |
 | (13) |
 |
| Fig. 5 Tafel curves for X70 steel substrate immersed in 1 M HCl in the absence and presence of different concentrations of IMPA at room temperature. | |
Table 2 Tafel parameters for X70 steel in 1 M HCl containing different concentrations of IMPA at room temperature
Systems (ppm) |
Ecorr (mV vs. SCE) |
icorr (μA cm−2) |
βa (mV dec−1) |
βc (mV dec−1) |
IE% |
Blank (1 M HCl) |
−483.00 |
328.00 |
70.20 |
133.80 |
— |
50 |
−477.00 |
99.10 |
96.10 |
100.90 |
69.79 |
100 |
−471.00 |
43.10 |
57.20 |
62.60 |
86.86 |
300 |
−465.00 |
29.90 |
135.30 |
98.00 |
90.89 |
500 |
−439.00 |
20.64 |
64.90 |
61.98 |
93.70 |
In this equation, iocorr and icorr are the magnitudes of corrosion current densities in the absence and presence of IMPA, respectively. The values of IE% are presented in Table 2, and this quantity increases with the concentration of IMPA reaching 93% for the highest concentration of IMPA (500 ppm) in this study. The trend increased values of IE% for the potentiodynamic polarization test is in good agreement with EIS results.
3.2. Surface analyses
Complementary studies using surface analytical techniques were deployed to draw attention to the possible role of surface morphology on the corrosion protection of X70 steel.
3.2.1. SEM morphology. Fig. 6 presents the SEM micrographs of the X70 substrates before (a) and after immersion in 1 M HCl for 48 h in the blank acid in the absence (b and d) and presence (c and e) of 500 ppm IMPA. The morphology of the metal surface before corrosion reveals the presence of some polishing marks (Fig. 6a) but the surface is damaged as the substrate corrodes due to the action of aggressive chloride ions in the acid solution (Fig. 6b). Some pits could also be observed on the surface of the metal (red arrows/markings) as well as some corrosion products/aggregates sparsely distributed on the steel substrate (white arrows). After the introduction of X70 into the solution of the acid electrolyte containing 500 ppm IMPA (Fig. 6c), the surface of the metal is less corroded. This could be ascribed to the formation of protective inhibitor film on steel.4,8 The reduction of the extent of damage denotes corrosion inhibition and this is largely due to the presence of the imidazole compound. Few corrosion products are also revealed on Fig. 6c. This has also been reported by Lozano et al.;42 these authors were investigating API 5LX52 corrosion in 1 M HCl in the presence of imidazole-type ionic liquids (1,3-dibenzilimidazolio acetate and 1,3-dibenzilimidazolio dodecanoate). The two immersed metal surfaces appeared rough, but to study them further, we made a topology test using AFM. Surface scans were carried out only at less corroded portions, clean enough to give relatively clear morphology using gold tips. Since the mechanism for metal corrosion reduction for organic corrosion inhibitors (e.g. the imidazoles) involves molecular adsorption and subsequent formation of protective films on the substrates, surface analysis using AFM was necessary to affirm such claims. Apart from probing the adsorbed imidazole-type protective film on X70 by chemical analyses, understanding of the surface morphology of the substrate immersed in its solution could significantly explain this interfacial phenomenon.
 |
| Fig. 6 SEM micrographs showing the surface of X70 steel before (a) and after a 48 h immersion in 1 M HCl (b) and 1 M HCl containing 500 ppm IMPA (c). Sever episodes of surface pitting are observed on the bare steel substrate in the blank solution with the adhesion of corrosion products/aggregates. The SEM micrographs on the panel below were collected at 50 μm scale from different sites on the same X70 substrates to show the appearance of the surfaces in both systems after corrosion; (d) without and (e) with 500 ppm IMPA in 1 M HCl. | |
3.2.2. Surface analysis with AFM. Fig. 7 shows representative two- and three-dimension side-by-side AFM micrographs of the X70 substrates before (a) and after immersion in 1 M HCl for 48 h in the blank acid in the absence of IMPA (b) with 500 ppm IMPA (c). The polishing marks on the metal generated before corrosion are still visible. The surfaces of the X70 steel substrates before (a) and after (b) immersion in the blank acid solution show magnitudes of average roughness up to 60.2 and 567 nm, respectively. The observed increased roughness of the bare X70 in the blank acid solution could be attributed to dissolution of metal due to aggressive acid ion attack. In the presence of IMPA in 1 M HCl solution (Fig. 7c), the roughness is significantly reduced by almost a half (272 nm), relative to the surface of X70 immersed in the blank acid solution. This reveals that IMPA was protecting the surface of the metal against corrosion, and this could be a result of inhibitor adsorbing on X70 substrate during the formation of protective imidazole film. Recently, similar assertion has been reported for the adsorption on synthesized benzimidazole derivatives on N80 steel in 15% HCl;43 azoles on carbon steel in 3% NaCl;44 and isonicotinamides on mild steel in 15% HCl.45 The results from our current study and those reported by these authors43–45 reveal a reduction in the values of both average surface and root mean square (rms) surface roughness in the presence of the inhibitors. Fig. 7c also exposes some depressions on the steel substrate; a section of which has been further enlarged as presented in Fig. 7d. The penetration depth of the depression/pit appears to be 2.5 μm narrowing within a 0.5 μm distance as shown on the depth profile in Fig. 7e.
 |
| Fig. 7 Representative two- and three-dimension (side-by-side) AFM micrographs of X70 surfaces before (a) and after immersion in 1 M HCl for 48 h in blank acid in the absence (b) and presence (c) of 500 ppm IMPA. The enlarged section (d) of the chemisorbed film reveals a distinct surface depression on X70, and this has been depth-profiled in a plot (e) showing penetration depth (x axis) vs. distance (y axis). | |
3.2.3. IR analysis of adsorbed film. An attempt was also made to probe the functional group chemistry of the adsorbed inhibitor film/corrosion product composite on the surface of X70 steel after the immersion periods reported in for the SEM and AFM tests. The IR spectra of the (a) pure IMPA and (b) the adsorbed film on X70 are depicted in Fig. 8. The IR adsorption characteristics of both systems were comparatively analyzed. The weak adsorption IR peaks that are observed at 1621 and 3110 cm−1 corresponds to the stretching mode of N–H of the primary amine group 46–48. C–H stretching vibrations are represented as strong peaks at 2860 (aliphatic) and 2940 (aromatic) cm−1.46,47 Other IR signatures of the aromatic imidazole ring include C
C and C–H bending vibration peaks at 1500 cm−1 and between 700 and 900 cm−1, respectively, and C–N stretching vibration mode are also located at 1277 and 1359 cm−1.39,43 The presence of these IR absorption peaks is common between the adsorbed inhibitor film on X70 and its pure compound. This is an evidence of the formation of protective/passive layer of IMPA as well as a proof of corrosion inhibition by molecular adsorption/interaction. There is O–H (s) vibration band on the film's IR spectrum due to the content of the corrosion medium while the absence of N–H stretching vibration peak on this system could be attributed to the formation of chemical bond at the metal surface adsorption site. From the presented IR spectra, it could be deduced that the adsorbed film originates from a Fe/IMPA molecular interaction with some distinct shifts in IR vibration bands observed above 2900 cm−1, between 1500 and 1600, 1300 and 1500 cm−1, and around 500 cm−1 compared to the spectrum of the pure IMPA. Yadav et al.43 have opined that any observed shift in IR vibrational frequencies between these two systems is indicative of the adsorption of inhibitors via inherent chemical groups. There seems also to be overlaps of IR peaks corresponding to Fe–O (originating from iron oxide) at 600 and 1500 cm−1 that would have been visible on the IR spectrum of the adsorbed inhibitor film/corrosion product composite (Fig. 8b).39
 |
| Fig. 8 FTIR spectra of the pure IMPA (a) and adsorbed IMPA film (b) on the surface of X70 steel substrate. | |
3.3. Quantum chemical calculations
3.3.1. Energies and frontier molecular orbitals analyses. The deployment of quantum structure–activity relations in explaining the extent of influence of the molecular structure of inhibitor molecules on their corrosion inhibition performance has been widely reported by semi-empirical methods.24,27–29 This class of computation also remains a powerful tool in correlating mechanisms of interaction of organic molecules with metal surfaces while also explaining many complex interfacial phenomena at the molecular level. Table 3 displays the quantum chemical parameters related to the molecular/electronic structure of IMPA computed using semi-empirical methods (PM3 model). These parameters were derived directly from the optimized molecular structure as well as from the orbital plots of IMPA molecule for optimized geometry presented in Fig. 9; or from the theorems related to these quantities.
Table 3 The calculated quantum chemical descriptors from semi-empirical method at RHF level for IMPA
Quantum chemical descriptors |
Magnitudes/values |
Total energy (kcal mol−1) |
−31 522.714 |
EHOMO (eV) |
−9.369 |
ELUMO (eV) |
0.695 |
ΔE (eV) |
10.064 |
μ (debye) |
4.963 |
I |
9.369 |
A |
−0.695 |
η |
5.032 |
χ |
4.337 |
σ |
0.199 |
ω |
1.869 |
ε |
0.535 |
ΔN |
0.147 |
Approx. surface area (grid) (Å2) |
291.730 |
Grid surface area (grid) (Å2) |
324.400 |
Volume (Å3) |
475.750 |
Hydration energy (kcal mol−1) |
−8.520 |
Refractivity (Å3) |
37.720 |
Polarizability (Å3) |
14.450 |
log P |
−1.460 |
 |
| Fig. 9 Optimized molecular structure (a), HOMO (b) and LUMO (c) orbital plots of IMPA molecule for optimized geometry computed using semi-empirical method (PM3); and mapped isosurface representations of electrostatic potential (d and e). The wire-mesh plot (d) shows the mapped electrostatic potential with the atoms still in view while the Gouraud shaded surface (e) allows for the visualization of the electrostatic potential mapping along individual atoms scaled between two extreme polarities. | |
The most significant parameters are the magnitudes of associated orbital energies of this inhibitor molecule. The total energy of IMPA listed in Table 3 is negative, and this is an indication of thermodynamic stability. The energy associated with HOMO and LUMO are −9.369 and 0.695 eV, respectively. EHOMO and ELUMO represent the energy of the molecule required to donate and accept electrons, respectively. In other words, while ELUMO denotes IMPA's electron accepting ability, the magnitude of EHOMO represents a molecule's potential to donate to electrons to the available low energy molecular orbital of a suitable electron acceptor.49–53 In this study, metal adsorption of IMPA must have been possible via combined donor–acceptor interactions between the empty 3d-orbital of Fe on X70 substrate and the π-electrons on the imidazole ring. The difference between these two energies is known as energy gap (ΔE = ELUMO − EHOMO); it represents a very important indicator in classifying the stability index of the corrosion inhibitor. Reduced magnitudes of ΔE is also considered by some researches in the discussions of the ability of a compound to inhibit corrosion. This is mainly because a very low amount of energy is required to remove electrons from the last occupied orbital to foster improved efficiency.27,54,55 Compounds with low ΔE are more likely adsorbed on metal surface and are better corrosion inhibitors.56 The values of ΔE for IMPA in our level of computation is 10.064 eV and the dipole moment (μ) is 4.963 debye; the latter represents the molecule's polarity index. This quantity is understood to contribute to molecular adsorption, hence corrosion inhibition, since it controls the transport of absorbed layer on the metal substrate.57,58 There seems to be no agreement in this field of research regarding the exact contribution of μ towards corrosion inhibition, but several authors have widely opined that this parameter could be an important factor.39,59,60 The negative pole of IMPA lies towards the imidazole group while the positive pole aligns in the plane of the methylene group linking the amine group (not illustrated in Fig. 9). Fig. 9 also shows the localization of HOMO (b) and LUMO (c) orbitals within the molecule; both orbitals lie within the vicinity of the aromatic imidazole ring. The HOMO also extends to the methylene group attached to the ring. This means that the imidazole ring is the core potential center with a higher probability of electron density donation to the Fe orbital (on steel surface) for coordinate bond formation.49 The lone pairs of electrons on the N heteroatom could be donated to the empty 3d orbital of Fe for metal surface bonding.
3.3.2. Atomic Mulliken charge distribution and ESP. The atomic Mulliken charge distribution on selected atoms were also computed for and presented in Fig. 10. The plot attempts to explain the distribution of the points of highest negative charge in the neutral IMPA molecule. From the plot, it is clear that IMPA has the potential of forming coordinate bond with Fe atom via the free electron pairs on the N hetero atoms on the imidazoline. Such chemistry supports metal surface adsorption, hence steel corrosion inhibition. The variation in the values of Mulliken charge on N2 atom computed from three semi-empirical methods could be attributed to the differences in the theory surrounding them at every level of approximation for each semi-empirical method. The three carbon atoms of the aromatic ring are also negatively charged from the three models used.
 |
| Fig. 10 Atomic Mulliken charge distribution from semi-empirical calculations using Parameterized Model number 3 (PM3), Austin Model 1 (AM1) and Reparameterization of AM1 (RM1) approaches; partial atomic charges are analyzed only on selected atoms. | |
The trend in atomic Mulliken charge distribution is also reflected in the molecular electrostatic potential (ESP) map presented in Fig. 9d. Since charge distribution could be related to ESP, mapping this quantity becomes a useful descriptor in visualizing potential sites for electrophilic attack and nucleophilic reactions.61 The presented ESP mapping in Fig. 9 is colour-coded to show the portions of the molecule with different electron densities; portions with the most prevalence of electrons are marked red, while blue represents the most positive electrostatic potential regions. From visual inspection of the mapped isosurface representations for IMPA (Fig. 9d and e), we can conclude that the electron density is higher in some areas compared to others. For instance, there appears to be heavy clouds of electrons around N1 and N3; this is in good agreement with partial atomic charge distribution in Fig. 10. Other regions in the vicinity of the imidazole ring are partially negatively charged except for the hydrogen atom, as expected. Obot et al.61 have recently reported a similar assertion while studying the corrosion reduction potentials of some triazine derivatives as inhibitors against steel corrosion using Density Functional Theory (DFT) and Monte Carlo simulation.
3.3.3. Significance of other computed parameters. Another measured quantity considered in this study is the chemical hardness (η) which represents a measure of the resistance towards polarization of electron clouds or chemical specie deformation.62,63 This parameter is also generally considered as measure of the system's stability; with regards to corrosion systems, inhibitor molecules with higher values of η are too “surface-stable” to be effective corrosion inhibitors for most metal substrates. Conversely, “soft” molecules are effective corrosion inhibitors since their ability to polarize is relatively high. In this work, the calculated values of global softness (σ) and chemical hardness (η) are 0.199 and 5.032. Another important property of an effective corrosion inhibitor is its ability to attract bonding pairs of electrons during the metal surface interaction. Inhibitor molecules with high magnitudes of electronegativity (χ) normally cannot easily donate electrons, hence cannot form coordinate bonds that initiates the formation of protective films of metal surfaces. In other words, better corrosion inhibitor molecules are strong Lewis bases with low magnitudes of χ. Values of ionization potential (I), representing the force required to remove loosely bound electrons as well as χ are also presented in Table 3 for IMPA. Electrophilicity index (ω) of an inhibitor molecule could be expressed as its capacity to accept electrons, and for IMPA, the value is 1.869 at PM3 level of approximation. Its inverse (1/ω) representing the measure of the ability of the molecule to donate or share electron is termed Nucleophilicity (ε); recorded as 0.535 for IMPA. According to Obot et al.,62 compounds with low values of ω and high values of ε have the potentials as effective corrosion inhibitors. The number of electrons transferred (ΔN) during the molecular interaction between the adsorbed inhibitor molecule and the metal could also be empirically evaluated by eqn (8). The magnitude of ΔN for IMPA stands at 0.147; compared with previous reports,27,64 this value shows that the corrosion inhibition by IMPA was a result of coordination bond formation via electron transfer. According to Lukovits et al.64 and Migahed et al.,27 when ΔN for corrosion inhibitor molecules is less than 3.6, inhibition efficiency (IE%) increases with their electron donating abilities. Table 3 also shows other molecular properties of IMPA computed with PM3 model of semi-empirical method. The molecular approximated and grid surface areas computed were measured in Å2, and these parameters, alongside the molecular volume (measured Å3), may also be related to the surface coverage of metal by the corrosion inhibitor molecule.62 Xia et al.65 and Ebenso et al.66 have claimed that these quantities are proportional to the observed magnitude of IE% obtained from the experiments, especially at reduced concentration. The range of inhibitor concentration in this study is below 1 parts per thousand (ppt). The calculated values for polarizability, refractivity and partition coefficient for IMPA are 14.450 Å3 and 37.720 Å3 and −1.460 respectively. Mathematically expressed as the logarithm of the ratio of concentrations of un-ionized solutes in a known solvent, the value of the computed partition coefficient (lipophilicity, log
P) is negative and this is inconsistent with hydrophobicity.67,68 IMPA used in this study is a water-soluble imidazole compound, partly due to this polarity index. The computed hydration energy of IMPA which is also related to its ionic–dipole interaction with water was found to be −8.520 kcal mol−1.Every computed parameter in our investigation (displayed in Table 3) points to the fact that the test molecule (IMPA) is reactive towards metal surface adsorption and this must have been a contributing factor towards its ability to inhibit X70 corrosion in HCl. Also, the accuracy of the presented results in this computation is within the level of approximation of the method used; and in this study we are deploying semi-empirical (PM3) approach to understand better the relationship between molecular structure and corrosion inhibition. Several recent research reports abound within the sphere of other computational methods, including: ab intio69,70 and DFT.29,39,51–58,62,63 In the future, we believe it is necessary to evaluate the effect of solvation on the electronic properties of corrosion inhibitor since there is a possibility of protonation of these molecules and this could have improve molecular adsorption at the metal surface in aqueous acid media. However, this was not the focus of our study.
3.4. Proposed mechanism of inhibition by film-forming IMPA molecules
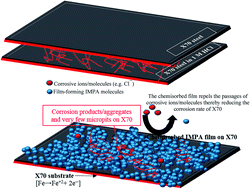
The proposed mechanism of corrosion inhibition by a compound is related to its nature of molecular interaction on the metal surface. The initial step in this mechanism is the specific adsorption of chlorides ions on the metal (X70) surface that will render it negatively charged.71 This charged surface further attracts protonated and/or neutral forms of IMPA molecules. As a result, coordinate-type electron transfer process occurs as unshared electron pairs (from the N heteroatoms of imidazole ring) move into the empty 3d orbital of Fe (in steel). A protective adsorbed film is then formed on the surface of X70 immersed in the solution of the acid electrolyte (see the illustration in Fig. 11).72 The functional group chemistry of this adsorbed film has been elucidated in this work by IR spectroscopy and the morphology of the metal surface to which it was adsorbed on has been also examined. Results from the experimental analyses in this study confirm improvement of corrosion resistance on X70 steel due to the adsorption of IMPA film on its surface 73–75. The presence of this film further reduced the dissolution of metal in 1 M HCl. Since an acid corrodent was involved, the conversion of the attached primary amine group to a quaternary chemical group could further make the adsorbed film more stable at the anodic sites.
 |
| Fig. 11 The proposed protective adsorbed film formed on the surface of X70 immersed 1 M HCl containing IMPA molecules: the idea that organic inhibitors reduce metal corrosion by adsorbing at the metal/electrolyte interface has been widely established.71–74 In this work, the metal substrate is positively charged with respect to the potential of zero charge (PZC) in HCl electrolyte73,74 while the N heteroatoms as well as that of the amine group could be protonated, leaving IMPA to either exist in the cationic-type form or/and as a neutral molecule. In these molecular forms, metal surface adsorption is possible via: (a) physisorption: a weak interaction between protonated IMPA and pre-adsorbed counter Cl− ions on steel; (b) chemisorption: a donor–acceptor type interaction between the empty 3d-orbitals of Fe and lone heteroatomic electron pairs (or π-electrons of imidazole ring); (c) retrodonation: an interaction involving 3d electrons of Fe and IMPA's empty antibonding orbitals.74,75 | |
4. Conclusion
The following conclusions are drawn from the results of the experiments conducted:
(1) 3-Imidazol-1-ylpropan-1-amine (IMPA)'s adsorbed film on X70 has been observed to inhibit its corrosion in 1 M HCl to a great extent. The inhibition efficiency of the compound was observed to be inhibitor concentration dependent. A magnitude of corrosion inhibition efficiency (IE%) up to 90% was achieved at relatively low concentration of IMPA at room temperature.
(2) The experimental electrochemical impedance results reveal that IMPA adsorption contributes to the charging of Fe/solution interface due to the formation of an adsorptive/inhibiting layer (judging from the trend of values of Cdl change with IMPA concentration).
(3) Corrosion inhibition of X70 in the presence of IMPA could be attributed to the adsorption of the inhibitor and subsequent formation of chemisorbed film of the metal surface. From the potentiodynamic polarization results it can be deduced that the adsorbed IMPA is a mixed-type film-forming inhibitor though it predominantly inhibits X70 corrosion by reducing the rate of its dissolution in 1 M HCl.
(4) Surface morphological analyses with SEM and AFM clearly show reduced damage on the surface of X70 steel in the presence of IMPA, and X70 corrosion is reduced by virtue of molecular adsorption of IMPA on its surface. This has been reaffirmed by IR spectroscopy.
(5) The mechanism of X70 corrosion inhibition with IMPA has been proposed; quantum structure/activity relations has been deployed to explain the extent of influence of the molecular structure of IMPA on its corrosion inhibition performance by semi-empirical method.
Acknowledgements
Authors wish to acknowledge the financial support/research grant from the Canada Research Chairs Program; the Saskatchewan Structural Sciences Centre (SSSC) is also acknowledged for providing some of the facilities for this research.
References
- M. E. Olvera-Martínez, J. Mendoza-Flores and J. Genesca, J. Loss Prev. Process Ind., 2015, 35, 19–28 CrossRef.
- M. A. Quraishi and D. Jamal, Mater. Chem. Phys., 2001, 68, 283–287 CrossRef CAS.
- M. Yadav, S. Kumar and P. N. Yadav, J. Pet. Eng., 2013, 13, 9–19 Search PubMed.
- S. A. Umoren, J. Mol. Liq., 2016, 219, 946–958 CrossRef CAS.
- T. Gu, P. Su, X. Liu, J. Zou, X. Zhang and Y. Hu, J. Pet. Sci. Eng., 2013, 102, 41–46 CrossRef CAS.
- J. Cruz, L. M. R. Martinez-Aguilera, R. Salcedo and M. Castro, Int. J. Quantum Chem., 2001, 85, 546–556 CrossRef CAS.
- E. Gutiérrez, J. A. Rodríguez, J. Cruz-Borbollaa, J. G. Alvarado-Rodríguez and P. Thangarasu, Corros. Sci., 2016, 108, 23–35 CrossRef.
- M. N. El-Haddad and A. S. Fouda, J. Mol. Liq., 2015, 209, 480–486 CrossRef CAS.
- U. M. Eduok and M. M. Khaled, Construct. Build. Mater., 2014, 68, 285–290 CrossRef.
- B. V. A. Rao and M. N. Reddy, Arabian J. Chem., 2014 DOI:10.1016/j.arabjc.2013.12.026.
- M. Abdallah, I. Zaafarany, K. S. Khairou and M. Sobhi, Int. J. Electrochem. Sci., 2012, 7, 1564–1579 CAS.
- L. Bechki, A. Lounas, S. Kaddouri, M. K. Bechki and M. Kadri, Int. Res. J. Earth Sci., 2015, 3, 7–12 Search PubMed.
- M. A. Deyab, B. El Bali, R. Essehli, R. Ouarsal, M. Lachkar and H. Fuess, J. Mol. Liq., 2016, 216, 636–640 CrossRef CAS.
- Z. Yanhua, Z. Jia, Y. Yongsheng and Z. Xianguang, J. Rare Earths, 2013, 3(7), 734–740 Search PubMed.
- G. Xia, X. Jiang, L. Zhou, Y. Liao, M. Duan, H. Wang, Q. Pu and J. Zhou, J. Ind. Eng. Chem., 2015, 27, 133–148 CrossRef CAS.
- X. Y. He, H. Y. Deng, R. Li, X. D. Fei, H. Y. Wang and Z. Y. Deng, Acta Metall. Sin., 2008, 21(1), 65–71 CrossRef CAS.
- S. Tu, X. Jiang, L. Zhou, M. Duan, H. Wang and X. Jiang, Corros. Sci., 2012, 65, 13–25 CrossRef CAS.
- G. Xia, X. Jiang, L. Zhou, Y. Liao, M. Duan, H. Wang, Q. Pu and J. Zhou, Corros. Sci., 2015, 94, 224–236 CrossRef CAS.
- R. Mendoza, J. Huante, V. Camacho, O. Alvarez-Fregoso and J. A. Juarez-Islas, J. Mater. Eng. Perform., 1999, 8(5), 549–555 CrossRef CAS.
- L. B. Godefroid, L. C. Cândido, R. V. B. Toffolo and L. H. S. Barbosa, Mater. Res., 2014, 17(suppl. 1), 114–120 CrossRef CAS.
- M. V. Fiori-Bimbi, P. E. Alvarez, H. Vaca and C. A. Gervasi, Corros. Sci., 2015, 92, 192–199 CrossRef CAS.
- U. M. Eduok and M. Khaled, Research in Chemical Intermediates, 2015, vol. 41, pp. 6309–6324 Search PubMed.
- M. M. Gehringer, P. Milne, F. Lucietto and T. G. Downing, Environ. Toxicol. Pharmacol., 2005, 19, 297–303 CrossRef CAS PubMed.
- S. Dahiya, S. Lata, R. Kumar and O. S. Yadav, J. Mol. Liq., 2016, 221, 124–132 CrossRef CAS.
- L. C. Murulana, A. K. Singh, S. K. Shukla, M. M. Kabanda and E. E. Ebenso, Ind. Eng. Chem. Prod. Res. Dev., 2012, 51, 13282–13299 CrossRef CAS.
- Z. El-Adnani, M. Mcharfi, M. Sfaira, M. Benzakour, A. T. Benjelloun and M. Ebn Touhami, Corros. Sci., 2013, 68, 223–230 CrossRef CAS.
- M. A. Migahed, A. M. Al-Sabagh, E. A. Khamis and E. G. Zaki, J. Mol. Liq., 2015, 212, 360–371 CrossRef CAS.
- M. S. Shihab and H. H. Al-Doori, J. Mol. Struct., 2014, 1076, 658–663 CrossRef CAS.
- G. Bereket, E. Hür and C. Öğretir, J. Mol. Struct.: THEOCHEM, 2002, 578, 79–88 CrossRef CAS.
- E. E. Oguzie, Y. Li and F. H. Wang, J. Colloid Interface Sci., 2007, 310, 90–98 CrossRef CAS PubMed.
- E. E. Oguzie, Y. Li and F. H. Wang, Electrochim. Acta, 2007, 53, 909–914 CrossRef CAS.
- S. A. Umoren, M. M. Solomon, U. M. Eduok, I. B. Obot and A. U. Israel, J. Environ. Chem. Eng., 2014, 2, 1048–1060 CrossRef CAS.
- B. V. A. Rao and S. S. Rao, Mater. Corros., 2010, 61, 285–301 CAS.
- K. Jüttner, Electrochim. Acta, 1990, 35, 1501–1508 CrossRef.
- G. E. Avci, Colloids Surf., A, 2008, 317, 730–736 CrossRef CAS.
- F. Bentiss, M. Lebrini, H. Vezin and M. Lagrenée, Mater. Chem. Phys., 2004, 87(4), 18–23 CrossRef CAS.
- U. Eduok, M. Khaled, A. Khalil, R. Suleiman and B. El Ali, RSC Adv., 2016, 6, 18246–18256 RSC.
- U. Eduok, R. Suleiman, M. Khaled and R. Akid, Prog. Org. Coat., 2016, 93, 97–108 CrossRef CAS.
- I. B. Obot and A. Madhankumar, Mater. Chem. Phys., 2016, 177, 266–275 CrossRef CAS.
- E. Machnikova, K. H. Whitmire and N. Hackerman, Electrochim. Acta, 2008, 53, 6024–6032 CrossRef CAS.
- S. A. Umoren, Z. M. Gasem and I. B. Obot, Ind. Eng. Chem. Prod. Res. Dev., 2013, 52, 14855–14865 CrossRef CAS.
- I. Lozano, E. Mazario, C. O. Olivares-Xomet, N. V. Likhanov and P. Herrasti, Mater. Chem. Phys., 2014, 147, 191–197 CrossRef CAS.
- M. Yadav, S. Kumar, T. Purkait, L. O. Olasunkanmi, I. Bahadur and E. E. Ebenso, J. Mol. Liq., 2016, 213, 122–138 CrossRef CAS.
- M. Finsgar, B. Petovar, K. Xhanari and U. Maver, Corros. Sci., 2016, 111, 370–381 CrossRef CAS.
- M. Yadav, R. R. Sinha, T. K. Sarkar, I. Bahadur and E. E. Ebenso, J. Mol. Liq., 2015, 212, 686–698 CrossRef CAS.
- K. B. Benzon, H. Tresa Varghese, C. Y. Panicker, K. Pradhan, B. K. Tiwary, A. K. Nanda and C. V. Alsenoy, Spectrochim. Acta, Part A, 2015, 146, 307–322 CrossRef CAS PubMed.
- T. Polat and S. Yurdakul, Spectrochim. Acta, Part A, 2014, 133, 683–696 CrossRef CAS PubMed.
- B. Morzyk-Ociepa, E. Rózycka-Sokołowska and D. Michalska, J. Mol. Struct., 2012, 1028, 49–56 CrossRef CAS.
- A. Sing, Y. Lin, I. B. Obot and E. E. Ebenso, J. Mol. Liq., 2016, 219, 865–874 CrossRef.
- L. Niu, Y. Yin, W. Guo, M. Lu, R. Qin and S. Chen, J. Mater. Sci., 2009, 44, 4511–4521 CrossRef CAS.
- I. B. Obot and Z. M. Gasem, Corros. Sci., 2014, 83, 359–366 CrossRef CAS.
- M. M. Kabanda, I. B. Obot and E. E. Ebenso, Int. J. Electrochem. Sci., 2013, 8, 10839–10850 CAS.
- I. B. Obot and N. O. Obi-Egbedi, Corros. Sci., 2010, 52, 198–204 CrossRef CAS.
- I. B. Obot, N. O. Obi-Egbedi and A. O. Eseola, Ind. Eng. Chem. Prod. Res. Dev., 2011, 50, 2098–2110 CrossRef CAS.
- G. Moretti, F. Guidi and G. Grion, Corros. Sci., 2004, 46, 387–399 CrossRef CAS.
- I. B. Obot and N. O. Obi-Egbedi, Corros. Sci., 2010, 52, 657–660 CrossRef CAS.
- X. Li, S. Deng and X. Xie, J. Taiwan Inst. Chem. Eng., 2014, 45, 1865–1875 CrossRef CAS.
- R. M. Issa, M. K. Awad and F. M. Atlam, Appl. Surf. Sci., 2008, 255, 2433–2441 CrossRef CAS.
- L. Guo, W. Dong and S. Zhang, RSC Adv., 2014, 4, 41956–41967 RSC.
- Y. M. Tang, Y. Chen, W. Z. Yang, W. Liu, Z. S. Yin and J. T. Wang, J. Appl. Electrochem., 2008, 38, 1553–1559 CrossRef CAS.
- I. B. Obot, S. Kaya, C. Kaya and B. Tuzun, Res. Chem. Intermed., 2016, 42, 4963–4983 CrossRef CAS.
- I. B. Obot, S. Kaya, C. Kaya and B. Tüzün, Phys. E, 2016, 80, 82–90 CrossRef CAS.
- S. Kaya and C. Kaya, Comput. Theor. Chem., 2015, 1060, 66–70 CrossRef CAS.
- I. Lukovits, E. Kalman and F. Zucchi, Corrosion, 2001, 57(1), 3–8 CrossRef CAS.
- G. Xia, X. Jiang, L. Zhou, Y. Liao, M. Duan, H. Wang, Q. Pu and J. Zhou, Corros. Sci., 2015, 94, 224–236 CrossRef CAS.
- E. E. Ebenso, M. M. Kabanda, L. C. Murulana, A. K. Singh and S. K. Shukla, Ind. Eng. Chem. Prod. Res. Dev., 2012, 51, 12940–12958 CrossRef CAS.
- D. T. Tran, C. L. Chen and J. S. Chang, Bioresour. Technol., 2013, 135, 213–221 CrossRef CAS PubMed.
- C. Cojocaru, A. Rotaru, V. Harabagiu and L. Sacarescu, J. Mol. Struct., 2013, 1034, 162–172 CrossRef CAS , http://www.sciencedirect.com/science/journal/00222860/1034/supp/C.
- H. Shokry and E. M. Mabrouk, Arabian J. Chem., 2014 DOI:10.1016/j.arabjc.2014.01.023.
- T. K. Chaitra, K. N. S. Mohana and H. C. Tandon, J. Mol. Liq., 2015, 211, 1026–1038 CrossRef CAS.
- E. E. Oguzie, Port. Electrochim. Acta, 2008, 26, 303–314 CrossRef CAS.
- M. N. El-Haddad and A. S. Fouda, J. Dispersion Sci. Technol., 2013, 34, 1471–1480 CrossRef CAS.
- S. Deng, X. Li and H. Fu, Corros. Sci., 2011, 53, 760–768 CrossRef CAS.
- C. B. Verma, E. E. Ebenso, I. Bahadur, I. B. Obot and M. A. Quraishi, J. Mol. Liq., 2015, 212, 209–218 CrossRef CAS.
- I. Ahamad, R. Prasad and M. A. Quraishi, Corros. Sci., 2010, 2, 1472–1481 CrossRef.
|
This journal is © The Royal Society of Chemistry 2016 |
Click here to see how this site uses Cookies. View our privacy policy here.