Palladium(0) nanoparticles supported on polydopamine coated Fe3O4 as magnetically isolable, highly active and reusable catalysts for hydrolytic dehydrogenation of ammonia borane†
Joydev Manna,
Serdar Akbayrak and
Saim Özkar*
Department of Chemistry, Middle East Technical University, 06800, Ankara, Turkey. E-mail: sozkar@metu.edu.tr
First published on 20th October 2016
Abstract
Magnetic ferrite nanopowders were coated with polydopamine which is inert against the hydrolysis of ammonia borane. Coating of ferrite powders was achieved by pH-induced self-polymerization of dopamine hydrochloride at room temperature. Palladium(0) nanoparticles supported on polydopamine coated ferrite (Pd0/PDA–Fe3O4) were prepared by impregnation of palladium(II) ions on the surface of PDA–Fe3O4 followed by their reduction with sodium borohydride in aqueous solution at room temperature. Magnetically isolable Pd0/PDA–Fe3O4 catalysts were characterized by a combination of advanced analytical techniques. The results reveal that palladium nanoparticles with an average size of 2.0 ± 0.4 nm are well dispersed on polydopamine layer with a thickness of 3.0 ± 0.5 nm on the surface of ferrite nanopowders. Pd0/PDA–Fe3O4 with a palladium loading of 3.81% wt was found to be a highly active and reusable catalyst in hydrogen generation from the hydrolysis of ammonia borane with a turnover frequency value of 14.5 min−1 at 25.0 ± 0.1 °C. Magnetically isolable Pd0/PDA–Fe3O4 catalysts preserve their initial catalytic activity even after the tenth use providing the release of 3 equivalent H2 per mole of ammonia borane. The report also includes the results of kinetic studies on the hydrolytic dehydrogenation of ammonia borane performed at various temperatures and different catalyst concentrations.
Introduction
Hydrogen is among the leading candidates as an energy carrier because of its high energy density, extreme abundance, and environmental sustainability.1 However, improvement of existing technologies for both the storage of hydrogen and its on-board production2 is crucial for efficient fuel-cell applications.3 Solid state hydrogen storage in metal hydrides or sorbents is the best among the available options.4 On account of its high hydrogen content (19.6% wt), high stability under fuel cell reaction conditions, and non-toxicity, ammonia borane (NH3BH3, AB) has been identified as one of the most promising solid state hydrogen storage materials.5 Hydrogen can be generated from ammonia borane by thermolysis6 or solvolysis7,8 process. Hydrolysis is preferred over thermolysis as it releases 3 mole H2 per mole of NH3BH3 at ambient temperature (eqn (1)).| NH3BH3(aq) + 2H2O(l) → NH4+(aq) + BO2−(aq) + 3H2(g) | (1) |
Regarding the nature of boron containing product of hydrolysis, we adopted the use BO2−(aq) ion.9 When dissolved in aqueous solution, BO2− ion will be converted first to B(OH)4− ion10 which can undergo condensation to polyborate species as confirmed by 11B NMR spectroscopy.11 The hydrolysis of AB can occur at room temperature in the presence of a suitable catalyst. Several transition metal(0) nanoparticles have been shown to be active in hydrogen generation from the hydrolysis of AB.12,13 However, metal nanoparticles have tendency to aggregate to larger particles, ultimately to bulk metal, and, therefore, they suffer long-term stability.14 Metal nanoparticles can be stabilized against agglomeration by using oxide supports with large surface area.15 Using a suitable support is important in obtaining stable metal nanoparticles with controllable size and size distribution.16,17 On the other hand, magnetic supports have attracted great interest in liquid phase catalytic reactions as they provide easy magnetic separation of nanoparticles.18,19
Ferrite (Fe3O4) is an appealing magnetic supporting material due to its several advantages such as high abundance, low cost, simple synthesis procedure, high magnetic moment and nontoxicity.20–22 When metal(0) nanoparticles are supported on the bare surface of ferrite, involvement of iron in the redox processes causes significant decrease in catalytic activity.23,24 Therefore, the magnetic oxide powders have been preferentially coated with catalytically inert materials such as polymer,25,26 carbon22 or silica27–29 to support the transition metal nanoparticles.
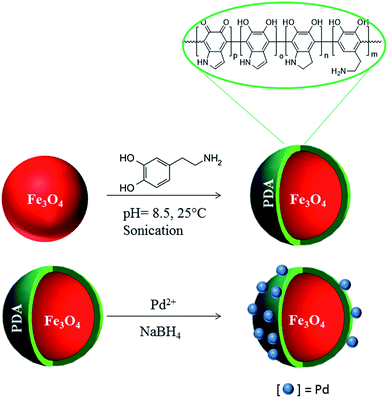
Herein, we report the synthesis and characterization of palladium(0) nanoparticles supported on polydopamine (PDA) coated Fe3O4 nanopowders, which were used as catalyst in hydrogen generation from the hydrolysis of ammonia borane. Polydopamine coated ferrite (PDA–Fe3O4) was obtained by the self-polymerization of dopamine salt in a buffered suspension of ferrite at room temperature. Since the PDA layer possesses the metal-coordinating capability through N- and O-binding sites30,31 palladium(0) nanoparticles supported on polydopamine coated ferrite (Pd0/PDA–Fe3O4) could be obtained by impregnation of palladium(II) ions on PDA–Fe3O4 followed by their reduction with sodium borohydride. Pd0/PDA–Fe3O4 was found to be active catalyst providing a turnover frequency value of TOF = 14.5 min−1 in hydrogen generation from the hydrolysis of ammonia borane at 25.0 ± 0.1 °C. More importantly, the magnetically separable Pd0/PDA–Fe3O4 catalyst was found to be reusable retaining its initial catalytic activity even after 10th use in the hydrolysis of ammonia borane releasing 3 equivalent H2 per mole of AB.
Experimental
Chemicals
Ferrite nanopowder (Fe3O4, particle size ≤ 50 nm, 97%), palladium(II) nitrate hydrate (Pd(NO3)2·xH2O), Tris–HCl (tris(hydroxymethyl)aminomethane)hydrochloride (≥99%), Tris-base (tris(hydroxymethyl)aminomethane) (≥99%), dopamine hydrochloride (99%), tetraethylorthosilicate (TEOS, 98%), ammonium hydroxide (NH4OH), ammonia borane (NH3BH3 or AB, 97%) were purchased from Sigma-Aldrich®. Deionized water was used for all the reactions distilled by water purification system (Milli-Q). All glassware and Teflon-coated magnetic stir bars were cleaned properly with acetone followed by DI water and dried in an oven at 100 °C before use.Surface modification of Fe3O4 nanoparticles
Polydopamine coated ferrite (PDA–Fe3O4) was prepared by pH-induced self-polymerization process.31 Fe3O4 nanoparticles (280 mg) was dispersed in 50 mL Tris-buffer solution (10 mM, pH = 8.5) containing 200 mg of dopamine chloride (see Table S1† for the optimization of dopamine salt concentration). The mixture was sonicated for 30 min, then stirred at 500 rpm at room temperature for 72 h. The obtained polydopamine coated nanoparticles were isolated using a permanent magnet, washed with water and dried under vacuum at 60 °C.Surface modification of Fe3O4 nanoparticles was also performed by silica coating. Silica coated ferrite (SiO2–Fe3O4) nanoparticles were synthesized by a modified version of Stöber method.32 At first, 1 mL TEOS was added into a mixture of 200 mL ethanol and 0.5 mL NH4OH. Then, 280 mg of Fe3O4 nanopowders which were dispersed in 50 mL of water was added into the mixture and stirred for 4 h at room temperature. The coated samples were collected with a permanent magnet, washed with DI water and dried at 120 °C for 12 h in an oven.
Palladium(0) nanoparticles supported on dopamine coated Fe3O4
Palladium(0) nanoparticles supported on polydopamine coated ferrite (Pd0/PDA–Fe3O4) were prepared by the impregnation of palladium(II) ions on the surface of dopamine coated ferrite followed by their reduction with sodium borohydride in aqueous solution at room temperature. PDA–Fe3O4 (100 mg) was dispersed in 50 mL of H2O by ultrasonication for 5 min. Then appropriate amount of Pd(NO3)2·xH2O was added into this suspension and stirred at 500 rpm at room temperature for 24 h. Afterwards, aqueous NaBH4 at a molar ratio of NaBH4/Pd = 5 in 10 mL of H2O was added dropwise into the mixed solution with vigorous stirring. After 1 h stirring, the sample (Pd0/PDA–Fe3O4) was isolated using a permanent magnet and washed with water and the remnant was dried under vacuum (10−3 Torr) at 60 °C for 12 h. For comparison, Pd0/Fe3O4 and Pd0/SiO2–Fe3O4 were prepared by following the same procedure as described above, by using Fe3O4 and SiO2–Fe3O4, respectively instead of PDA–Fe3O4.Characterization
The crystallinity of the materials was studied by taking the X-ray diffraction (XRD) pattern on a MAC Science MXP 3TZ diffractometer using Cu-Kα radiation (wavelength 1.5406 Å, 40 kV, 55 mA). The FTIR spectra were recorded using Thermo Scientific, Nicolet iS5 FTIR coupled with ATR. Surface morphology of the catalysts was examined by Scanning Electron Microscope (SEM) using a JEOL JSM-5310LV at 15 kV and 33 Pa in a high-vacuum mode without metal coating on carbon support. Transmission electron microscopy (TEM) was performed on a JEM-2100F (JEOL) microscope operating at 200 kV. Samples were examined at magnification between 400 and 700 K. Surface composition and oxidation state of elements in all the catalysts were determined by Physical Electronics 5800 XPS spectrometer equipped with a hemispherical analyzer and using monochromatic Al Kα radiation of 1486.6 eV, the X-ray tube working at 15 kV, 350 W and pass energy of 23.5 keV. Pd contents in the catalysts were determined by ICP-OES (Leeman-Direct Reading Echelle) after dissolving each sample in the mixture of HNO3/HCl (1![[thin space (1/6-em)]](https://www.rsc.org/images/entities/char_2009.gif) :
:![[thin space (1/6-em)]](https://www.rsc.org/images/entities/char_2009.gif) 3 ratio). Surface area properties were analyzed using a Micromeritics ASAP2020 model. N2-adsorption desorption isotherm was recorded at −196 °C. Before each adsorption, samples were outgassed at 150 °C.
3 ratio). Surface area properties were analyzed using a Micromeritics ASAP2020 model. N2-adsorption desorption isotherm was recorded at −196 °C. Before each adsorption, samples were outgassed at 150 °C.
Catalytic hydrolysis of AB
Hydrogen generation from the hydrolysis of AB was measured by water displacement method. The reactor (Fig. S1†) consists of a jacketed Schlenk tube (20 mL) which was connected to a water filled burette (60 cm in height and 3.0 cm in diameter) to measure the volume of the hydrogen gas to be evolved from the reaction. The jacketed Schlenk tube was placed on a magnetic stirrer (Heidolph MR-301) and thermostated to 25.0 ± 0.1 °C by circulating water to maintain the reaction temperature. The catalyst (Pd0/PDA–Fe3O4) was dispersed in 10 mL water in the Schlenk tube and 1.0 mmol H3N·BH3 (31.8 mg) was added into the reaction tube. The hydrolysis reaction was started by stirring the solution at 1200 rpm. The volume of the hydrogen gas evolved was measured by recording the displacement of water level every 1 min at constant atmospheric pressure of 693 Torr. The catalytic activity of Pd0/Fe3O4 and Pd0/SiO2–Fe3O4 was also measured by the same procedure as described above.Determination of the most active Pd loading for Pd0/PDA–Fe3O4 in the hydrolysis of ammonia borane
The catalytic activity of Pd0/PDA–Fe3O4 samples with various palladium loadings in the range of 0.97–4.33% wt was tested in hydrogen generation from the hydrolysis of ammonia borane starting with 0.94 mM Pd and 100 mM AB in 10 mL solution at 25.0 ± 0.1 °C. The highest catalytic activity was achieved by using 3.81% wt palladium loaded PDA–Fe3O4. For all the tests and characterization reported hereafter, palladium loading of 3.81% wt was used unless otherwise stated.Catalytic hydrolysis of AB using Pd0/PDA–Fe3O4 at different Pd concentrations
The kinetic study of the hydrolysis reaction was carried out using Pd0/PDA–Fe3O4 catalyst at different palladium concentrations (0.53, 0.89, 1.43 and 2.15 mM) with 100 mM AB in 10 mL of water at 25.0 ± 0.1 °C.Determination of activation energy for the hydrolysis of AB catalyzed by Pd0/PDA–Fe3O4
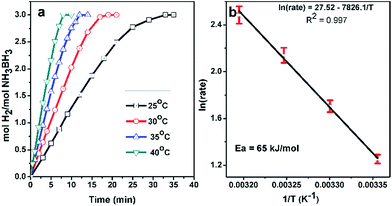
In a typical experiment, the hydrolysis reaction was performed starting with 10 mL of 100 mM (31.8 mg) AB solution and 25 mg of Pd0/PDA–Fe3O4 (3.81% wt Pd) at various temperatures (25, 30, 35, 40 °C) in order to obtain the activation energy. The hydrogen generation rate was calculated from the slope of the linear part of each hydrogen evolution versus time plot at various temperatures. Activation energy for the hydrolysis of ammonia borane catalyzed by Pd0/PDA–Fe3O4 was obtained from the slope of Arrhenius plot.Reusability of Pd0/PDA–Fe3O4 in the hydrolysis of AB
After the complete hydrolysis of AB started with 10 mL of 100 mM AB (31.8 mg H3N·BH3), and 60 mg Pd0/PDA–Fe3O4 (3.81% wt Pd, [Pd] = 2.15 mM) at 25.0 ± 0.1 °C, the catalyst was isolated using a permanent magnet, washed with water and redispersed in 10 mL solution of 100 mM AB for a subsequent run of hydrolysis at 25.0 ± 0.1 °C.Results and discussion
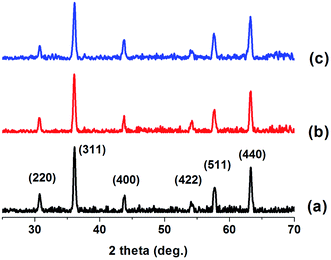
Fe3O4 nanoparticles were coated with polydopamine by pH-induced polymerization of dopamine hydrochloride in Tris-buffer solution at room temperature. The dopamine salt concentration was optimized to obtain an efficient coating. The dopamine salt concentration of 4 mg mL−1 was found to provide the most effective coating for the ferrite nanoparticles (see Table S1 and Fig. S2 and S3†). Polydopamine coated ferrite (PDA–Fe3O4) has the capability to coordinate metal ions or atoms through the N- and O-binding sites on the surface of polymer layer. Thus, palladium(0) nanoparticles supported on polydopamine coated ferrite (Pd0/PDA–Fe3O4) could be prepared by impregnation of palladium(II) ions on the surface of polymer layer followed by their reduction with sodium borohydride (Scheme 1). Pd0/PDA–Fe3O4 was magnetically isolated from the solution and characterized by using a combination of advanced analytical techniques including XRD, FTIR, SEM, EDAX, TEM, XPS, BET and ICP-OES.Fig. 1 shows the XRD patterns of Fe3O4, PDA–Fe3O4 and Pd0/PDA–Fe3O4 (Pd loading 3.81% wt). All three samples exhibit peaks at 30.11, 35.51, 43.31, 53.81, 57.11, and 62.81° attributable to (220), (311), (400), (422), (511), and (440) diffractions of Fe3O4, respectively (JCPDS = 43-1002). Thus, the crystallinity of Fe3O4 nanoparticles does not alter after PDA coating and Pd loading. There is no observable peak attributable to palladium nanoparticles in Fig. 1c, most likely because of the low palladium loading on the support.
The analysis of TEM images in Fig. 2 reveals two important findings: (i) Fe3O4 nanoparticles are successfully coated with a thin PDA layer with an average thickness of 3.0 ± 0.5 nm (Fig. 2a), (ii) highly dispersed palladium(0) nanoparticles are formed on the surface of polydopamine coated ferrite with particle size in the range 1.4–2.4 nm (mean diameter: 2.0 ± 0.4 nm) (Fig. 2b and c).
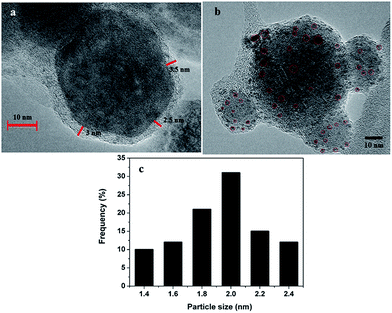 | ||
| Fig. 2 (a) and (b) TEM images of Pd0/PDA–Fe3O4 showing PDA coating and Pd nanoparticles, respectively (c) histogram of the particle size distribution of Pd nanoparticles. | ||
Fig. 3 shows a representative SEM image and SEM-EDS spectrum of the Pd0/PDA–Fe3O4 nanoparticles. It has been observed that the as-synthesized nanoparticles were aggregated in a cluster-like structure, which may be due to the large accumulation of negative charges on the particle surface.33 SEM-EDS spectrum shows the presence of Pd, C, N, Fe and O elements, which confirms the successful PDA coating of Fe3O4 as well as successful loading of Pd on the surface of PDA–Fe3O4.
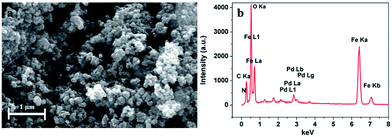 | ||
| Fig. 3 (a) SEM image showing the surface morphology and (b) SEM-EDS profile of the Pd0/PDA–Fe3O4 (3.81% wt Pd) catalyst. | ||
FTIR analysis also confirms the successful formation of PDA coated Fe3O4 nanoparticles (Fig S4 and S5†). A main absorption band around 600 cm−1 assigned to Fe–O stretching modes is observed for both Fe3O4 and PDA–Fe3O4 nanoparticles.34 The observation of additional absorption bands in the spectrum of PDA–Fe3O4 in the range 1000–1700 cm−1 is due to the C![[double bond, length as m-dash]](https://www.rsc.org/images/entities/char_e001.gif) C stretching, N–H bending, C–O stretching, and at 3350 cm−1 for O–H stretching also confirms the presence of polydopamine on the surface of Fe3O4 nanoparticles.35
C stretching, N–H bending, C–O stretching, and at 3350 cm−1 for O–H stretching also confirms the presence of polydopamine on the surface of Fe3O4 nanoparticles.35
Surface area of the Fe3O4 is found to be 44.37 m2 g−1 by BET analysis. The surface area of ferrite nanoparticles expectedly decreases to 40.46 m2 g−1 after PDA coating and then slightly increases to 41.78 m2 g−1 upon palladium loading. The slight increase in the surface area after palladium loading is attributable to the formation of palladium nanoparticles on the surface of PDA–Fe3O4.
The surface composition and oxidation states of the elements of the Pd0/PDA–Fe3O4 catalyst were analyzed by XPS (Fig. 4). The survey-scan XPS spectrum of Pd0/PDA–Fe3O4 catalyst (Fig. 4a) shows the presence of Pd in addition to the framework elements (C, N, O, Fe) in line with the EDS result. High resolution XPS scans for Pd3d, C1s and N1s core of Pd/PDA–Fe3O4 sample are displayed in Fig. 4b–d. The Pd3d spectrum (Fig. 4b) shows two prominent peaks at 339.8 and 334.68 eV which can readily be assigned to Pd(0) 3d3/2 and 3d5/2, respectively, by comparing with the values of metallic palladium.36 Two low intensity bands at 341.7 and 336.3 eV are attributable to the Pd(II) 3d3/2 and 3d5/2 bands, respectively.37 Palladium(0) may be oxidized during XPS sampling. Three peaks in the C1s spectrum (Fig. 4c) at 284.0, 285.5 eV, and 287.2 eV can be assigned to the C–C/CHx, C–N/C–OH and C![[double bond, length as m-dash]](https://www.rsc.org/images/entities/char_e001.gif) O groups, respectively. The peak at 398.9 eV in the N1s spectrum (Fig. 4d) is attributable to the NH group. N1s spectrum provides further evidence for the successful coating of Fe3O4 nanoparticles with polydopamine.38
O groups, respectively. The peak at 398.9 eV in the N1s spectrum (Fig. 4d) is attributable to the NH group. N1s spectrum provides further evidence for the successful coating of Fe3O4 nanoparticles with polydopamine.38
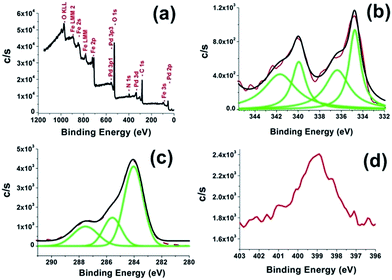 | ||
| Fig. 4 (a) X-ray photoelectron spectrum of Pd0/PDA–Fe3O4 with a 3.81% wt Pd loading and high resolution XPS scan of (b) Pd3d (c) C1s and (d) N1s core-levels. | ||
Pd0/PDA–Fe3O4 was employed as catalyst in hydrogen generation from the hydrolysis of ammonia borane. The catalytic hydrolysis was followed by monitoring the change in volume of H2 released from the hydrolysis reaction, which was then converted to equivalent mole of H2 per mole of AB using the known 3![[thin space (1/6-em)]](https://www.rsc.org/images/entities/char_2009.gif) :
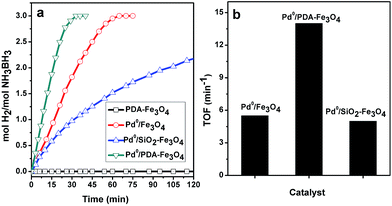
:![[thin space (1/6-em)]](https://www.rsc.org/images/entities/char_2009.gif) 1 H2/AB stoichiometry (eqn (1)). Fig. 5a shows hydrogen generation plots for the hydrolysis of ammonia borane using PDA–Fe3O4, Pd0/Fe3O4, Pd0/SiO2–Fe3O4, and Pd0/PDA–Fe3O4 as catalyst at 25.0 ± 0.1 °C. Polydopamine-coated ferrite (PDA–Fe3O4) is catalytically silent in hydrogen generation from the hydrolysis of ammonia borane while the palladium(0) nanoparticles supported on the bare or coated ferrite are found to be active catalyst releasing 3 equivalent H2 per mole of ammonia borane. The TOF values of the palladium(0) nanoparticles in hydrogen generation from the hydrolysis of ammonia borane at 25.0 ± 0.1 °C are given in Fig. 5b for comparison. Pd0/PDA–Fe3O4 provides almost three times higher catalytic activity with an initial TOF value of 14.5 min−1 compared to other two catalysts, Pd0/Fe3O4 (TOF = 5.5 min−1) and Pd0/SiO2–Fe3O4 (TOF = 5 min−1). The higher catalytic activity of Pd0/PDA–Fe3O4 may be attributed to the favorable anchoring of palladium(0) nanoparticles through the N- and O-binding sites of the polydopamine coating.
1 H2/AB stoichiometry (eqn (1)). Fig. 5a shows hydrogen generation plots for the hydrolysis of ammonia borane using PDA–Fe3O4, Pd0/Fe3O4, Pd0/SiO2–Fe3O4, and Pd0/PDA–Fe3O4 as catalyst at 25.0 ± 0.1 °C. Polydopamine-coated ferrite (PDA–Fe3O4) is catalytically silent in hydrogen generation from the hydrolysis of ammonia borane while the palladium(0) nanoparticles supported on the bare or coated ferrite are found to be active catalyst releasing 3 equivalent H2 per mole of ammonia borane. The TOF values of the palladium(0) nanoparticles in hydrogen generation from the hydrolysis of ammonia borane at 25.0 ± 0.1 °C are given in Fig. 5b for comparison. Pd0/PDA–Fe3O4 provides almost three times higher catalytic activity with an initial TOF value of 14.5 min−1 compared to other two catalysts, Pd0/Fe3O4 (TOF = 5.5 min−1) and Pd0/SiO2–Fe3O4 (TOF = 5 min−1). The higher catalytic activity of Pd0/PDA–Fe3O4 may be attributed to the favorable anchoring of palladium(0) nanoparticles through the N- and O-binding sites of the polydopamine coating.
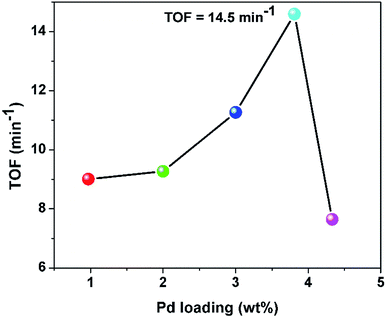
Expectedly, the catalytic activity of Pd0/PDA–Fe3O4 shows variation with palladium loading of the catalyst (Fig. 6). A series of experiments were performed at 25.0 ± 0.1 °C starting with 10 mL water, 1.0 mmol AB and Pd0/PDA–Fe3O4 catalysts with various Pd loading (0.97, 2.00, 3.00, 3.81 and 4.33% wt Pd) in appropriate amount to provide the same Pd concentration (0.94 mM Pd) in all of the experiments.
The Pd0/PDA–Fe3O4 sample with palladium loading of 3.81% wt Pd provides the highest catalytic activity (TOF = 14.5 min−1) in hydrogen generation from the hydrolysis of AB at 25.0 ± 0.1 °C. As the palladium loading further increases, the catalytic activity of Pd0/PDA–Fe3O4 decreases, most probably due to the agglomeration of Pd nanoparticles,39 resulting in a decrease in the surface area and the accessibility of active sites.40 Further kinetic studies were performed using the Pd0/PDA–Fe3O4 catalyst with 3.81% wt palladium loading.
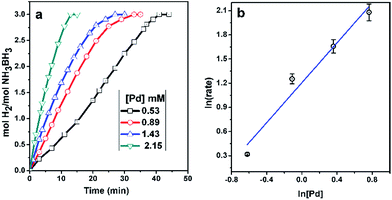
Fig. 7a shows the plots of equivalent H2 per mole of AB versus time during the catalytic hydrolysis of ammonia borane using the Pd0/PDA–Fe3O4 catalyst (3.81% wt Pd) in different Pd concentration at 25.0 ± 0.1 °C. The hydrogen generation starts immediately and continues almost linearly until the consumption of all ammonia borane present in the solution. The hydrogen generation rate can be measured from the linear part of each plot in Fig. 7a. Plotting the hydrogen generation rate versus the initial concentration of palladium, both in logarithmic scales, gives line with a slope of ∼1.1 indicating that the catalytic hydrolysis of ammonia borane is first order with respect to the palladium concentration.
Activation energy (Ea) of the hydrolysis of ammonia borane catalyzed by Pd0/PDA–Fe3O4 with a palladium loading of 3.81% wt Pd can be calculated from the Arrhenius plot constructed using hydrogen generation rates at various temperatures in the range between 25.0–40.0 °C (Fig. 8). The activation energy (65 kJ mol−1) obtained for the hydrolysis of ammonia borane catalyzed by Pd0/PDA–Fe3O4 is comparable to the literature values reported for the same reaction using other palladium based catalysts (Table 1).
| Catalyst | TOF (min−1) | Metal/AB (mol mol−1) | Ea (kJ mol−1) | Ref. |
|---|---|---|---|---|
| Pd/SiO2–CoFe2O4* | 254 | 0.0186 | 52 | 47 |
| 4 wt% Pd@MIL-101 | 45 | 0.0189 | — | 53 |
| Pd@Co/graphene* | 37.5 | 0.09 | — | 49 |
| Co35Pd65/C annealed* | 35.7 | 0.024 | — | 48 |
| RGO–Cu75Pd25 | 29.9 | 0.003 | — | 51 |
| Pd/CeO2 | 29 | 0.011 | 68 | 55 |
| 2.1 wt% RGO@Pd | 26.3 | 0.06 | 40 | 52 |
| Co35Pd65/C* | 22.7 | 0.024 | 27.5 | 48 |
| CDG–Pd | 15.5 | 0.005 | — | 50 |
| Pd0/PDA–Fe3O4* | 14.5 | 0.00895 | 65 | This study |
| Pd69Sn31 NPs/C | 13.64 | 0.0275 | — | 41 |
| Pd/SiO2 | 10 | 0.0186 | — | 47 |
| Pd–HAP | 8.3 | 0.02 | 55 | 42 |
| Pd/nanoTiO2 | 7.1 | 0.0228 | — | 55 |
| Pd/nanoSiO2 | 6.6 | 0.0228 | — | 55 |
| Pd/zeolite | 6.25 | 0.02 | 56 | 43 |
| RGO/Pd | 6.25 | 0.04 | 51 | 54 |
| Pd–PVB–TiO2 | 6 | 0.06 | — | 44 |
| Pd0/Fe3O4* | 5.5 | 0.00902 | — | This study |
| Pd0/SiO2–Fe3O4* | 5 | 0.0093 | — | This study |
| PSSA-co-MA-Pd | 5 | 0.02 | 44 | 45 |
| Pd/nanoAl2O3 | 3.5 | 0.0228 | — | 55 |
| Pd/nanoZrO2 | 3.5 | 0.0228 | — | 55 |
| 2% Pd/γ-Al2O3 | 1.39 | 0.025 | — | 46 |
| Pd black | 0.67 | 0.05 | — | 9 |
Table 1 gives also the list of TOF values reported for all the Pd-based catalysts in hydrogen generation from the hydrolysis of ammonia borane. The TOF value of Pd0/PDA–Fe3O4 catalyst (14.5 min−1) is higher than most of the other Pd-based catalysts reported in literature such as Pd69Sn31 NPs/C,41 Pd(0)–HAP,42 Pd/zeolite,43 Pd–PVB–TiO2,44 PSSA-co-MA-Pd,45 Pd/γ-Al2O3,46 and Pd black.9 However, the catalytic activity of Pd0/PDA–Fe3O4 (surface area, SBET = 41.78 m2 g−1) is lower than that of palladium(0) nanoparticles supported on high surface area materials such as Pd/SiO2–CoFe2O4 (SBET = 178.72 m2 g−1),47 Co35Pd65/C (SBET of carbon = 800 m2 g−1),48 Pd@Co/graphene,49 CDG–Pd (SBET of CDG = 500 m2 g−1),50 RGO–Cu75Pd25,51 RGO@Pd,52 Pd@MIL-101 (SBET = 1603 m2 g−1)53 etc.
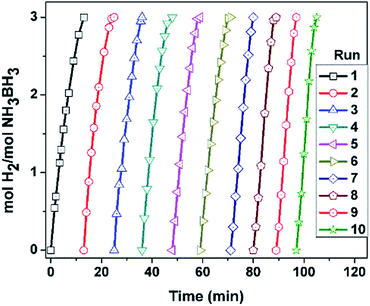
Reusability, an important criterion in judging the catalytic performance, is usually measured as the relative activity maintained in successive runs performed using the catalyst isolated after the previous run. Thereby, the catalyst isolation is usually achieved by filtration/centrifugation. The tedious process of catalysts separation by filtration or centrifugation is not only time consuming but also causes to significant loss of the catalyst material during the process. Both problems can be avoided by using magnetically separable catalysts like in the present case. The synthesized Pd0/PDA–Fe3O4 catalyst is magnetically separable, thus, can be recovered by an external magnet and used for several cycles of catalytic reaction (Fig. S6†). The reusability of Pd0/PDA–Fe3O4 catalyst was easily tested in successive runs of hydrolysis by magnetically isolating the catalyst from the reaction solution after a previous run and redispersing it in a new batch of ammonia borane solution. The results of reusability tests (Fig. 9) reveal that Pd0/PDA–Fe3O4 catalyst essentially retains its initial catalytic activity even after 10th run providing 100% of AB conversion, i.e. releasing 3.0 equivalent H2 per mole of AB.
Fig. 10 shows the comparison of palladium-based catalysts in terms of catalytic activity retained after multiple use in hydrolysis of ammonia borane. Magnetically separable Pd0/PDA–Fe3O4 catalyst provide exceptional reusability performance even after the tenth use as compared to the other palladium based catalysts such as RGO/Pd,54 Pd–HAP,42 Pd/zeolite,43 and Pd/CeO2.55
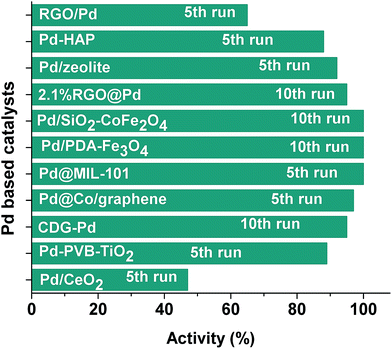 | ||
| Fig. 10 Percentage of catalytic activity of reported Pd catalysts after multiple use in hydrolysis of ammonia borane [see Table 1 for the references]. | ||
Conclusions
In summary, palladium(0) nanoparticles supported on polydopamine coated ferrite (Pd0/PDA–Fe3O4) were successfully prepared and employed as catalysts for hydrogen generation from ammonia borane. Polydopamine on the surface of ferrite has the capability to coordinate metal ions or atoms through the N- and O-binding sites on the surface of polymer layer. Thus, the palladium(II) ions can be impregnated and reduced to form palladium(0) nanoparticles which can be anchored by coordinating to the polymer layer on the surface of ferrite nanopowders. Pd0/PDA–Fe3O4 is highly active catalyst providing a TOF value of 14.5 min−1 in hydrogen generation from the hydrolysis of ammonia borane at 25.0 ± 0.1 °C. The comparison of the TOF values of Pd0/PDA–Fe3O4 (TOF = 14.5 min−1), Pd0/Fe3O4 (TOF = 5.5 min−1), and Pd0/SiO2–Fe3O4 (TOF = 5.5 min−1) shows that dopamine coating of Fe3O4 nanopowders play a crucial role in the catalytic activity of palladium(0) nanoparticles due to the presence of the N- and O-binding sites of polymer layer on the surface of ferrite. Most importantly, Pd0/PDA–Fe3O4 catalysts can be isolated from the reaction solution by using a permanent magnet. Thus being magnetically isolable Pd0/PDA–Fe3O4 catalysts have very high reusability as they retain almost 100% of their initial catalytic activity even after the tenth use in hydrogen generation from the hydrolysis of ammonia borane. The results of quantitative kinetic study on the hydrolytic dehydrogenation of ammonia borane show that the catalytic hydrolysis of ammonia borane is first order in palladium concentration and zero order with respect to the substrate. The activation energy is 65 kJ mol−1 for the hydrolysis of ammonia borane catalyzed by Pd0/PDA–Fe3O4.High catalytic activity, reusability and facile preparation make Pd0/PDA–Fe3O4 a very attractive catalyst for portable hydrogen generation systems using ammonia borane as hydrogen source.
Acknowledgements
Partial support by Turkish Academy of Sciences is acknowledged. Joydev Manna is thankful to Scientific and Technological Research Council of Turkey (TÜBİTAK) for the fellowship (Research Fellowship Program 2216 for International Researchers).Notes and references
- L. Schlapbach and A. Züttel, Nature, 2001, 414, 353 CrossRef CAS PubMed.
- U. B. Demirci and P. Miele, Energy Environ. Sci., 2009, 2, 627 CAS.
- S. Orimo, Y. Nakamori, J. R. Eliseo, A. Züttel and C. M. Jensen, Chem. Rev., 2007, 107, 4111 CrossRef CAS PubMed.
- U. Eberle, M. Felderhoff and F. Schüth, Angew. Chem., Int. Ed., 2009, 48, 6608 CrossRef CAS PubMed.
- Ö. Metin, V. Mazumder, S. Özkar and S. Sun, J. Am. Chem. Soc., 2010, 132, 1468 CrossRef PubMed.
- A. Staubitz, A. P. M. Robertson and I. Manners, Chem. Rev., 2010, 110, 4079 CrossRef CAS PubMed.
- U. Sanyal, U. B. Demirci, B. R. Jagirdar and P. Miele, ChemSusChem, 2011, 4, 1731 CrossRef CAS PubMed.
- Z.-H. Lu, J. Li, A. Zhu, Q. Yao, W. Huang, R. Zhou, R. Zhou and X. Chen, Int. J. Hydrogen Energy, 2013, 38, 5330 CrossRef CAS.
- M. Chandra and Q. Xu, J. Power Sources, 2006, 156, 190 CrossRef CAS.
- G. P. Rachiero, U. B. Demirci and P. Miele, Int. J. Hydrogen Energy, 2011, 36, 7051 CrossRef CAS.
- G. P. Rachiero, U. B. Demirci and P. Miele, Catal. Today, 2011, 170, 85 CrossRef CAS.
- Q. Yao, W. Shi, G. Feng, Z.-H. Lu, X. Zhang, D. Tao, D. Kong and X. Chen, J. Power Sources, 2014, 257, 293 CrossRef CAS.
- M. Zahmakiran and S. Özkar, Top. Catal., 2013, 56, 1171 CrossRef CAS.
- M. Zahmakıran and S. Özkar, Nanoscale, 2011, 3, 3462–3481 RSC.
- R. J. White, R. Luque, V. L. Budarin, J. H. Clark and D. J. Macquarrie, Chem. Soc. Rev., 2009, 38, 481 RSC.
- G. G. Wildgoose, C. E. Banks and R. G. Compton, Small, 2006, 2, 182 CrossRef CAS PubMed.
- G. Prieto, J. Zecevic, H. Friedrich, K. P. de Jong and P. E. de Jongh, Nat. Mater., 2012, 12, 34 CrossRef PubMed.
- S. Shylesh, V. Schünemann and W. R. Thiel, Angew. Chem., Int. Ed., 2010, 49, 3428 CrossRef CAS PubMed.
- D. Wang and D. Astruc, Chem. Rev., 2014, 114, 6949 CrossRef CAS PubMed.
- L. Kong, X. Lu, X. Bian, W. Zhang and C. Wang, ACS Appl. Mater. Interfaces, 2011, 3, 35 CAS.
- R. Abu-Reziq, H. Alper, D. Wang and M. L. Post, J. Am. Chem. Soc., 2006, 128, 5279 CrossRef CAS PubMed.
- A. Hu, G. T. Yee and W. Lin, J. Am. Chem. Soc., 2005, 127, 12486 CrossRef CAS PubMed.
- Y. Lee, A. Loew and S. Sun, Chem. Mater., 2010, 22, 755 CrossRef CAS.
- H. Yu, M. Chen, P. M. Rice, S. X. Wang, R. L. White and S. Sun, Nano Lett., 2005, 5, 379 CrossRef CAS PubMed.
- S. H. Xuan, Y. X. J. Wang, J. C. Yu and K. C. F. Leung, Langmuir, 2009, 25, 11835 CrossRef CAS PubMed.
- Y. Leng, J. Zhao, P. Jiang and J. Wang, ACS Appl. Mater. Interfaces, 2014, 6, 5947 CAS.
- J. Ge, Q. Zhang, T. Zhang and Y. Yin, Angew. Chem., Int. Ed., 2008, 47, 8924 CrossRef CAS PubMed.
- S. Wang, Z. Zhang, B. Liu and J. Li, Catal. Sci. Technol., 2013, 3, 2104 CAS.
- S. Akbayrak, M. Kaya, M. Volkan and S. Özkar, J. Mol. Catal. A: Chem., 2014, 394, 253 CrossRef CAS.
- H. Lee, S. M. Dellatore, W. M. Miller and P. B. Messersmith, Science, 2007, 318, 426 CrossRef CAS PubMed.
- R. Liu, Y. Guo, G. Odusote, F. Qu and R. D. Priestley, ACS Appl. Mater. Interfaces, 2013, 5, 9167 CAS.
- W. Stöber, A. Fink and E. Bohn, J. Colloid Interface Sci., 1968, 26, 62 CrossRef.
- M. Martin, P. Salazar, R. Villalonga, S. Campuzano, J. M. Pingarron and J. L. Gonzalez-Mora, J. Mater. Chem. B, 2014, 2, 739 RSC.
- K. Yang, H. Peng, Y. Wen and N. Li, Appl. Surf. Sci., 2010, 256, 3093 CrossRef CAS.
- L.-P. Zhu, J.-H. Jiang, B.-K. Zhu and Y.-Y. Xu, Colloids Surf., B, 2011, 86, 111 CrossRef CAS PubMed.
- C. J. Jenks, S.-L. Chang, J. W. Anderegg, P. A. Thiel and D. W. Lynch, Phys. Rev. B: Condens. Matter Mater. Phys., 1996, 54, 6301 CrossRef CAS.
- M. Peuckert, J. Phys. Chem., 1985, 89, 2481 CrossRef CAS.
- J. Liebscher, R. Mrówczyński, H. A. Scheid, C. Filip, N. D. Hădade, R. Turcu, A. Bende and S. Beck, Langmuir, 2013, 29, 10539 CrossRef CAS PubMed.
- S. Akbayrak, Y. Tonbul and S. Özkar, Appl. Catal., B, 2016, 198, 162 CrossRef CAS.
- S. Akbayrak and S. Özkar, ACS Appl. Mater. Interfaces, 2012, 4, 6302 CAS.
- Y. Li, Y. Dai and X.-K. Tian, Int. J. Hydrogen Energy, 2015, 40, 9235 CrossRef CAS.
- M. Rakap and S. Özkar, Int. J. Hydrogen Energy, 2011, 36, 7019 CrossRef CAS.
- M. Rakap and S. Özkar, Int. J. Hydrogen Energy, 2010, 35, 1305 CrossRef CAS.
- M. Rakap, E. E. Kalu and S. Özkar, Int. J. Hydrogen Energy, 2011, 36, 1448 CrossRef CAS.
- Ö. Metin, S. Sahin and S. Özkar, Int. J. Hydrogen Energy, 2009, 34, 6304 CrossRef.
- M. Chandra and Q. Xu, J. Power Sources, 2007, 168, 135 CrossRef CAS.
- S. Akbayrak, M. Kaya, M. Volkan and S. Özkar, Appl. Catal., B, 2014, 147, 387 CrossRef CAS.
- D. Sun, V. Mazumder, Ö. Metin and S. Sun, ACS Nano, 2011, 5, 6458 CrossRef CAS PubMed.
- J. Wang, Y.-L. Qin, X. Liu and X.-B. Zhang, J. Mater. Chem., 2012, 22, 12468 RSC.
- Ö. Metin, E. Kayhan, S. Özkar and J. J. Schneider, Int. J. Hydrogen Energy, 2012, 37, 8161 CrossRef.
- K. Güngörmez and Ö. Metin, Appl. Catal., A, 2015, 494, 22 CrossRef.
- B. Kiliç, S. Sencanli and Ö. Metin, J. Mol. Catal. A: Chem., 2012, 361–362, 104 CrossRef.
- H. Dai, J. Su, K. Hu, W. Luo and G. Cheng, Int. J. Hydrogen Energy, 2014, 39, 4947 CrossRef CAS.
- P. Xi, F. Chen, G. Xie, C. Ma, H. Liu, C. Shao, J. Wang, Z. Xu, X. Xu and Z. Zeng, Nanoscale, 2012, 4, 5597 RSC.
- Y. Tonbul, S. Akbayrak and S. Özkar, Int. J. Hydrogen Energy, 2016, 41, 11154 CrossRef CAS.
Footnote |
| † Electronic supplementary information (ESI) available: Fig. S1 to S5, containing schematic diagram of hydrolysis set up, FTIR etc. See DOI: 10.1039/c6ra23007e |
| This journal is © The Royal Society of Chemistry 2016 |

