Shi-Jie Cao*,
Dong-Hao Zhu and
Yin-Bao Yang
Department of Civil and Environmental Engineering, School of Urban Rail Transportation, Soochow University, No. 8 Jixue Road, Xiangcheng District, 215131, Suzhou, China. E-mail: shijie.cao@suda.edu.cn; donghao.zhu2014@gmail.com; Yyb8899@163.com; Fax: +86-512-67601052; Tel: +86-512-67501742
First published on 7th November 2016
Ventilation represents a significant portion of building energy consumption. Current codes and standards do not offer adequate guidance with respect to energy efficiency and to the relationship between the ventilation rate and the degree of indoor hazard. For the sake of energy savings, it is of great importance to study the associations between ventilation rates and indoor air quality (IAQ). Hence, in this work we aimed to investigate the influence of ventilation rates on IAQ for an indoor ventilated enclosure. Herein, ventilation efficiency is represented by the maximal local volume-averaged concentration and recirculation rate. In the present study, computation fluid dynamics (CFD) was applied and the low-Re-number k–ε model (verified by experiments) was selected for Reynolds-averaged Navier–Stokes (RANS) simulations, with buoyancy effects considered due to density differences. We found that when increasing the inlet ventilation rates, the impact on indoor pollutant concentration was considerable due to the increase in the turbulent diffusion effects. Moreover, this was less dependent on the larger range of slot Reynolds numbers (for the current study, Res ≥ 3000) and it ultimately tends to show an asymptotic behavior, which refutes the common working hypothesis of “the larger the ventilation rates, the better the IAQ”. These findings should further play an important role in the design of energy-efficient ventilation systems.
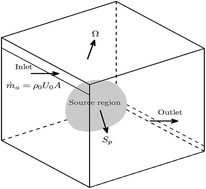
Nowadays, the design of building ventilation systems is mainly based on experience and the rule of thumb, and a large safety margin is applied for the ventilation rate. This often results in excessive ventilation for the building ventilation design in question, causing an unnecessary additional energy cost. Current codes and standards do not offer adequate guidance with respect to energy efficiency, or for the relationship between the ventilation rate and the degree of indoor hazard. This motivates researchers to study (either via experimental monitoring or numerical simulations) the influence of ventilation rates on contaminant removal efficiency for different building environments. Yi, Kim and Bae studied the effect of air flow rates on gas capture efficiency in a kitchen environment and finally recommended optimal supply rates.7 Moschetti and Carlucci investigated the impact of design ventilation rates on indoor air quality in residential buildings.8 Dutton and Fisk evaluated the energy (multiple ventilation rates) and indoor air quality (indicated as formaldehyde concentration) implications of various fixed minimum ventilation rates.9 By integrating building simulation and CFD methods, Fan and Ito found an appropriate air flow pattern was required for contributing to creating a healthy environment as well as for making energy savings.10 From these studies, they agreed that indoor air flow characteristics play an important role in controlling contaminant removal, which was a point also discussed by other researchers.11–16 Seppanen and Fisk investigated the human responses to ventilation rates,17 which is analogous to investigating the associated relationship between the contaminant concentration and ventilation rates as the rate of sick leave by employees is often dependent on the change in indoor contaminant concentration. From the existing studies, they summarized and demonstrated the predicted trends in illness of people who take sick leave vs. ventilation rates and reported that the illness of sick leave decreases over time, but the decrease in rate varies dramatically for low ventilation rates. They also showed that with higher ventilation rates, the rate of sick leave decrease becomes negligible, tending toward an asymptotic behavior. Thus, the trends for the rate of contaminant concentration variation (decrease) will also show an asymptotic behavior. Furthermore, it was suggested that lower ventilation rates should be applied while maintaining optimal IAQ as a design-trend for ventilation systems. Different from those studies that are mostly focused on specific building environments, we aimed to investigate the effects of lower ventilation rates on indoor pollutant distribution based on the general transport routines of both airflows and pollutants, and further targeted the optimal ventilation rates, i.e., the magnitude when the indoor concentration starts to show an asymptotic behavior. This method can be applied for other indoor environments. Since the Reynolds number is defined as the product of the supply velocity, the inlet-slot height, and the inverse of the kinematic viscosity, lower ventilation rates can be straightforwardly linked to different transitional inlet-slot Reynolds numbers, which is a main focus in the current work.
Moreover, two points should be emphasized in our work: first, the transitional flow effects on pollutant distribution were investigated, where these are due to the lower rates based upon typical ventilation requirements from ACH (air change rates), i.e., 4–15;18 second, the ventilation efficiency is newly defined and represented by the magnitudes of the maximal volume-averaged indoor contaminant concentration and the maximal mass flow recirculation rates. With these low Reynolds numbers, several potential hypotheses of “airflows and pollutants” inspired this research: transitional effects near the inlet should be noted and may play an important role in the pollutant removal process, as they impact on the local transition to turbulence of the inlet air-jet; in addition, when the inlet-slot Reynolds number (supplied ventilation rates) exceeds a certain level (or magnitude), the indoor pollutant concentration will cease to decrease and will tend toward an asymptotic behavior; indoor ventilation rates should be provided based on the actual distribution of the pollutant source rather than on simple ACH values.
Numerical simulations or small-scale experiments are usually employed to assure highly efficient and well-performing ventilation systems.19–21 Therefore, numerical simulation with CFD methods was a main tool utilized in the current work. A low-Re-number k–ε model was applied for the numerical simulations of a simple ventilation benchmark case (with a typical size of classroom). A range of transitional slot Reynolds numbers Res at the inlet were selected (ranging from 790 to 4000), corresponding to the low velocities typically required for ventilation comfort in full-scale applications. In the simulations, a surface pollutant source (i.e., CO2 as a indicator, as a common indoor pollutant) was also included for evenly distributed pollutant sources, allowing us to look at predicted pollutant concentrations.
The present manuscript is further structured as follows. First, in Section 2, the governing equations used in the simulations are briefly reviewed. Next, the details of the numerical setup are described in Section 3. Subsequently, Section 4 presents a number of Reynolds-averaged Navier–Stokes (RANS) simulations, in which the effects of inlet boundary conditions of the slot Reynolds numbers on ventilation efficiency are evaluated. Finally, the conclusions are presented in Section 5.
The normalized transport equations are applied in this system. A particular normalization is selected, i.e., the reference length L = Ω1/3, where the reference velocity is U0, and the reference density corresponds to ρ0. For the concentration, the well-mixed pollutant concentration (the average mass fraction) Y0 at the ventilation outlet is used as a reference. The mass-flux of air into the domain corresponds to ṁa, while the mass-flux of the pollutant corresponds to ṁp, such that Y0 = ṁp/(ṁa + ṁp) = 1/(1 + α), with α ≡ ṁa/ṁp. Using this normalization, the non-dimensional RANS equations, using an eddy viscosity and eddy diffusivity to model the Reynolds stresses and fluxes, respectively, are given by Cao and Meyers.22 When the ratio α is sufficiently large (α → ∞), the flow equations can be decoupled from the pollutant concentration equation, although flow equations can be decoupled only if α is bigger than 105 when CO2 is considered as the pollutant species.23 Now, we briefly summarize the resulting normalized RANS equations for the continuity, momentum, and concentration equations, respectively, corresponding to:
![]() | (1) |
![]() | (2) |
![]() | (3) |
![]() | (4) |
More details and definitions can be found in Table 1. By looking at the non-dimensional forms of the continuity and concentration equations (eqn (1) and (3)), it is found for α → ∞ that:
![]() | (5) |
Hence, for α → ∞, the solution of the continuity and momentum balance are decoupled from the pollutant concentration *. Consequently, the pollutant transport equation of
* becomes a linear-partial-differential equation (concentration will become a passive scalar), which can be solved once the velocity field is known (e.g., based on a set of numerical simulations or experiments).
In the current work, we do not treat concentration as a passive scalar based on the relative α range investigation (calculated from the air change rates); therefore, the presence of buoyancy effects caused by density differences is also considered in the momentum equations.
![]() | (6) |
![]() | (7) |
![]() | (8) |
Finally, the additional constants Sct, Cμ, C1, C2, C3, σk, σε, and functions fμ, f1 and f2 are defined in Table 2.
![]() | ||
Fig. 3 Schematic view of a uniformly distributed pollutant surface source, located at the plane with a height of y = 0.375L [(a) side view; (b) top view]. |
At the ventilation inlet, a uniform velocity U0 was supplied, with a corresponding slot Reynolds number Res (defined using U0, and the inlet-slot height of 0.05L, 0.2 m) and Re (as defined in eqn (4), and Re is generally larger than Res, for the current case 20 times that of Res). Besides this, the turbulence intensity and non-dimensional turbulent length scale were, respectively, 5% and 0.01273 for the inlet boundary condition to define the turbulence levels, where the turbulent length scale corresponds to 7% of the hydraulic diameter of the supplied inlet and is often correlated to the value for fully-developed pipe flows or channel flows.29 The turbulent intensities of the ventilation inlet are generally taken within the range 4–37%.30
The computational mesh was divided into a block-structure (cf. Fig. 2 containing a total of 2256
784 cells (i.e., 74 × 195 × 137 for the main block)). The first grid-node of the mesh was typically positioned at a distance of 0.5 × 10⁻³L from the wall. For the current case, with a range of transitional Reynolds numbers, we verified that this ensures a distance from the wall, using inner units, that would remain well below y+ = 3, so that the equations near the wall region could be sufficiently resolved to justify the application of the low-Reynolds-number k–ε model. A grid refinement study was also carried out with a finer grid using a total of 3
969
240 cells (compared to 2
256
784 for the baseline case). We found that the baseline case was sufficiently resolved, with differences in the velocity and turbulent kinetic energy between the two grid cases remaining below 2% (results are not shown here).
In order to study the impact of the slot Reynolds numbers Res on the effective ventilation efficiency, we also considered the dispersion of pollutants in the simulations. To this end, a case with a surface source of pollutants (i.e., CO2) inside the ventilated enclosure was considered, as shown in Fig. 3. For the sake of simplicity, the source was selected to be uniformly distributed over this surface. In the present work, the pollutant concentration will be dependent on the flow field and both are solved as a pair. Classrooms are environments generally with a high occupant density, which leads to a higher CO2 concentration. The suggested ACH range for classrooms is 6–20 (ref. 31) In Table 3, a summary of the considered cases is provided, with different values for the Air Change per Hour, ACH, inlet velocities, U0, slot Reynolds numbers, Res, Reynolds numbers, Re, mass-flux ratio, α, and Richardson numbers, Ri.
ACH | U0 (m s−1) | Res | Re | α | Ri |
---|---|---|---|---|---|
4 | 0.07 | 649 | 12![]() |
3226 | 14![]() |
5 | 0.09 | 811 | 16![]() |
4033 | 9586 |
6 | 0.11 | 973 | 19![]() |
4840 | 6657 |
7 | 0.12 | 1135 | 22![]() |
5646 | 4891 |
8 | 0.14 | 1298 | 25![]() |
6453 | 3745 |
9 | 0.16 | 1460 | 29![]() |
7259 | 2959 |
10 | 0.18 | 1622 | 32![]() |
8066 | 2397 |
11 | 0.20 | 1784 | 35![]() |
8872 | 1981 |
12 | 0.21 | 1946 | 38![]() |
9679 | 1664 |
13 | 0.23 | 2109 | 42![]() |
10![]() |
1418 |
14 | 0.25 | 2271 | 45![]() |
11![]() |
1223 |
15 | 0.27 | 2433 | 48![]() |
12![]() |
1065 |
16 | 0.28 | 2595 | 51![]() |
12![]() |
936 |
17 | 0.30 | 2757 | 55![]() |
13![]() |
829 |
18 | 0.32 | 2920 | 58![]() |
14![]() |
740 |
19 | 0.34 | 3082 | 61![]() |
15![]() |
664 |
20 | 0.36 | 3244 | 64![]() |
16![]() |
599 |
All the simulations were performed with the commercial software ANSYS Fluent. An incompressible pressure-based segregated solver was selected, using the SIMPLE algorithm and a second-order upwind scheme as used for the convective terms. The solutions were iteratively converged until the sum of the absolute normalized residuals of all the cells in the simulation domain remained below an upper threshold of 10−5 for the different equations. The temperature and dynamic viscosity, respectively, corresponded to 288 K and 1.7894 × 10⁻⁵ Pa s. The range of inlet ventilation rates were supplied in the range 0.07–0.36 m s−1, providing smaller indoor rates within the required standard of 0.3 m s−1.18
The low-Reynolds-number k–ε model of Chang, Hsieh, and Chen was employed for turbulence modeling,32 which has already proved to be a suitable RANS model for indoor ventilation simulation with transitional slot Reynolds numbers.30,31 Flow predictions with different RANS turbulence models were compared with previous PIV experimental data reported by Twan van Hooff and Bert Blocken33 Further, this model can overcome substantial modeling errors at the inlet geometry of our setup compared to other turbulence RANS models, such as the RNG k–ε model. In Fig. 4, both simulations and experiments were performed for the same Reynolds number Res = 5400 (within the transitional flow range) and geometry. This showed that both the simulations and experiments were in good agreement.
![]() | ||
Fig. 4 Contours of dimensionless air flow velocity, and pollutant concentration at xy-plane (z = 0.5L). (a) Velocity field from RANS simulation; (b) corresponding flow visualization from experiment. |
In order to evaluate the flow field, the recirculation rate R was applied, which determines the maximum back mass flow relative to the total mass flow, representing the ventilation efficiency to some extent, as was defined in Cao and Meyers:22
![]() | (9) |
Fig. 5 shows that the recirculation rate increases with the increase of the inlet-slot Reynolds numbers, which will help to improve the indoor pollutant removal efficiency. Fig. 6 demonstrates the streamlines and the magnitude of the velocity, the turbulent viscosity, and the concentration for three different inlet-slot Reynolds numbers. We only took three different slot Reynolds numbers (i.e., Res = 1135, Res = 2433, Res = 3244) for the representation of the slot Reynolds numbers, corresponding to the values given in Table 3. When looking at the results in Fig. 6(a1–a3), it can be seen that the effect of the inlet-slot Reynolds numbers on the velocity is not trivial. With increasing inlet-slot Reynolds numbers, the separation point of the inlet-jet shifts upwards along the downstream, which changes the internal recirculation shape and magnitude.
![]() | ||
Fig. 5 Dependence of the recirculation R with respect to different inlet-slot Reynolds numbers using the low-Re-number k–ε model. |
![]() | (10) |
Since the peak concentration itself is mathematically not always meaningful (e.g., pollutant point sources locally leading to infinite concentration levels), in this case, the concentration locally averaged over a volume of (0.3L)3 was selected. Fig. 7 shows a comparison of the concentration distributions directly resulting from the RANS model and the low-dimensional concentration locally averaged over a volume of (0.3L)3, with the corresponding slot Reynolds numbers Res equal to 1135, 2433, and 3244, respectively. It can be shown that the concentration distribution (Fig. 7(a1–a3)) of the pollutant is qualitatively reflected by the concentration locally averaged over a volume of (0.3L)3, cf. Fig. 7(b1–b3). Moreover, the pollutant concentration magnitudes decreased as we increased the slot Reynolds numbers. Hence, the low-dimensional volume-averaged concentration can be utilized for indoor concentration distribution. Furthermore, this will facilitate the practical use in monitoring the pollutant dispersion.
We now quantify the effect of changing the inlet-slot Reynolds numbers on the indoor ventilation efficiency. Fig. 8 shows the evolution of the locally averaged peak concentration for the different simulations as a function of the slot Reynolds numbers at the inlet. In Fig. 7, it can be observed that the inlet-slot Reynolds numbers have a large impact on the pollutant concentration prediction, as already shown in Fig. 6(c1–c3), similar to previous findings.34 It was also found that the variation of the peak concentration decreases as the slot Reynolds numbers increase and it becomes negligible when the slot Reynolds exceeds a certain level, i.e., Res = 3000. Moreover, Res = 3000 corresponds to ACH = 15, which is also the maximal recommended air change per hour for general residential environments.18 Since we only focused on transitional slot Reynolds numbers, it can be estimated that if the slot Reynolds numbers are sufficiently large, this peak concentration will tend to show an asymptotic behavior. This violates the common sense that the larger the inlet ventilation rates (larger slot Reynolds numbers), the better the indoor pollutant will be removed, resulting in a waste of building energy consumption.5 Hereby, we need to point out that the asymptotic behavior is not necessarily restrained to the maximal local-averaged volume concentration but also exists for normal volume-averaging concentrations (results not shown here).
Our findings show similar behaviors to those shown in previous studies with experimental investigations.9,17 However, it should be noted that our findings are only specific for ventilation cases with the current transitional slot Reynolds numbers, although the same idea could be extended to other complex building environments.
In practice, a common working hypothesis was that the larger the supplied ventilation rates, the better the indoor pollutant removal efficiency would be. Nowadays, trends in ventilation are moving toward lower ventilation rates while keeping the same optimal indoor environment. Hence, it is of great importance to study the ventilation cases with lower (transitional) inlet-slot Reynolds numbers (directly related with supplied ventilation rates), which was the main focus for the current study. We then evaluated the relationship between the inlet-slot Reynolds numbers and indoor ventilation efficiency, represented by the recirculation rate and maximal locally volume-averaged concentration. It was observed that inlet-slot Reynolds numbers have an important impact on indoor flow pattern, resulting in changing the shape and magnitude of internal recirculation, thus further influencing the contaminant dispersion. The results of the current work also indicated that the inlet-slot Reynolds numbers have a considerable effect on turbulence levels, i.e., turbulent viscosity and eddy diffusivity, which also influence the indoor pollutant concentration distribution. The larger the inlet-slot Reynolds numbers, the smaller the pollutant concentration will become. Moreover, it was found that the pollutant concentration distribution is less dependent on the larger range of slot Reynolds numbers (for the current study, i.e. Res ≥ 3000) and that the concentration ceases to tend to show an asymptotic behavior. Hence, this conclusion violates the common working hypothesis, i.e., that the larger the supplied ventilation rates, the better the indoor pollutant removal efficiency will be. This further shows that it is of great importance to apply indoor pollutant on-line monitoring for the design of energy-efficient ventilation systems.
For the current study, we used the peak concentrations averaged over an observation volume to represent ventilation efficiency, which was a straightforward method and may be a lot more interesting for practical use. This corresponds to a local volume average, where the size of such a volume may depend on the toxicity of the pollutant, lung capacity of human beings, etc. For real-life applications, ventilation systems with more complex geometries (including diffusers) should be considered for future research. Moreover, for the design of energy-efficient ventilation systems, both IAQ and thermal comfort should be considered. Thus, several other aspects should be taken into account for future studies, e.g., in the presence of heat sources, human factors, etc., as these could also be important influential factors for pollutant dispersion.
This journal is © The Royal Society of Chemistry 2016 |