An in situ gold-decorated 3D branched ZnO nanocomposite and its enhanced absorption and photo-oxidation performance for removing arsenic from water†
Mianli Huanga,
Wenhui Fengb,
Wentao Xua and
Ping Liu*b
aQuanzhou Normal University, Quanzhou, 362000, China
bState Key Laboratory of Photocatalysis on Energy and Environment, Fuzhou University, Fujian 350002, China. E-mail: liuping@fzu.edu.cn
First published on 16th November 2016
Abstract
In this study, we report a one-step, low-cost and environmentally benign route to tune ZnO morphology via the in situ reduction of Au nanoparticles as crystal habit modifiers. Pure ZnO had spindle shape morphology. When the Au particles were introduced to the system, the growth form of the ZnO crystals was changed. Finally, ZnO grew along different directions to form a 3D nanobranched morphology. This unique 3D nanobranched ZnO/Au compound exhibits enhanced absorption and photooxidation performance for AsO2− (As(III)). What is more, the efficiency could be improved by optimizing the Au content to 1%. The adsorption kinetics, which were explored in detail, indicated that Au decoration significantly changed the surface properties of the samples. The zeta potential of the ZnO/Au samples was more positive, which is beneficial for the adsorption of AsO2− (As(III)) with negative charges. Moreover, the enhanced photooxidation performance was attributed to the coupling of Au noble metal nanoparticles and the 3D branched structures. Thus, this facile method was expected to adsorb and oxidize As(III) from contaminated water in one step. What is more, usage of noble metal particles, which are formed in situ, as habit modifiers to tune the growth form of crystals can be extended to the preparation of other metal oxide.
1. Introduction
With the fast development of industry and agriculture, arsenic pollution is a serious concern and threatens the health of people all over the world.1,2 In groundwater, the oxidation states of inorganic arsenic are predominantly AsO2− (As(III)) and AsO43− (As(V)).3 Usually, As(III) is more difficult to remove than As(V).4 Therefore, the pre-oxidation of As(III) to As(V) is often necessary for its successful removal.5 Thus far, there are a number of oxidation methods. Among them, photocatalytic oxidation is one of the promising and green methods.6–8TiO2 is generally considered as the most important photocatalyst and has been used for the efficient oxidation of As(III) to As(V).9–11 ZnO, because of excellent stability, environmental friendliness and low cost is also an attractive alternative to TiO2 due to the similar band gap energy (3.2 eV).12–14 Moreover, when compared to TiO2, ZnO may have a larger quantum efficiency and higher photocatalytic activity for the photocatalytic destruction of specific pollutants as reported.15–17 Usually, the photocatalytic properties of ZnO are determined by its crystal morphology, and therefore diverse properties can be generated by tailoring the morphology.18 Therefore, rational design and control over the morphology have attracted broad attention.
There are myriad synthesis methods reported in the literature for the different morphologies of ZnO nanostructures, such as nanorods,19 nanowires,20,21 nanosheets,22 nanoballs,23 nanocorns,24 nanoflowers25 and nanotrees.26 When compared with 1D and 2D ZnO structures, three-dimensional (3D) branched ZnO nanotrees have recently demonstrated marvellous performance and promising potential in various applications. In particular, branched nanostructures are more attractive in photocatalytic applications and are desirable for increased light harvesting and energy conversion efficiency.21 The branched nanostructures may provide more surface-active sites for loading dye molecules or semiconductor quantum dots, as well as for light trapping due to multi-scattering.27,28 Therefore, their synthesis is now considered as a new strategy for enhanced photocatalytic activity.
Some efforts have been devoted to synthetic methodologies for preparing branched nanostructures. For example Zhang et al.29,30 reported a series of organic structure-directing agents (SDAs) (e.g., citrate, diaminopropane or DAP) for the formation of ZnO nanobranches. Zhuo et al.31 synthesized ZnO hierarchical tree-like nanostructures via a simple one-step chemical vapor deposition (CVD) process. Sun et al.18 reported the morphology-controlled synthesis of three-dimensional (3D) ZnO nanoforests via a facile hydrothermal route. Liu and Tian et al.26,32 adopted a ZnO nanorod-seeded sequential solution process to produce hierarchical wurtzite ZnO crystallites with gradual branching events.
However, most of the methods are not very environmentally friendly. Considerable challenges still remain in developing rational strategies and facile routes. Currently, controlling the crystal growth via a one-pot approach is an important requirement.33,34 In addition, the design of noble metal/ZnO composite nanostructures is an effective method to improve photocatalytic performance. However, most of the noble metal is prepared via deposition on the surface of the photocatalysts. To date, there are few reports in the literature on how to tune and control the morphology of 3D ZnO nanobranches via a one-step in situ reduction of Au nanoparticles. ZnO epitaxially grow to attain a nanobranched structure, with the assistance of Au nanoparticles. What is more, the composite 3D nanocompounds will present multifunctional material properties. The absorption and photo-oxidation efficiency of the ZnO nanostructures can be enhanced by their surface modification with Au noble metal nanoparticles.35 The coupling of semiconductor and noble metal components facilitates the separation of the photogenerated charge carriers.36
In this study, we report a one-step, low-cost and environmentally benign route towards the synthesis of Au particle-decorated 3D ZnO nanobranches. Gold nanoparticles were reduced in situ using ethylene glycol solvent. On one hand, the surface charge of the as-prepared Au nanoparticle-decorated ZnO nanobranches was positive, which was beneficial for the adsorption of AsO2− (As(III)). Usually, the adsorption of As(III) is very difficult.37 On the other hand, the as-prepared Au nanoparticle-decorated ZnO nanobranches showed enhanced photocatalytic activity for the photo-oxidation of As(III) when compared to pure ZnO nanospindles. Thus, this facile method was expected to adsorb and oxidize As(III) from contaminated water in one-step. What is more, it is also expected that noble metal particles formed in situ as habit modifiers to tune the growth form of the crystals can be extended to the preparation of other metal oxide nanocatalysts.
2. Experimental
Materials
Zinc acetate (Zn(AC)2·2H2O), ethylene glycol (EG), urea (CO(NH2)2), chloroauric acid (HAuCl4), and ethanol were of analytical grade and used without further purification (Sinopharm Chemical Reagent Company). Throughout this study, deionized water was used.Synthesis of the materials
6 mmol of Zn(AC)2·2H2O, 9 mmol of CO(NH2)2 and the required quantity of HAuCl4 were dissolved in 60 mL of ethylene glycol (EG) under vigorous stirring for 2 h. The obtained solution was placed in a Teflon-lined stainless steel cylindrical chamber of 80 mL capacity and was then heated in an oven at 180 °C for 10 h. Finally, the products were washed several times with deionized water and ethanol to remove the possible residues and then dried at 60 °C for 12 h in vacuum for further characterization. The real ratio of Au in ZnO was determined by X-ray fluorescence analysis (PW2424). The real ratios of Au in ZnO were 0.48%, 0.96% and 1.95%, respectively. The obtained products were denoted as ZnO–Au (0.5%), ZnO–Au (1%) and ZnO–Au (2%), indicating the wt% amount of Au in the photocatalyst.Structural characterization of the materials
The crystal structures of the products were determined using a Bruker D8 Advance X-ray diffractometer with Cu-Kα target (λ = 0.15406 nm) at 40 kV and 40 mA. The step width was 0.02° 2θ s−1. X-ray photoelectron spectroscopy (XPS) was recorded at 1.2 × 10⁻⁹ mbar with Al Kα as the X-ray source (ESCALAB 250, Thermo Fisher Scientific). The morphologies were recorded using field emission scanning electron microscopy (FESEM, FEI Nova Nano SEM 230). The microstructures of the samples were characterized using Tecnai G2F20 S-TWIN transmission electron microscopy (TEM, FEI Company) with a 200 kV emission gun. The BET surface areas were recorded using a Micrometrics ASAP 2020 analyzer at 77 K after the products were degassed at 100 °C for 4 h in a vacuum. The zeta potential of the samples was measured using a Nanotrac Wave Zeta size test measurement. The diffuse reflection spectra (DRS) of the samples were recorded on a Varian Cary-500 spectrophotometer. The photocurrent response for the light or dark short circuit was measured via a BAS Epsilon workstation.As(III) removal measurements
A stock As(III) solution (1 g L−1) was prepared by dissolving 1.734 g of NaAsO2 in 1 L of 2% HCl solution, which was diluted to 2 mg L−1 using ultrapure water before the oxidation process. For each reaction, 20 mg of the ZnO photocatalyst was dispersed in 40 mL of the 2 mg L−1 As(III) solution in a quartz tube. Before illumination, the suspension was stirred for 120 min in the dark in order to maintain the adsorption–desorption equilibrium. Then, the suspension was illuminated under four 4 W UV lamps of 365 nm (Philips TL/05). At given irradiation time intervals, 1 mL of the suspension was centrifuged and collected. The concentration of the supernatant liquid was analyzed using atomic fluorescence spectrometry (PF6, Beijing purkinje general instrument Co., Ltd.).Electrochemical measurements
The photocurrent measurements were conducted on the BAS Epsilon Electrochemical System with a conventional three-electrode system. The counter and reference electrodes were Pt plate and Ag/AgCl electrodes, respectively. The prepared samples served as the working electrode. 10 mg of the photocatalyst powder was added to 0.1 mL of N,N-dimethylformamide. After sonication for 1 h, the slurry was spread onto ITO glasses with an area of 0.25 cm2. 0.2 mol L−1 Na2SO4 solution was utilized as the electrolyte solution. A 300 W xenon lamp at a wavelength of 365 nm was used as the light source (CHF-XM300, Beijing Changtuo).3. Results and discussion
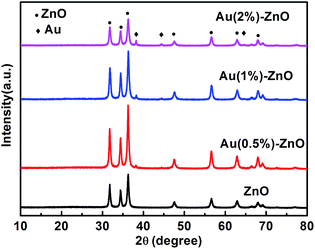
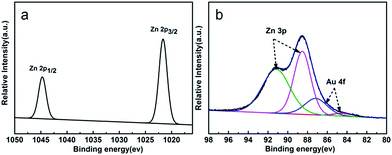
The XRD patterns of the as-prepared pure ZnO and ZnO/Au samples are shown in Fig. 1. All the observed strong and sharp diffraction peaks can be clearly indexed to the wurtzite ZnO crystal structure (JCPDS card no. 36-1451)35 indicating good crystallization of the samples. Upon increasing the Au loading amount, the Au(111) characteristic peaks located at 38.23° were detected gradually (JCPDS card no. 04-0784).38 The results indicate that HAuCl4 was successfully reduced by ethylene glycol as expected.In order to understand the chemical states of Au in the ZnO/Au samples, XPS measurements were performed for the sample of ZnO–Au (1%). The electronic states of the Zn 2p and Au 4f XPS spectra are illustrated in Fig. 2a and b. The binding energies of Zn 2p (Fig. 2a) are observed at about 1045 and 1022 eV respectively and were attributed to Zn2+.39 The XPS spectra of the Zn 3p and Au 4f overlap at the binding energy interval of 80–96 eV.40 The XPS spectrum can be fitted into four peaks, as shown in Fig. 2b. The two peaks centered at 84.1 and 87.2 eV can be attributed to Au 4f7/2 and Au 4f5/2 respectively,41 corresponding to Au0, which indicates that Au is in the form of single state Au0 in the ZnO/Au samples.42
FESEM images of the as-synthesized samples are shown in Fig. 3. The presence of nanospindle-like structures can be clearly seen in the FESEM image of the pure ZnO sample (Fig. 3a). In contrast, we found that the introduction of HAuCl4 to the reaction solution led to the appearance of nanobranched ZnO crystallites. As seen in Fig. 3b–d, the content of Au has a large impact on the morphology of the samples. The crystal growth of ZnO was affected profoundly by Au impurities present in the system. Impurities usually act on certain crystallographic faces. Therefore, impurities can be used to change the growth form of the crystals as habit modifiers.43 Au particles inhibit the ordering of the ZnO structure, which induce the change in the ZnO growth direction. As a result, secondary nanobranches grow on the nanospindle. As the Au concentration increases from 0.5 to 1 wt%, a greater number of more regular nanobranches appear. This suggests that the introduction of Au in the reaction system can increase the sites of ZnO growth direction. However, the impurity effect depends on the impurity concentration. A further increase in the Au concentration (2 wt%) leads the ZnO growth direction to change continuously, which causes a slight aggregation in the ZnO structure.
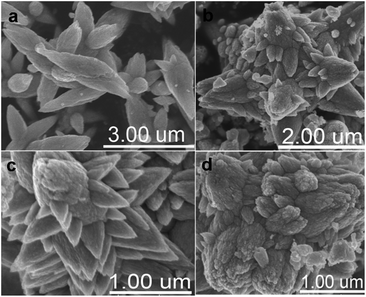 | ||
| Fig. 3 FESEM images of the samples: (a) ZnO, (b) ZnO–Au (0.5%), (c) ZnO–Au (1%), and (d) ZnO–Au (2%). | ||
Structural information was further obtained using TEM studies. Typical TEM and HRTEM images of the as-synthesized products are given in Fig. 4. The high resolution TEM image of a ZnO nanospindle in Fig. 4b clearly shows the lattice fringes and the measured d-spacing is 0.28 nm, which corresponds to the (100) interplanar spacing of ZnO. Energy dispersive X-ray spectroscopy (EDX) data from regions marked in the area in Fig. 4a are plotted in Fig. 4c. It clearly shows the presence of Zn, O, C and Cu signals in the EDX spectra. The EDX peaks for the C and Cu elements are a result of the C-coated Cu-grid from the TEM instrument itself. TEM micrographs of ZnO nanospindles decorated with 1% Au nanoparticles are presented in Fig. 4d–f. The TEM images of the ZnO–Au (1%) sample revealed the nanobranched structures. However, no Au particles were detected, probably due to the low loading amount44 as well as the in situ reduction of the Au particles by ethylene glycol in the bulk ZnO.
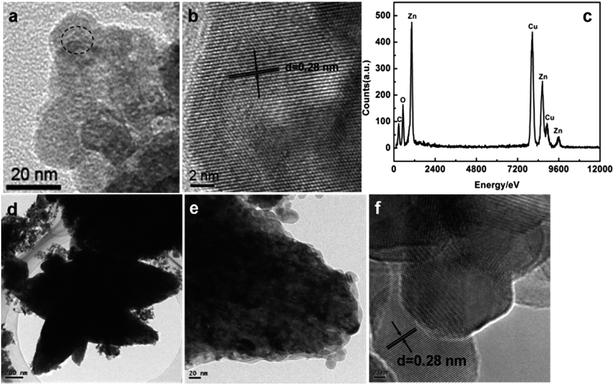 | ||
| Fig. 4 (a–c) TEM images of the ZnO nanospindles and the EDX spectra obtained from the region marked in the area in (a) respectively. (d–f) TEM images of the ZnO–Au (1%) sample. | ||
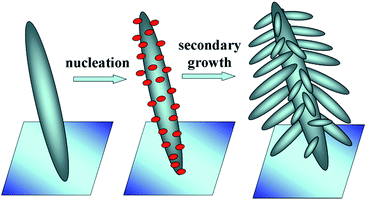
From the XRD, XPS, SEM and TEM analyses, we can say that the presence of HAuCl4 in the reaction system is crucial in controlling the morphology and crystal growth of ZnO. A plausible mechanism for the formation of the nanobranched ZnO–Au nanocomposite is schematically shown in Fig. 5. The sequence consists of the first growth of the oriented primary ZnO nanospindle. Secondly, through the EG reduction of HAuCl4 under hydrothermal conditions, the formed Au nuclei attach to the ZnO nanospindle surfaces, which changes the growth form of the ZnO crystals. Then, the Au nuclei induce different preferential growth directions of secondary nanospindle branches, leading to a pine-like 3D ZnO morphology.
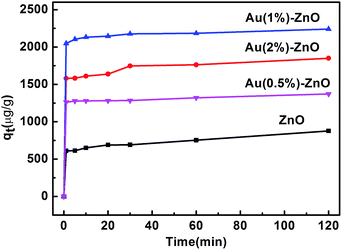
Furthermore, the performance of pure ZnO and the as-prepared nanobranched ZnO nanoarchitectures in the removal of arsenic from water was investigated. The efficiency of the adsorbent was evaluated by studying the adsorption kinetics. Fig. 6 presents the effect of the contact time on the adsorption of As(III) by different absorbents with the initial As(III) concentration fixed at 2 mg L−1. The first portion indicates that a rapid adsorption occurs after which an equilibrium is slowly achieved.45 The amount of As(III) adsorbed was calculated using eqn (1):46
 | (1) |
As can be seen, pure ZnO shows the worst adsorption ability. However, the presence of Au effectively enhances its adsorption activity. The amount of adsorbed As(III) gradually increases for the ZnO–Au samples. With a further increase in the percentage of Au to 2%, the amount of adsorbed As(III) decreases.
Adsorption kinetic experiments were further carried out to study the effect of contact time and evaluate the properties. To understand the adsorption mechanism and kinetics, two well-known kinetic models, the pseudo-first and pseudo-second order equations, were used to study the adsorption kinetics of the as-prepared nanobranched ZnO–Au (1%) adsorbent.47,48 The linear form of the pseudo-first-order equation is given as follows:49
ln(qe − qt) = ln![[thin space (1/6-em)]](https://www.rsc.org/images/entities/char_2009.gif) qe − k1t qe − k1t
| (2) |
The values of qe and k1 can be calculated from the intercept and slope of ln(qe − qt) versus t, where k1 is the rate constant of the pseudo-first-order model.
The linear form of the pseudo-second-order equation is given as follows:50
 | (3) |
The fitting results using the pseudo-first-order kinetics and the pseudo-second-order kinetics are shown in Fig. 7. The results indicate that the correlation coefficients of the pseudo-first-order kinetics and the pseudo-second-order kinetics are 0.7553 and 0.998, respectively. The correlation coefficient of the pseudo-second-order kinetics was found to be higher than that of the pseudo-first-order model. Thus, the adsorption is consistent with the pseudo-second-order model. These facts suggest that the pseudo-second-order adsorption mechanism is predominant and that the overall rate of the As(III) adsorption process appears to be controlled by the chemisorption process (Fig. 8).51
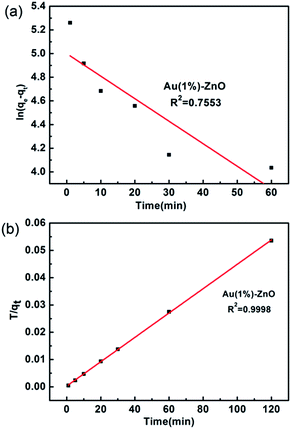 | ||
| Fig. 7 Plots of the (a) pseudo-first-order kinetics and (b) pseudo-second-order kinetics rates obtained for the adsorption of As(III) onto the ZnO–Au (1%) adsorbent. | ||
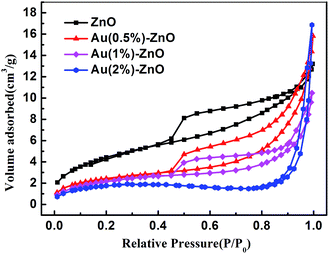
In order to analyze the reason for the discrepancy of the adsorption ability, the surface properties of the samples were measured using the BET surface area and zeta potential analysis. Table 1 shows the surface area and zeta potential values for pristine ZnO and the ZnO/Au composite samples. The BET surface area decreased as the Au concentration increased. Further increases in the concentration of Au contributed to the aggregation of the sample. As a result, the BET surface area gradually decreased. However, when compared with the Au decorated ZnO, pure ZnO with the largest BET surface area showed the worst adsorption ability. Therefore, the BET surface area was not the main factor influencing the adsorption ability.
| Sample name | BET surface area (g cm−2) | Zeta potential (mV) |
|---|---|---|
| Pure ZnO | 16.7876 | 18.2 |
| ZnO–Au (0.5%) | 9.0826 | 37 |
| ZnO–Au (1%) | 8.4051 | 42.3 |
| ZnO–Au (2%) | 6.6516 | 38.3 |
The zeta potential is another main factor influencing adsorption ability.52 The effect of the zeta potential of ZnO and the ZnO/Au composite samples on the adsorption of AsO2− (As(III)) was studied. The electrostatic interactions between AsO2− (As(III)) and the surface of the absorbent has a great effect on the adsorption capacity.53 The zeta potential was positive for all the samples. However, the ZnO/Au composite samples had a greater zeta potential than that of pure ZnO, which was beneficial for the adsorption of AsO2− (As(III)) with negative charges. This indicates that Au decoration significantly changed the surface properties of the samples.
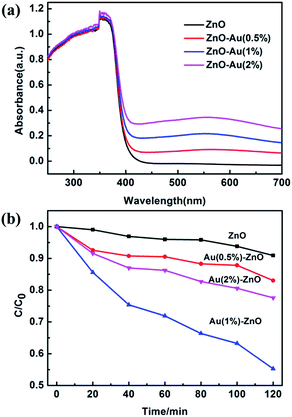
UV-Vis diffuse reflectance spectroscopy (DRS) was used to determine the optical properties of the samples, as shown in Fig. 9a. When compared with pure ZnO, the absorption edges of the samples on addition of Au provide a slight red-shift. The light absorbance of the ZnO/Au composite samples was enhanced. The red-shift of the absorption edge was attributed to the weak surface plasmon absorption of the Au particles excited at the wavelength of about 575 nm.54
The photocatalytic activity of the different samples was evaluated by their oxidation ability towards As(III) after exposure to UV light irradiation, and the results are presented in Fig. 9b. The XRD patterns of the ZnO–Au (0.5%) sample before and after the photocatalytic reaction were compared, as shown in Fig. S1.† The XRD patterns are almost the same, indicating good stability of the catalyst over the reaction period.
Prior to illumination, the suspension was kept in the dark for 120 min with stirring to obtain an adsorption–desorption equilibrium. Pure ZnO prepared under this condition displays poor activity. However, the presence of Au effectively enhances its photocatalytic activity. After 2 h of light irradiation, the photocatalytic oxidation ability towards As(III) was as follows: 9.1% for pure ZnO; 17% for ZnO–Au (0.5%); 45% for ZnO–Au (1%) and 23% for ZnO–Au (2%). The optimized photocatalytic activity of the ZnO–Au (1%) nanobranched nanoarchitectures was 5 times larger than that of pure ZnO. The enhanced photoactivity of ZnO–Au sample is attributed to the fact that an appropriate amount of Au particles is desirable to sharply improve the charge transfer and separation efficiency.55 In a general way, a Schottky barrier between the noble metal and semiconductor is beneficial for the separation of charge carriers and this separation will promote photocatalytic activity.56,57 What is more, ZnO–Au (1%) was made up of 3D branched nanostructures, which may provide more surface-active sites for loading As(III) as well as light trapping due to multi-scattering.27,28
The photostability of the ZnO–Au (1%) sample was assessed by cycling tests. In recycling, the reacted catalyst was separated by centrifuging at a speed of 10![[thin space (1/6-em)]](https://www.rsc.org/images/entities/char_2009.gif) 000 rpm. The separated catalyst was dried at 60 °C for 12 h in vacuum and used again. The results are shown in Fig. S2.† The cycling tests demonstrate that when using ZnO–Au (1%), the performance in terms of the oxidation ability toward As(III) does not show any evident decay over 3 cycles, indicating good stability of the sample.
000 rpm. The separated catalyst was dried at 60 °C for 12 h in vacuum and used again. The results are shown in Fig. S2.† The cycling tests demonstrate that when using ZnO–Au (1%), the performance in terms of the oxidation ability toward As(III) does not show any evident decay over 3 cycles, indicating good stability of the sample.
To investigate the influence of the SPR effect of Au on the photocatalytic activity, the photocatalytic activities of all the samples were evaluated by their oxidation ability towards As(III) under visible light irradiation (>400 nm). When compared with pure ZnO, the photocatalytic activity of the ZnO/Au composite samples was enhanced (see Fig. S3†).
Fig. 10 shows the transient photocurrent response of pristine ZnO and the ZnO/Au composite samples under UV light irradiation for several on–off cycles. Pure ZnO reveals a relatively low short-circuit photocurrent, whereas the loading of Au NPs results in an increase in the photocurrent, which is mainly due to the more effective charge transfer and separation. The addition of Au NPs generates a significant photocurrent under UV light irradiation, which is ascribed to the Schottky barrier between Au and ZnO. However, more Au NPs are deleterious to the photocurrent revealing more excessive recombination. In general, excessive noble metal is recognized to act as a trapping centre for photo-induced charge carriers, promoting interfacial charge transfer recombination.58 It is important to note that the strength of the photocurrent is in accordance with the photocatalytic results shown in Fig. 9b.
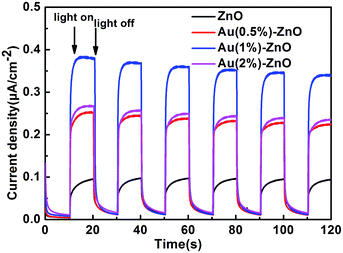 | ||
| Fig. 10 The photoelectrochemical properties of the as-prepared pristine ZnO and ZnO/Au composite samples. | ||
4. Conclusion
In summary, the 3D branched ZnO structures were prepared by in situ reduction of Au nanoparticles as crystal habit modifiers. The concentration of Au particles is crucial to the growth properties of the ZnO crystal. The morphology of pure ZnO was spindle-like. When Au particles were introduced to the system, the growth form of the ZnO crystal changed. Finally, ZnO grew along different directions to form a 3D nanobranched morphology. This unique 3D nanobranched ZnO/Au compound exhibits enhanced absorption and photo-oxidation performance for AsO2− (As(III)). What is more, the efficiency can be further improved by optimizing the Au content to 1%. The adsorption kinetics were explored in detail, and the results indicate that Au decoration significantly changed the surface properties of the samples. The zeta potential of the ZnO/Au samples was more positive, which is beneficial for the adsorption of AsO2− (As(III)) with negative charges. Moreover, the enhanced photo-oxidation performance is attributed to the coupling of Au noble metal nanoparticles and 3D branched structures. On one hand, the noble metal components facilitate the separation of the photogenerated charge carriers. On the other hand, the 3D branched nanostructures may provide more surface active sites and light trapping due to multi-scattering. Thus, this facile method is expected to adsorb and oxidize As(III) from contaminated water in one-step. What is more, noble metal particles formed in situ as habit modifiers to tune the growth form of crystals can be extended to the preparation of other metal oxide nanocatalysts.Acknowledgements
This study is supported by the National Natural Science Foundation of China (21273035, 21673041 and 21473031), National Basic Research Program of China (2013CB632405), the Natural Science Foundation of Fujian Province (No. 2016J01693) and Fujian Provincial Department of Education projects (JAT160408).References
- D. K. Nordstrom, Science, 2002, 296, 2143–2145 CrossRef CAS PubMed.
- M. Amini, K. C. Abbaspour, M. Berg, L. Winkel, S. J. Hug, E. Hoehn, H. Yang and C. A. Johnson, Environ. Sci. Technol., 2008, 42, 3669–3675 CrossRef CAS PubMed.
- R. Nickson, J. McArthur, W. Burgess, K. M. Ahmed, P. Ravenscroft and M. Rahman, Nature, 1998, 395, 338 CrossRef CAS PubMed.
- H. Yang, W. Y. Lin and K. Rajeshwar, J. Photochem. Photobiol., A, 1999, 123, 137–143 CrossRef CAS.
- H. Lee and W. Choi, Environ. Sci. Technol., 2002, 36, 3872–3878 CrossRef CAS PubMed.
- H. Park and W. Choi, J. Phys. Chem. B, 2004, 108, 4086–4093 CrossRef CAS.
- H. Park and W. Choi, J. Phys. Chem. B, 2003, 107, 3885–3890 CrossRef CAS.
- J. Lee and W. Choi, J. Phys. Chem. B, 2005, 109, 7399–7406 CrossRef CAS PubMed.
- M. A. Ferguson, M. R. Hoffmann and J. G. Hering, Environ. Sci. Technol., 2005, 39, 1880–1886 CrossRef CAS PubMed.
- S. H. Yoon, S. E. Oh, J. E. Yang, J. H. Lee, M. Lee, S. Yu and D. Pak, Environ. Sci. Technol., 2009, 43, 864–869 CrossRef CAS PubMed.
- T. Xu, Y. Cai and K. E. O'Shea, Environ. Sci. Technol., 2007, 41, 5471–5477 CrossRef CAS PubMed.
- C. Y. Chang, F. C. Tsao, C. J. Pan, G. C. Chi, H. T. Wang, J. J. Chen, F. Ren, D. P. Norton, S. J. Pearton, K. H. Chen and L. C. Chen, Appl. Phys. Lett., 2006, 88, 173503 CrossRef.
- D. Shao, H. Sun, J. Gao, G. Xin, M. Anthony Aguilar, T. Yao, N. Koratkar, J. Lian and S. Sawyer, Nanoscale, 2014, 6, 13630–13636 RSC.
- C. Tian, Q. Zhang, A. Wu, M. Jiang, Z. Liang, B. Jiang and H. Fu, Chem. Commun., 2012, 48, 2858–2860 RSC.
- C. Lizama, J. Freer, J. Baeza and H. D. Mansilla, Catal. Today, 2002, 76, 235–246 CrossRef CAS.
- N. Daneshvar, D. Salari and A. R. Khataee, J. Photochem. Photobiol., A, 2004, 162, 317–322 CrossRef CAS.
- A. A. Khodja, T. Sehili, J. F. Pilichowski and P. Boule, J. Photochem. Photobiol., A, 2001, 141, 231–239 CrossRef CAS.
- X. Sun, Q. Li, J. Jiang and Y. Mao, Nanoscale, 2014, 6, 8769–8780 RSC.
- K. S. Kim, H. Jeong, M. S. Jeong and G. Y. Jung, Adv. Funct. Mater., 2010, 20, 3055–3063 CrossRef CAS.
- X. Xu, D. Chen, Z. Yi, M. Jiang, L. Wang, Z. Zhou, X. Fan, Y. Wang and D. Hui, Langmuir, 2013, 29, 5573–5580 CrossRef CAS PubMed.
- S. H. Ko, D. Lee, H. W. Kang, K. H. Nam, J. Y. Yeo, S. J. Hong, C. P. Grigoropoulos and H. J. Sung, Nano Lett., 2011, 11, 666–671 CrossRef CAS PubMed.
- H. Lu, S. Wang, L. Zhao, J. Li, B. Dong and Z. Xu, J. Mater. Chem., 2011, 21, 4228–4234 RSC.
- D. Zhang, X. Wu, N. Han and Y. Chen, J. Nanopart. Res., 2013, 15, 1580 CrossRef.
- J. Chang, R. Ahmed, H. Wang, H. Liu, R. Li, P. Wang and E. R. Waclawik, J. Phys. Chem. C, 2013, 117, 13836–13844 CAS.
- Y. Fang, Z. Li, S. Xu, D. Han and D. Lu, J. Alloys Compd., 2013, 575, 359–363 CrossRef CAS.
- T. L. Sounart, J. Liu, J. A. Voigt, M. Huo, E. D. Spoerke and B. McKenzie, J. Am. Chem. Soc., 2007, 129, 15786–15793 CrossRef CAS PubMed.
- B. Sun, E. Marx and N. C. Greenham, Nano Lett., 2003, 3, 961–963 CrossRef CAS.
- I. Gur, N. A. Fromer, C.-P. Chen, A. G. Kanaras and A. P. Alivisatos, Nano Lett., 2006, 7, 409–414 CrossRef PubMed.
- T. Zhang, W. Dong, M. Keeter-Brewer, S. Konar, R. N. Njabon and Z. R. Tian, J. Am. Chem. Soc., 2006, 128, 10960–10968 CrossRef CAS PubMed.
- T. Zhang, W. Dong, R. N. Njabon, V. K. Varadan and Z. R. Tian, J. Phys. Chem. C, 2007, 111, 13691–13695 CAS.
- R. Zhuo, Y. Wang, D. Yan, S. Li, Y. Liu and F. Wang, Mater. Lett., 2014, 117, 34–36 CrossRef CAS.
- T. L. Sounart, J. Liu, J. A. Voigt, J. W. P. Hsu, E. D. Spoerke, Z. Tian and Y. B. Jiang, Adv. Funct. Mater., 2006, 16, 335–344 CrossRef CAS.
- M. Zhu, C. Zhai, L. Qiu, C. Lu, A. S. Paton, Y. Du and M. C. Goh, ACS Sustainable Chem. Eng., 2015, 3, 3123–3129 CrossRef CAS.
- M. Zhu, P. Chen and M. Liu, Langmuir, 2013, 29, 9259–9268 CrossRef CAS PubMed.
- S. Kuriakose, V. Choudhary, B. Satpati and S. Mohapatra, Phys. Chem. Chem. Phys., 2014, 16, 17560–17568 RSC.
- S. Sarkar, A. Makhal, T. Bora, S. Baruah, J. Dutta and S. K. Pal, Phys. Chem. Chem. Phys., 2011, 13, 12488–12496 RSC.
- J. Wang, R. Yuan, L. Xie, Q. Tian, S. Zhu, Y. Hu, P. Liu, X. Shi and D. Wang, RSC Adv., 2012, 2, 1112–1118 RSC.
- Y. Huang, F. Rosei and F. Vetrone, Nanoscale, 2015, 7, 5178–5185 RSC.
- M. Huang, Y. Yan, W. Feng, S. Weng, Z. Zheng, X. Fu and P. Liu, Cryst. Growth Des., 2014, 14, 2179–2186 CAS.
- X. D. Zhang, P. Wu, Y. Y. Shen, L. H. Zhang, Y. H. Xue, F. Zhu, D. C. Zhang and C. L. Liu, Appl. Surf. Sci., 2011, 258, 151–157 CrossRef CAS.
- M. Wu, W. J. Chen, Y. H. Shen, F. Z. Huang, C. H. Li and S.-K. Li, ACS Appl. Mater. Interfaces, 2014, 6, 15052–15060 CAS.
- H. Kung, J. Catal., 2003, 216, 425–432 CrossRef CAS.
- N. Kubota, Cryst. Res. Technol., 2001, 36, 749–769 CrossRef CAS.
- H. Lin, L. Ding, Z. Pei, Y. Zhou, J. Long, W. Deng and X. Wang, Appl. Catal., B, 2014, 160–161, 98–105 CrossRef CAS.
- N. Chiron, R. Guilet and E. Deydier, Water Res., 2003, 37, 3079–3086 CrossRef CAS PubMed.
- G. Crini, Dyes Pigm., 2008, 77, 415–426 CrossRef CAS.
- Y. Ho, Water Res., 2000, 34, 735–742 CrossRef CAS.
- W. Rudzinski and W. Plazinski, J. Phys. Chem. B, 2006, 110, 16514–16525 CrossRef CAS PubMed.
- Y. C. Wong, Y. S. Szeto, W. H. Cheung and G. McKay, J. Appl. Polym. Sci., 2004, 92, 1633–1645 CrossRef CAS.
- P. Yuan, M. Fan, D. Yang, H. He, D. Liu, A. Yuan, J. Zhu and T. Chen, J. Hazard. Mater., 2009, 166, 821–829 CrossRef CAS PubMed.
- A. A. Ahmad, B. H. Hameed and N. Aziz, J. Hazard. Mater., 2007, 141, 70–76 CrossRef CAS PubMed.
- M. Dai, J. Colloid Interface Sci., 1994, 164, 223–228 CrossRef CAS.
- S. Patil, A. Sandberg, E. Heckert, W. Self and S. Seal, Biomaterials, 2007, 28, 4600–4607 CrossRef CAS PubMed.
- M. Gao, C. K. N. Peh, W. L. Ong and G. W. Ho, RSC Adv., 2013, 3, 13169–13177 RSC.
- Q. Wang, B. Geng and S. Wang, Environ. Sci. Technol., 2009, 43, 8968–8973 CrossRef CAS PubMed.
- W. Wu, L. Liao, S. Zhang, J. Zhou, X. Xiao, F. Ren, L. Sun, Z. Dai and C. Jiang, Nanoscale, 2013, 5, 5628–5636 RSC.
- M. Teranishi, S. Naya and H. Tada, J. Am. Chem. Soc., 2010, 132, 7850–7851 CrossRef CAS PubMed.
- K. Liu, M. Sakurai, M. Liao and M. Aono, J. Phys. Chem. C, 2010, 114, 19835–19839 CAS.
Footnote |
| † Electronic supplementary information (ESI) available. See DOI: 10.1039/c6ra22243a |
| This journal is © The Royal Society of Chemistry 2016 |

