Synthesis of LaNiO3 perovskite using an EDTA-cellulose method and comparison with the conventional Pechini method: application to steam CO2 reforming of methane

Eun-hyeok Yangab and Dong Ju Moon*ab
aClean Energy Research Center, Korea Institute of Science and Technology, 5, Hwarang-ro 14-gil, Seongbuk-gu, Seoul, South Korea. E-mail: djmoon@kist.re.kr; Fax: +82-2-958-5809; Tel: +82-2-958-5867
bClean Energy & Chemical Engineering, University of Science and Technology, 217, Gajeong-ro, Yuseong-gu, Daejeon, South Korea

Received 14th September 2016 , Accepted 15th November 2016

First published on 15th November 2016


Abstract

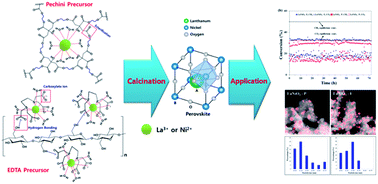
LaNiO3 type perovskite was synthesized by two different methods, and characterized by various techniques such as in situ and ex situ XRD, TPR, N2 physisorption, CO chemisorption, TGA, FT-IR, XPS, TPH, TPSR and TEM-EDS. It was found that dried Pechini and EDTA precursors had different polymerization networks, and these dissimilar bonding and coordination states of each precursor led to differences in physicochemical properties after the calcination. Thus, differences in grain size of the perovskite and textural pores, which caused different nickel particle sizes and nickel particle dispersions after the reduction, were obtained for each catalyst. The calcined catalysts were applied to steam CO2 reforming of methane. It was found that the uniform particle size distribution, smaller nickel particle size and higher contact time for LaNiO3–EDTA brought a positive effect on the catalytic activity and stability with better resistance to carbon formation for steam CO2 reforming of methane.

1. Introduction

Perovskite type oxides are normally represented by an ABO3 formula, where A sites with 12-coordination are occupied by alkali, alkaline-earth, rare-earth, or other large ions, and the B sites with 6-coordination are generally filled with transition metal cations.1 Perovskite has received much attention, since the main feature of the perovskite structure is the capability of adopting a wide range of different compositions by changing either the A or the B cations or partially substituting each cation with other cations of the same or different valences, resulting in various redox and surface properties.2–5 Therefore, it has been applied to various fields, including sensors, electrodes of certain types of fuel cells, catalysts, spintronics and memory devices.

With decades of studies, numerous methods of preparing for perovskite have been developed, among them, the Pechini method derived from sol–gel technique is the most common for the preparation of perovskite oxides.6 However, perovskite structure can also be synthesized by polymer gel combustion method,7 acrylamide gel polymerization technique,8 solid-state synthesis route,9 co-precipitation method,10 EDTA–cellulose method11 and glycine nitrate process,12 each of which gives rise to different physicochemical properties. It was reported that LaMnO3 perovskite oxide could be prepared by citrate sol–gel, glycine combustion and co-precipitation methods, respectively. Each perovskite oxide showed different physicochemical properties and catalytic activity for toluene oxidation, attributed to varying activation energies of the samples resulted by the preparation methods.13 M. Zawadzki et al. reported that La0.6Sr0.4Co0.2Fe0.8O3 perovskite prepared by various methods showed different catalytic activities for phenol methylation because of the differences in surface structure created via a variety of synthesis routes.14

Among the various applications, perovskite oxides are widely used in the field of catalysts. Many kind of perovskite oxides have been used for reforming processes as catalysts. Among reforming reactions, Steam CO2 reforming of methane (eqn (1)–(3)) has received much attention as this technology enables greenhouse gases to be converted into synthesis gas with 1.8–2.2 of H2/CO molar ratio, which is suitable for Fischer–Tropsch synthesis over cobalt-based catalysts.15

 
CH4 + H2O ↔ 3H2 + CO, ΔH0298 = 206 kJ mol−1 (1)
 
CO + H2O ↔ CO2 + H2, ΔH0298 = −41 kJ mol−1 (2)
 
CH4 + CO2 ↔ 2H2 + 2CO, ΔH0298 = 247 kJ mol−1 (3)

Noble metals and nickel have been widely investigated as active metals for reforming catalysts, and noble metal supported catalysts (Pt, Pd, Rh, Ir, and Ru) have shown prospective catalytic performance in terms of CH4 and CO2 conversions and resistance to carbon formation for dry and steam reforming reactions.16–18 However, noble metals are not suited for industrial applications due to limited availability and high cost.

An alternative metal, nickel, is more used in common as an active metal for reforming processes owing to low cost and its relative abundance. However, the critical drawback is that nickel is prone to being deactivated by carbon formation.19 Thus, numerous researches have been conducted to enhance the catalytic activity and stability of nickel-based catalysts for dry and steam reforming.

G. R. Moradi reported that LaNi1−xZnxO3 type perovskite showed high resistance to carbon formation and good catalytic activity for dry reforming of methane.20 They claimed that perovskite phase is decomposed after the reduction, and Ni is dispersed over La2O3, by which, perovskite has acquired activity for reforming reaction. Moreover, partial substitution of Zn in B site led to better resistance to carbon formation because the introduction of Zn prevented sintering of metals by the interaction between metals and oxygen.20

It was reported that the La1−xSrxCoO3 perovskite oxides with high crystallinity and high thermal stability had certain degree of oxygen mobility.21 The stabilized metallic cobalt particles were induced by the doping quantities of Sr through electronic effect. It played a vital role in the dry reforming of methane by inhibiting carbon formation and producing smaller-sized metal particles.

M. R. Goldwasser et al. reported that Ln1−xCaxRu0.8Ni0.2O3 (Ln = La, Sm, Nb) catalysts showed well defined perovskite structure or pyrochlore structure by changing Ln components due to the difference in ionic radii of each element. The smaller ionic radii favored the reactivity of the lattice oxygen, which gave rise to reduction at lower temperature.22 The generated small Ni–Ru nanoparticles prevented carbon formation and generated stable and active catalysts.22

Y. Zhang et al. reported Ni/SiO2 catalyst treated by dielectric barrier discharge plasma produced smaller nickel particle size, leading to a moderate CH4 decomposition rate and a better balance between carbon gasification and carbon deposition.23 The Ni/SiO2-DBD (dielectric barrier discharge) catalyst showed higher activity and superior carbon-resistant feature. The carbon generated over Ni/SiO2-DBD catalyst was more active and could be removed more easily.23

In this study, LaNiO3 was prepared by modified EDTA–cellulose and Pechini method, and the materials were investigated with various analytical techniques to explore any differences in physicochemical properties. Furthermore, our main goal is to develop the catalysts for steam CO2 reforming of methane for GTL (gas to liquid)–FPSO (floating production storage of floading) process, thus steam CO2 reforming of methane reactions were performed under harsh conditions to investigate the possibility of application to GTL–FPSO process.

2. Experimental

2.1 Catalyst preparation

2.1.1 Materials. Lanthanum nitrate hexahydrate (98%), nickel nitrate hexahydrate (98%), NH4OH solution (28–30%), citric acid (98.5%) and ethylene glycol (99.5%) were purchased from Samchun Chemicals, Korea. Ethylenediaminetetraacetic acid (EDTA, 99%) was purchased from Junsei, Japan. Cellulose (microcrystalline) was purchased from Alfa Aesar, UK. All of the aforementioned chemicals were used without further purification.
2.1.2 Pechini method. The equal amounts of lanthanum and nickel nitrates were dissolved in deionized water and the nitrate solution was stirred for 1 h. 3 moles of citric acid with proportion to 1 mole of metal was added to the solution. Following that, ethylene glycol with the same mole of citric acid was added. Then, the temperature of the solution was increased to 90 °C and the solution was aged for 3 h. While maintaining the solution at 90 °C, the solution in a beaker was covered with aluminum foil to prevent evaporation. After aging, the solution was concentrated until a green-colored gel was formed. The green-colored gel was dried in a vacuum oven at 110 °C for 24 h. Then, the sponge-like swollen precursor was ground using a mortar and was calcined at 400 °C for 2 h and 800 °C for 5 h with the heating rate of 1 °C min−1. The molar ratio of precursors is as follows: La(0.015)/Ni(0.015)/Citric acid(0.09)/ethylene glycol(0.09)/H2O(8.33). The catalyst was designated as LaNiO3-P.
2.1.3 EDTA–cellulose method. Equal amount of lanthanum and nickel nitrates were dissolved in deionized water and the nitrate solution was stirred for 1 h, and cellulose powder of an equal weight to total metals was added to the solution as the temperature was increased to 50 °C. After 1 h of stirring at 50 °C, the solution was mixed with EDTA–NH4OH solution, and pH was adjusted to 5 using additional NH4OH solution (EDTA[thin space (1/6-em)]:[thin space (1/6-em)]total metal ions = 1.2[thin space (1/6-em)]:[thin space (1/6-em)]1 in molar ratio). The mixture was maintained at 50 °C for 3 h and evaporated at 90 °C. This concentrated precursor was dried in a vacuum oven at 110 °C for 24 h, and the sample was calcined at 400 °C for 2 h and 800 °C for 5 h with the heating rate of 1 °C min−1. The catalyst was designated as LaNiO3-E.

2.2 Catalyst characterizations

The textual properties of the catalysts were analyzed using a physisorption analyzer (Moonsorp-I, KIST, Korea) with nitrogen adsorption at −196 °C. The catalyst sample was evacuated at 100 °C for 1 h before the measurement, in order to eliminate the physically adsorbed water and the impurities. Surface area of the catalysts was measured by BET (Brunauer–Emmett–Teller) method.

X-ray diffraction (XRD) analysis was performed with the fresh and the spent catalysts, with 2θ values between 20 and 80° using a XRD-6000 diffractometer (Shimadzu Co., Japan) with graphite-filtered Cu Kα radiation (λ = 1.5406 Å). The Ni crystallite size was measured by Debye Scherrer equation with full width at half maximum (FWHM).

In situ X-ray diffraction (XRD) analysis was performed on the dried precursor, with 2θ values between 20 and 80° using X'pert pro diffractormeter (Panalytical Co., Netherlands) with graphite-filtered Cu Kα radiation (λ = 1.5406 Å). The sample was exposed to air atmosphere, and the temperature of the chamber increased with the heating rate of 5 °C min−1. The diffraction patterns were obtained at certain points of the temperature while the temperature was increased.

Temperature programmed reduction (TPR) experiments were performed using a temperature programmed equipment (Autochem 2910, Micromeritics Co., USA). Approximately 30 mg of calcined catalyst was charged in a U-shape quartz reactor. The sample was heated with the heating rate of 10 °C min−1 from room temperature to 900 °C under 10% H2/Ar stream with the flow rate of 50 ml min−1. The amount of hydrogen consumed was measured by a thermal conductivity detector.

Temperature programmed hydrogenation (TPH) experiments for spent catalysts were carried out by the same method of TPR with the spent catalyst.

Temperature programmed surface reaction (TPSR) experiments were performed using the same equipment with TPR. About 20 mg of the fresh catalyst was charged in a U-shape quartz reactor, and the samples were reduced in 10% H2/He flow at 800 °C for 2 h, and then were cooled to 60 °C. At the first step, after the reduction, pure CH4 gas was introduced while the temperature was increased from 60 °C to 900 °C with the heating rate of 10 °C min−1. Subsequently, the gas flow was changed to He, and the temperature decreased to 60 °C. 10% CO2/He gas was introduced for the second step. The temperature was increased from 60 °C to 900 °C with the heating of 10 °C min−1. Each step for the gas consumption was measured by a thermal conductivity detector.

CO chemisorption experiments were carried out using the same equipment with TPR. For CO chemisorption studies, approximately 30 mg of calcined sample was placed between quartz wool in a U-shape quartz reactor. Each sample was reduced under 10% H2/Ar stream at 800 °C for 1 h to activate the catalysts. The catalysts were cooled down to room temperature under pure He gas. Following the reduction, 10% CO/He gas was injected to the samples in pulse at the temperature of 40 °C until the adsorbed amount of CO on the catalyst was saturated. The active metal dispersion was calculated based on the consumed CO and metal loading weight percentage.

X-ray photoelectron spectroscopy (XPS) was performed using a PHI 5000 VersaProbe instrument (Ulvac-PHI, Japan). Monochromatic Al-Kα radiation (hv = 1486.6 eV) and a take off angle of 90° relative to the sample surface were used. The measurements were carried out in a Constant Analyzer Energy mode (CAE). Peak positions were adjusted for the sample charging by setting the maximum of C 1s peak to binding energy of 284.6 eV.

Transmission electron microscope (TEM) images of the catalysts were characterized using an FEI microscope (Talos F200X, USA). Samples were dispersed in ethanol solution and the suspensions were placed in an ultrasonic bath for 30 min. Each resulting solution was deposited onto a copper grid coated with a carbon film, and the alcohol was evaporated. Finally, each copper grid containing the sample was analyzed by TEM. Each particle was identified by mapping out the sample with energy dispersive X-ray spectroscopy (EDS) equipped in TEM.

Fourier transform infrared spectroscopy (FT-IR) was analyzed with Nicolet IS50 (Thermo Electron Co. USA). The catalysts were pelletized with KBr and purged with N2. FT-IR spectra were obtained in the wavenumber range of 4000–400 cm−1.

Thermogravimetric analysis (TGA) was carried out using SDT Q600 (TA instruments Co., USA) equipment. Approximately 10 mg of each sample was placed in an alumina cup and the temperature was raised from room temperature to 1000 °C under air atmosphere with the heating rate of 10 °C min−1.

2.3 Catalytic activity tests

Catalytic activity tests were conducted in a fixed-bed reactor (material: Inconel 600, O.D.: 0.0127 m, I.D.: 0.0102 m, Length: 0.3 m). Before the tests, the catalysts were reduced at 800 °C for 1 h under the flow of 10% H2/N2. The flow rates of the reactants, CH4 and CO2, were controlled by mass flow controller (MFC), and the flow rate of deionized water was controlled by liquid delivery pump, and the water was vaporized before the catalyst bed in the reactor. The unreacted water was captured by a cold trap before the gases were injected to a gas chromatograph (GC). Gaseous products were analyzed by the online gas chromatograph unit (HP 7890A, USA) equipped with a carbosphere 60/80 packed column and a thermal conductivity detector (TCD). All reactions were carried out under the temperature of 600–650 °C, pressure of 1 bar, gas hourly space velocity (GHSV) of 14[thin space (1/6-em)]500–24[thin space (1/6-em)]000 h−1 and feed molar ratios (CH4[thin space (1/6-em)]:[thin space (1/6-em)]H2O[thin space (1/6-em)]:[thin space (1/6-em)]CO2) of 1[thin space (1/6-em)]:[thin space (1/6-em)]0.5–1[thin space (1/6-em)]:[thin space (1/6-em)]1.

3. Results and discussion

3.1 Catalyst characterizations

Table 1 represents the surface area of the prepared catalysts. The catalysts show significantly small surface area (>3 m2 g−1) as being reported for general perovskite oxides.24 It is known that surface area of perovskites is decreased, when the temperature of calcination increases because large grains of solids are derived by sintering of perovskite, when perovskite is exposed to high temperature.25 The large grains with the size of 50–150 nm were observed in TEM images as well.
Table 1 Physicochemical properties of the prepared catalysts
Catalyst Surface areaa (m2 g−1) Crystallite sizeb (nm) Distorted rhombohedral symmetryc Density (g cm−3) H2 consumptionf (mmol g−1) Nickel dispersiong (%)
a (Å) c (Å) V3) Unit celld Bulk powdere 1st peak 2nd peak
a Calculated by BET method.b Calculated by Scherrer equation with the peak around 32°.c image file: c6ra22945j-t2.tifd image file: c6ra22945j-t3.tif, M = Molar mass in g mol−1, V = unit cell volume, Na = Avogadro number.e image file: c6ra22945j-t4.tif, M = weight of catalyst, V = volume of catalyst.f Hydrogen consumption measured between 50–550 °C.g Measured by CO chemisorption.
LaNiO3-P 0.9 13.6 5.446 6.639 170.507 2.39 0.95 1.97 4.06 3.18
LaNiO3-E 2.6 12.3 5.463 6.857 177.221 2.30 0.57 2.10 3.98 4.11


Ex situ XRD patterns after the calcination at 800 °C are shown in Fig. 1. It is observed that the perovskite structure with rhombohedral symmetry was well established, and it was defined by JCPDS card (JCPDS no. 34-1181). Since the catalysts were prepared by different methods, slight shift in the peak with the strongest intensity was observed. The figure of magnified angles between 32° and 34° in inset image of Fig. 1(a) shows that the peak of LaNiO3-E was slightly shifted to lower angle compared with that of LaNiO3-P. It indicates that LaNiO3-E has larger unit cell volume, and the calculated values are presented in Table 1. The crystallographic planes (h k l) corresponding to (1 1 0) and (2 0 2) of LaNiO3 phase to a hexagonal system were used because the distorted rhombohedral symmetry is similar to an ideal hexagonal symmetry.21 Based on the calculated results, LaNiO3-E had approximately 7 Å bigger unit cell volume. It is reported that unit cell volume is related to atomic bonding distance.24 When the unit cell volume decreases, the distance between atoms also decreases. Therefore, it is speculated that the distance of La–O or Ni–O bond was shorter in the case of LaNiO3-P than that of LaNiO3-E, which affected the strength of chemical bonding.


image file: c6ra22945j-f1.tif
Fig. 1 XRD patterns of LaNiO3 catalysts (a) after the calcination at 800 °C (b) after the re-calcination of reduced catalysts at 800 °C. (▽ perovskite).

Since LaNiO3 type perovskite has been applied to the field of catalysts, it is required to investigate the reduction behavior of the prepared samples, and the reduction profiles are shown in Fig. 2. The two main reduction peaks were observed at 350 °C and 500 °C, respectively. Generally, it is reported that the first peak is related to reduction of Ni3+ to Ni2+, and the second peak is ascribed to reduction of Ni2+ to Ni0.26,27 The reduction steps are as follows:28

 
2LaNiO3 + H2 → La2Ni2O5 + H2O (4)
 
La2Ni2O5 + 2H2 → 2Ni + La2O3 + 2H2O (5)


image file: c6ra22945j-f2.tif
Fig. 2 Temperature programmed reduction profiles of LaNiO3 catalysts.

It is observed that the hydrogen consumption in the second peak is almost twice larger than that of the first one. From the above equations, 1 mole of hydrogen is used for the reduction of LaNiO3, however 2 moles of hydrogen are used for the reduction of La2Ni2O5 species. The found result of the more intense second peak well matches up with the above equations.

Another different feature between the catalysts is shift in the peaks. The peaks of LaNiO3-E were shifted to lower temperature as much as approximately 30 °C. Generally, it is known that the interaction between metal and support, and the strength of metal–oxygen bonding determine the reduction behavior.29,30 In this study, however, both of the catalysts have the same formula, therefore it is suggested that the strength of metal–oxygen bonding is the decisive factor for the reduction behaviors. It is reported that chemical bonding distance is inversely related to the bonding strength.31 As aforementioned, LaNiO3-E had longer metal–oxygen bonding distance compared with LaNiO3-P. Therefore LaNiO3-E had relatively weaker bonding strength than that of LaNiO3-P, which led to easier reducibility and shifts the peaks to lower temperature.

3.2 In situ XRD analysis

The dried precursors did not show any phase in XRD analysis, however the calcined precursors, i.e. LaNiO3, indicated certain type of phase. Thus, the phase change from amorphous to rhombohedral during the calcination step was analyzed by in situ XRD technique (Fig. 3). The un-calcined precursors showed amorphous phases in both cases. However, some peaks started to appear as the temperature increased. At first, the peaks located at 22.8°, 29.4°, 30.9°, 44.5° and 54.1° appeared at 500 °C, and each peak is related to La2Ni2O5 (22.8°, JCPDS no. 36-1230), La2O3 (29.4°, 54.1°, JCPDS no. 83-1355), La2NiO4 (30.9°, JCPDS no. 80-1915) and Ni (44.5°, JCPDS no. 87-0712). Those peaks of EDTA and Pechini ones were maintained to 600 °C and 700 °C, respectively. After that, the peaks corresponding to LaNiO3 perovskite (JCPDS no. 34-1181) appeared as the temperature further increased, and only perovskite peaks were observed eventually. It can be hypothesized that perovskite phase did not appear abruptly, but some intermediate phases were generated.

In the reduction steps, LaNiO3 phase turned into La2O3 and Ni, along with the intermediate phase of La2Ni2O5. It is reported that LaNiO3 phase is regenerated from Ni and La2O3 after re-calcination in air atmosphere.32 As shown in Fig. 1(b), perovskite structure was almost rebuilt after re-calcination; therefore it is suggested that reverse reactions (eqn (6) and (7)) against the reduction occurred during the calcination step, because La2O3, Ni and La2Ni2O5 was detected before the formation of perovskite structure. Additionally, La2NiO4 structure may be formed as intermediate (eqn (8)), since La2NiO4 phase were also detected.

 
La2O3 + 2Ni + O2 → La2Ni2O5 (6)
 
La2Ni2O5 + ½O2 → 2LaNiO3 (7)
 
La2NiO4 + O2 → 2LaNiO3 (8)


image file: c6ra22945j-f3.tif
Fig. 3 In situ XRD patterns of un-calcined catalysts (a) LaNiO3-E, (b) LaNiO3-P. (◆ La2Ni2O5, □ La2O3, △ Ni, ▼ La2NiO4, ○ perovskite).

Since the perovskite catalysts were prepared by the different methods, there is a temperature difference in the formation of perovskite structure. It is reported that triethylenetetramine (TETA) possesses four functional amine groups. TETA has a strong coordinating ability towards metal ions with electron-donating amine groups which have lone pair electrons on nitrogen, thus TETA primarily coordinates with metal ions. This metal–TETA complex leads to the homogeneous distribution of the constituent ions throughout the gel and enhances the crystallization process during heating treatment.33 Thus, the crystallization temperature of LaNiO3-E was lower than that of LaNiO3-P, because it had two functional amine groups with lone pair electrons.

3.3 Thermogravimetric analysis

The weight loss of the precursors was measured by TG analysis (Fig. 4). It is shown that both of EDTA and Pechini precursors show drastic weight loss between 200 °C and 500 °C, however different behaviors of pyrolysis were observed due to different compositions of the chelating precursors. Generally, the weight loss occurred from 30 to 200 °C results from the elimination of physically adsorbed water or coordinated water, and the abrupt weight loss between 200 °C and 500 °C might be attributed to the decomposition of some organic groups, including carboxyl and hydrocarbon groups.34 However, EDTA precursor showed more complex behaviors in terms of weight loss due to cellulose and amine groups within. At the temperature above 500 °C, slight weight loss was still observed, which was attributed to the thermal decomposition of strongly coordinated carbon source like carbonates.35
image file: c6ra22945j-f4.tif
Fig. 4 Thermogravimetric analysis of un-calcined and reduced catalysts.

It is known that LaNiO3 perovskite changes its phase reversibly under different atmospheres at high temperature. It is decomposed to Ni and La2O3 under hydrogen atmosphere at high temperature, however, it recovers perovskite phase under air atmosphere at high temperature. Thus, re-oxidation behavior of the reduced LaNiO3 was investigated by TG analysis (Fig. 4). It is observed that the weight of both reduced samples was increased during the analysis. Furthermore, the oxidation behavior consists of two steps. This result supports the suggested eqn (6) and (7) that perovskite phase is produced by passing one intermediate step.

3.4 X-ray photoelectron spectroscopy analysis

XPS analysis was carried out to investigate the surface chemical composition of un-calcined and calcined catalysts (Fig. 5 and Table 2). Some of the obtained spectra were overlapped; therefore deconvolution was conducted for each spectrum. It is observed that different C 1s XPS spectra were obtained before and after the calcination (Fig. 5(a)). In the case of both precursors, the peaks appeared at 284.7 eV, 285.8 eV, 286.2 eV and 288.2–288.6 eV correspond to C–C, C–N, C–O, C[double bond, length as m-dash]O bond, respectively.36–38 It is obvious that EDTA precursor has C–N bond which results from amine group in EDTA, and both of C–O and C[double bond, length as m-dash]O bonds are originated from carboxyl groups in citric acid and EDTA. After the calcination, however, all peaks related to C–N, C–O and C[double bond, length as m-dash]O were disappeared, and only C–C bond peak was observed, which was ascribed to the binding energy (BE) reference material. This result indicates that all organic compounds were eliminated during the calcination.
image file: c6ra22945j-f5.tif
Fig. 5 X-ray photoelectron spectroscopy analysis of un-calcined and calcined catalysts (a) C 1s, (b) O 1s, (c) La 3d and Ni 2p.
Table 2 Binding energies (eV) of core levels of the precursors and LaNiO3
Catalysts La 3d5/2 La 3d3/2 Ni 2p3/2 Ni 2p1/2 O 1s C 1s
Pechini precursor 835.1, 838.2 851.7 855.2 873.1 531.3, 532.3 284.7, 286.2, 288.2
EDTA precursor 835.4, 838.6 852.2 855.6 873.1 531.6, 532.3 284.7, 285.8, 286.2, 288.6
LaNiO3-P 833.2, 837.3 850.4 854.5 872.7 528.3, 529.1, 531.4 284.7
LaNiO3-E 833.2, 837.3 850.4 854.3 872.6 528.3, 528.9, 531.4 284.7


Fig. 5(b) represents O 1s XPS spectra. Like C 1s XPS peaks, there is a significant difference between the precursors and the perovskite. The peaks around 532.2 eV are attributed to –OH or O–C[double bond, length as m-dash]O which are originated from carboxyl or hydroxyl group in EDTA or citric acid.39 The peaks appeared around 531.2–531.5 eV indicate physically absorbed oxygen on the surface,40 oxygen from hydroxyl group (OH–)41 or carbonate which was generated by adsorption of CO2 and under air atmosphere.42,43 However, some other peaks were newly shown after the calcination. The peaks around 528.2 eV indicate O2− atoms (lattice oxygen) which are coordinated with La and Ni metals placed within the bulk of perovskite oxides, and the peak at intermediate region (528.9 eV) could be assigned to surface-oxygen species (M(La,Ni)–O).44 Based on these results, it is suggested that the polymerized metal–EDTA complex turned into perovskite structure during the calcination step under air atmosphere.

La 3d and Ni 2p XPS spectra are very complicated due to the overlapping of Ni 2p3/2 and La 3d3/2 spectra (Fig. 5(c)). Moreover, 3d5/2 peaks also present double peaks which indicate the hybridization of the f level corresponding to 3d94f1L (lower BE) and 3d94f0 (higher BE) final states.45 It is clearly observed that La and Ni spectra of the perovskite after the calcination shifted to lower binding energy compared with those of the precursors due to certain changes in valence states of the metals. It is reported that XPS peaks shift to lower or higher binding energy in accordance with coordination number of metals;46 and it is also reported that, for the same valence state of Fe, the binding energy shifts to lower value with decreasing coordination number of Fe.47 Therefore, it is suggested that the shift in XPS peaks to lower binding energy for differently prepared perovskites compared with their precursors is due to the higher coordination numbers of the perovskite precursors than those of LaNiO3-E and LaNiO3-P, which resulted from not only the coordination between chelating agent and metals but also the coordination between H2O and metals.48

The intensity of the peaks in perovskite is higher than those of the precursors because La and Ni were less exposed on the surface of the precursors due to the presence of other components such as cellulose, EDTA, citric acid and ethylene glycol.

3.5 Transmission electron microscope analysis

Fig. 6 shows the TEM images of un-calcined and calcined catalysts. Fig. 6(a) and (b) are the dried precursors prepared by Pechini and EDTA methods, respectively; two precursors show different morphologies. It is reported that esterification reaction occurred during the concentration of the precursor solution between the hydroxyl groups of ethylene glycol and the carboxylic acid groups of citric acid, therefore a polymer of metal citric acid complex was produced.49–51 In the case of EDTA method, however, the morphology was totally different from that of Pechini one. The morphology was almost identical to that of bare cellulose powder (inset image of Fig. 6(b)). Therefore, it is speculated that the cellulose structure maintained during the preparation of the precursor, and metal–EDTA complex attached to the surface of the cellulose by hydrogen bonding.
image file: c6ra22945j-f6.tif
Fig. 6 TEM images of un-calcined and calcined catalysts (a) precursor-Pechini (b) precursor-EDTA (c) LaNiO3-P (d) LaNiO3-E.

Both of LaNiO3 prepared by EDTA and Pechini methods showed almost the identical morphologies (Fig. 6(c) and (d)). However, it was observed that the grain size of the catalysts were totally different. In the case of LaNiO3-P, it showed considerably larger grain size of approximately 150–200 nm. Conversely, LaNiO3-E indicated three times smaller grain size of approximately 50 nm. Therefore, such difference might lead to more textural pores and relatively larger surface area of LaNiO3-E compared with LaNiO3-P.

3.6 Fourier transform infrared spectroscopy analysis

To clarify the polymerization between chelating agents and either ethylene glycol or cellulose, the samples were analyzed by FT-IR spectroscopy (Fig. 7). It is shown that EDTA has strong absorption bands at approximately 1714 cm−1 and 3014 cm−1, each corresponding to stretching vibration of C[double bond, length as m-dash]O in carboxylic group (–COOH) and stretching vibration of –CH2.52,53 Citric acid also has stretching vibration of C[double bond, length as m-dash]O band in carboxylic group (–COOH), however it indicates two bands at approximately 1714 cm−1 and 1750 cm−1 which are related to symmetrical and asymmetrical C[double bond, length as m-dash]O vibration, respectively, and the bands at approximately 3270 cm−1 and 3540 cm−1 are ascribed to O–H band.54
image file: c6ra22945j-f7.tif
Fig. 7 FT-IR spectra of the chelating agents and the precursors.

It is shown that the band around 1714 cm−1 was disappeared, and the adsorption bands at around 1595 cm−1 and 1390 cm−1, each of which correspond to asymmetrical and symmetrical vibration of carboxylate ion (–COO), appeared for EDTA precursor.55,56 This implies that carboxylic group of EDTA largely turned into carboxylate ion which chelated La or Ni ion, and such chelated metal–EDTA complex might be linked with –OH group in cellulose by hydrogen bonding rather than being esterified with –OH group in cellulose. In the case of Pechini precursor, it not only indicates asymmetrical and symmetrical vibration of carboxylate ion (–COO) at 1600 cm−1 and 1395 cm−1, but also represents stretching vibration of C[double bond, length as m-dash]O at 1720 cm−1, which results from ester formed by polymerization between citric acid and ethylene glycol.57 Furthermore, both of the precursors show broad adsorption bands between 2800 and 3600 cm−1. These bands may result from coordination between H2O and metals.

3.7 Application to steam CO2 reforming of methane

Since LaNiO3 is a well-known catalyst for reforming reaction, steam carbon dioxide reforming of methane was performed (Fig. 8 and Table 3). The reactions were carried out under relatively harsh conditions to investigate the catalytic stability during the reaction period. As shown in Fig. 8(a), two catalysts showed considerably stable activities during the reaction time.
image file: c6ra22945j-f8.tif
Fig. 8 Steam CO2 reforming of methane over LaNiO3 (a) 24 h, T = 650 °C, P = 1 bar, GHSV = 14[thin space (1/6-em)]500–24[thin space (1/6-em)]000 h−1, CH4[thin space (1/6-em)]:[thin space (1/6-em)]H2O[thin space (1/6-em)]:[thin space (1/6-em)]CO2 = 1[thin space (1/6-em)]:[thin space (1/6-em)]1[thin space (1/6-em)]:[thin space (1/6-em)]1 (b) 72 h, T = 600 °C, P = 1 bar, GHSV = 14[thin space (1/6-em)]500–24[thin space (1/6-em)]000 h−1, CH4[thin space (1/6-em)]:[thin space (1/6-em)]H2O[thin space (1/6-em)]:[thin space (1/6-em)]CO2 = 1[thin space (1/6-em)]:[thin space (1/6-em)]0.5[thin space (1/6-em)]:[thin space (1/6-em)]1.
Table 3 Catalytic performance of LaNiO3 catalysts
Catalysts GHSV (h−1) Temperature (°C) Feed ratio Conversiona (%) H2/CO ratioa
CH4 H2O CO2 CH4 CO2
a Average values.
LaNiO3-P 24[thin space (1/6-em)]000 650 1 1 1 42.0 9.4 2.05
14[thin space (1/6-em)]500 650 1 1 1 58.4 13.2 1.90
24[thin space (1/6-em)]000 600 1 0.5 1 29.4 15.0 1.50
LaNiO3-E 14[thin space (1/6-em)]500 650 1 1 1 56.7 16.5 1.94
14[thin space (1/6-em)]500 600 1 0.5 1 32.9 18.3 1.47


However, LaNiO3-E catalyst indicated better catalytic activity approximately 56.7% and 16.5% of CH4 and CO2 conversions. It is considered that the different GHSV of each reaction led to the different catalytic activities. Because we loaded the same amount of each catalyst (0.25 g) and set the same flow rate (106 ml min−1). However, GHSV of LaNiO3-P was higher than that of LaNiO3-E, since GHSV is calculated based on total volume flow rate of reactants over volume of catalyst (eqn (9)), and the bulk density of LaNiO3-E was quite lighter than that of LaNiO3-P. Therefore, the GHSV of LaNiO3-E was calculated as 14[thin space (1/6-em)]500 h−1, whereas the GHSV of LaNiO3-P was calculated as 24[thin space (1/6-em)]000 h−1, and the calculated bed height was 5.3 mm for LaNiO3-E and 3.2 mm for LaNiO3-P, respectively. It implies that LaNiO3-E catalyst had longer contact time of reactants on the catalyst bed, thus it might affect the catalytic activity for steam carbon dioxide reforming reaction because it has been reported that the increase in GHSV leads to a reduction in conversion of both methane and carbon dioxide,58–60 and the decrease in conversions was ascribed to the relatively lower contact time and limited availability of catalytic active sites.60

 
image file: c6ra22945j-t1.tif(9)

To clarify the previous speculation, we carried out additional experiment with LaNiO3-P catalyst. The same amount of catalyst was loaded, however the flow rates of reaction feeds were reduced approximately 0.60 time (64 ml min−1) to set the GHSV of 14[thin space (1/6-em)]500 h−1. It is clearly seen in Fig. 8(a) that LaNiO3-P with lower GHSV showed almost the same CH4 conversion with LaNiO3-E and CO2 conversion was also increased. This means that catalytic activity of LaNiO3-P increased by enhancing the contact time of reaction feeds on the catalyst. Therefore, it can be said that one of the critical factors influencing catalytic activity is GHSV in this study, and LaNiO3-E is more efficient to produce synthesis gas under the tested conditions because it has lower density leading to longer contact time of reactants on the catalyst during the reaction.

The other factor which might induce difference in catalytic activity was the dispersion of active metal in each catalyst. The metallic nickel dispersion is indicated in Table 1, and it is shown that LaNiO3-E had higher dispersion of nickel than LaNiO3-P. Subsequently, Fig. 9(a) and (b) show Ni mapping data of each catalyst after the reaction for 24 h. The images indicate that LaNiO3-E catalyst had relatively uniform particle size and better dispersion compared with those of LaNiO3-P, and the particle size distribution was also narrower for LaNiO3-E. These could be caused by the fact that LaNiO3-P catalyst had three times larger grain size and had less textural pores compared with LaNiO3-E, thus the active sites were not properly dispersed during the reduction and the reaction. LaNiO3-P had both small and large particles (>50 nm); however LaNiO3-E did not have large particle size with the range of 50–70 nm. These particle sizes and nickel metal dispersion affected the catalytic activity as well.


image file: c6ra22945j-f9.tif
Fig. 9 TEM images of Ni dispersion and particle size distribution of used catalysts (a) after 24 h reaction of LaNiO3-P, (b) of LaNiO3-E, after 72 h reaction (c, e) of LaNiO3-P, (d, f) of LaNiO3-E.

Since the catalytic tests for 24 h at 650 °C did not show any carbon deposition on the catalysts in TGA and XRD results, the long term catalytic activity tests with much harsher condition were conducted to identify the amount of carbon deposition on the catalysts. Fig. 8(b) depicts the performance of each catalyst for 72 h. It is shown that both catalysts do not represent deactivation during the reaction time, but catalytic activities are not the same because of the reasons which were mentioned previously, such as contact time, particle size, and metal dispersion. Subsequently, each catalyst indicated different rate of carbon deposition.

Fig. 10 depicts XRD patterns after the reaction for 24–72 h. It is shown that the peaks related to La2O2CO3 (JCPDS no. 841963) and Ni0 (JCPDS no. 87-0712) were observed after the reaction because La2O3 reacting with CO2 formed La2O2CO3 (eqn (10)), which is a well-known carbon eliminator (eqn (11)).61,62

 
La2O3 + CO2 → La2O2CO3 (10)
 
La2O2CO3 + C → La2O3 + 2CO (11)


image file: c6ra22945j-f10.tif
Fig. 10 XRD patterns of LaNiO3 catalysts after steam CO2 reforming reaction (a) for 24 h (b) for 72 h. (◆ La2O2CO3 ○ Ni ☆ carbon).

Besides, no peak corresponding to carbon species was observed in XRD patterns of both catalysts for 24 h reaction time (Fig. 10(a)). However, LaNiO3-P catalyst showed carbon species (JCPDS No. 751621) after the long term activity test (Fig. 10(b)). This indicates that considerable amount of carbon was deposited during the reaction time.

Fig. 9(c)–(f) shows the TEM images of nickel particle dispersions and carbon formation after the reaction for 72 h. It is clearly seen that a lot of carbon nanotubes (CNTs) were formed on LaNiO3-P catalyst (Fig. 9(c)). On the contrary, any CNTs related carbon species were not observed for LaNiO3-E catalyst (Fig. 9(d)). Fig. 9(e) and (f) show the dispersion of nickel particles on the support. With the comparison of short term reaction, it is obvious that nickel particles were largely sintered. However, nickel particles are still uniformly distributed on the support for LaNiO3-E as the same as short term reaction period of LaNiO3-E. It is reported that larger particles have a larger number of step defect sites which facilitate the initiation of whisker growth.63 Thus, LaNiO3-P showed less resistance to carbon formation owing to larger particle size and poor distribution of nickel particles.

To clarify the carbon species, Temperature programmed hydrogenation experiment was conducted (Fig. 11(a)). The peaks originated at around 100–300 °C, 300–650 °C and 650 °C were identified as α-, β- and γ-carbon, respectively.64–66 Generally, α-carbon is defined as reactive carbon which is related to amorphous carbon placed at the interior of the active metal particles67 and β-carbon is assigned to carbon whisker which is attributed to filamentous whisker carbon, probably derived from CO disproportionation and CH4 decomposition,68 whereas γ-carbon was ascribed to inert carbon with poor activity. It is reported that α-carbon and β-carbon are non-stable carbonaceous species and they played a role of reactive intermediate enhancing the catalytic activity. However, inert γ-carbon was hard to be removed, and led to the catalytic deactivation.65 As it can be seen in Fig. 11(a), LaNiO3-E have two types of carbon species designated as α- and β-carbon. However, LaNiO3-P catalyst have three types of carbon species allocated as α-, β- and γ-carbon. Therefore, the LaNiO3-P catalyst, on which inert γ-carbon species was produced, will certainly have catalytic deactivation if the reaction time is extended longer than 72 h.


image file: c6ra22945j-f11.tif
Fig. 11 (a) Temperature programmed hydrogenation profiles and (b) thermogravimetric analysis of spent catalysts for 72 h.

Fig. 11(b) represents TGA profiles after the reaction for 72 h. The weight increase for LaNiO3-E in the temperature range of 300–500 °C mostly resulted from the re-oxidation of metallic species, such as nickel,69,70 and LaNiO3-E catalyst indicates approximately 12% of weight change. Therefore it can be said that there was no severe carbon formation during the reaction period as identified in the previous statements. However, LaNiO3-P catalyst shows relatively drastic weight change approximately 40% because tremendous CNTs were deposited on the catalysts. Besides, LaNiO3-P did not have increase in catalyst weight in the temperature range of 300–500 °C because the decrease in weight by carbon oxidation offset the increase in weight by metal oxidation.

Fig. 12 shows the results of CH4 and CO2 TPSR of the catalysts. It is observed that almost the same peaks shape of CH4 and CO2 consumption were observed since both catalysts had the same formula (LaNiO3). However, there was a slight difference in the amount of gas consumptions. In the case of LaNiO3-P, it had lower contact time than LaNiO3-E, thus less amount of CH4 was activated. As a result, the amount of CO2 consumption by carbon gasification was lower as well. From the TPSR graph, it is recognized that the CH4 was activated at lower temperature compared with that of CO2. Therefore, it could be said that the activation energy of CH4 was lower than the activation energy of CO2 for these catalysts.


image file: c6ra22945j-f12.tif
Fig. 12 Temperature programmed surface reaction of the prepared catalysts.

3.8 Discussion

Since EDTA and citric acid act as chelating agents, it is obvious that they coordinate with metal ions. However, each precursor had unique network structures. Thus, we speculated structure models of each precursor based on XPS, FT-IR and TEM analyses, and it is demonstrated in Fig. 13. In the case of Pechini precursor, carboxylic acid group in citric acid and hydroxyl group in ethylene glycol were polymerized by esterification, and the remaining hydroxyl group in citric acid, and H2O molecules coordinated with metal ions (La3+ or Ni2+). In the case of EDTA precursor, however, it did not show vibration of esterification in IR spectrum, but it only indicated vibration of carboxylate ion. Therefore, it is considered that esterification did not occur, but carboxylate ion in EDTA and H2O coordinated with metal ions, and the metal–EDTA complex attached to the surface of cellulose via hydrogen bonding between carboxylate ion in metal–EDTA complex and hydroxyl group in cellulose. After the calcination, both of the precursors had identical perovskite structure. From the aforementioned statements in previous sections, however, textural properties of perovskite can be changed by preparation methods.
image file: c6ra22945j-f13.tif
Fig. 13 Structure models of each precursor.

There are some factors that influence the catalytic activity. The density of unit cell was slightly lower for LaNiO3-E. However, the density of bulk powder was quite lower for LaNiO3-E compared with LaNiO3-P. It was observed that EDTA precursor was swollen at the temperature of 300 °C because nitric oxides gases came out from the EDTA precursor. Thus, it is hypothesized that many macro-sized pores were generated in this step, consequently LaNiO3-E had much lighter density than LaNiO3-P, which was not swollen during the calcination step. As mentioned in the reaction section, the lower density increased the bed height of the catalyst, subsequently leading to longer contact time of the reactants.

Based on the in situ XRD results, the intermediates were already formed at 300 °C for LaNiO3-E catalyst because the lone pair electrons from amine group in EDTA accelerated crystallization of perovskite at lower temperature, therefore it is considered that crystallization of perovskite was completed at lower temperature. These factors resulted in smaller particles for LaNiO3-E compared with LaNiO3-P. This smaller particles of perovskite also caused generating smaller nickel particles and better dispersion of nickel particles, leading to better catalytic activity for steam CO2 reforming of methane over LaNiO3-E.

Since this reaction was also performed for the production of syngas, it is important to mention about syngas ratio. In the Table 3, the H2/CO ratio for 650 °C conditions was around 1.8–1.9. However, the H2/CO ratio for 600 °C conditions decreased from 1.8–1.9 to 1.4 due to the reduction of H2O supply, leading to pseudo dry reforming circumstance, thus H2/CO ratio was closer to 1. The conditions of catalytic tests were not suitable for the industrial applications, however it can be said that LaNiO3-E catalyst will show good performance under mild reaction conditions. Additionally, we insist from obtained data that steam CO2 reforming of methane can produce various H2/CO ratio by adjusting reaction feed ratio.

In this study, EDTA–cellulose method was used for synthesis of perovskite. However, this method is quite simply and easy to prepare for the catalysts, thus this method could be used in various catalysts field which consist of metal–support system.

4. Conclusions

LaNiO3 type perovskite was prepared by two different methods and characterized by various techniques, and it was applied to steam CO2 reforming of methane. It was found that some differences in physicochemical properties were observed by varying the preparation methods. Based on the XRD analysis, perovskite structure was well established via both methods, and perovskite was formed by passing one intermediate step. It was also identified by the XPS, FT-IR and TEM analyses that each precursor was formed with unique networks based on different chemical bondings between chelating agents and metal ions.

The main features, which affected catalytic performance, were density, particle size and metal dispersion of each perovskite. It was found that a gap in the temperature of the crystallization was observed, and LaNiO3-E had lower temperature in terms of the formation of perovskite phase because the lone pair electrons from amine group in EDTA accelerated crystallization of perovskite at lower temperature. Due to aforementioned reasons, LaNiO3-E had smaller perovskite particle size and more textural pores, so that it led to smaller nickel particle size and uniform distribution of nickel particles on the support after the reduction. Additionally, the lower density of LaNiO3-E led to higher contact time of reactants. Thus, the advantages of LaNiO3-E brought positive effect on catalytic activity and stability with less carbon formation for steam carbon dioxide reforming of methane.

Acknowledgements

This work was supported and funded by Korea Institute of Science and Technology (Project No. 2E26570) and supported and funded by Ministry of Trade, Industry and Energy Republic of Korea (Project No. 20142010102790).

References

  1. H. Tanaka and M. Misono, Curr. Opin. Solid State Mater. Sci., 2001, 5, 381–387 CrossRef CAS.
  2. L. G. Tejuca and J. L. G. Fierro, Properties and applications of perovskite-type oxides, Marcel Dekker Inc., New York, 1993 Search PubMed.
  3. P. Lacorre, J. B. Torrance, J. Pannetier, S. A. I. Nazzal, P. W. Wang and T. C. Huang, J. Solid State Chem., 1991, 91, 225–237 CrossRef CAS.
  4. R. N. Singh, S. K. Tiwari, S. P. Singh, A. N. Jain and N. K. Singh, Int. J. Hydrogen Energy, 1997, 22, 557–562 CrossRef CAS.
  5. M. S. Chen, T. B. Wu and J. M. Wu, Appl. Phys. Lett., 1996, 68, 1430–1432 CrossRef CAS.
  6. A. M. Huízar-Félix, T. Hernández, S. de la Parra, J. Ibarra and B. Kharisov, Powder Technol., 2012, 229, 290–293 CrossRef.
  7. A. Calleja, M. Segarra, I. G. Serradilla, X. G. Capdevila, A. I. Fernández and F. Espiell, J. Eur. Ceram. Soc., 2003, 23, 1369–1373 CrossRef CAS.
  8. A. Calleja, X. G. Capdevila, M. Segarra, C. Frontera and F. Espiell, J. Eur. Ceram. Soc., 2011, 31, 121–127 CrossRef CAS.
  9. Z. Junwu, S. Xiaojie, W. Yanping, W. Xin, Y. Xujie and L. Lude, J. Rare Earths, 2007, 25, 601–604 CrossRef.
  10. P. Zhao, R. C. Yu, F. Y. Li, Z. X. Liu, M. Z. Jin and C. Q. Jin, J. Appl. Phys., 2002, 92, 1942–1944 CrossRef CAS.
  11. Z. Shao, G. Xiong, S. Sheng, H. Chen and L. Li, Stud. Surf. Sci. Catal., 1998, 118, 431–439 CrossRef CAS.
  12. Y. J. Yang, T. L. Wen, H. Tu, D. Q. Wang and J. Yang, Solid State Ionics, 2000, 135, 475–479 CrossRef CAS.
  13. C. Zhang, Y. Guo, Y. Guo, G. Lu, A. Boreave, L. Retailleau, A. Baylet and A. Giroir-Fendler, Appl. Catal., B, 2014, 148–149, 490–498 CrossRef CAS.
  14. M. Zawadzki, H. Grabowska and J. Trawczyński, Solid State Ionics, 2010, 181, 1131–1139 CrossRef CAS.
  15. J. S. Jung, S. W. Kim and D. J. Moon, Catal. Today, 2012, 185, 168–174 CrossRef CAS.
  16. M. Usman, W. M. A. Wan Daud and H. F. Abbas, Renewable Sustainable Energy Rev., 2015, 45, 710–744 CrossRef CAS.
  17. F. Morales-Cano, L. F. Lundegaard, R. P. Tiruvalam, H. Falsig and M. S. Skjøth-Rasmussen, Appl. Catal., A, 2015, 498, 117–125 CrossRef CAS.
  18. K. Yoshida, N. Begum, S. Ito and K. Tomishige, Appl. Catal., A, 2009, 358, 186–192 CrossRef CAS.
  19. H. C. Lee, K. W. Siew, M. R. Khan, S. Y. Chin, J. Gimbun and C. K. Cheng, J. Energy Chem., 2014, 23, 645–656 CrossRef.
  20. G. R. Moradi, M. Rahmanzadeh and F. Khosravian, J. CO2 Util., 2014, 6, 7–11 CrossRef CAS.
  21. G. Valderrama, C. U. de Navarro and M. R. Goldwasser, J. Power Sources, 2013, 234, 31–37 CrossRef CAS.
  22. M. R. Goldwasser, M. E. Rivas, E. Pietri, M. J. Pérez-Zurita, M. L. Cubeiro, L. Gingembre, L. Leclercq and G. Leclercq, Appl. Catal., A, 2003, 255, 45–57 CrossRef CAS.
  23. Y. Zhang, W. Wang, Z. Wang, X. Zhou, Z. Wang and L. C. Liu, Catal. Today, 2015, 256, 130–136 CrossRef CAS.
  24. U. Oemar, M. L. Ang, W. F. Hee, K. Hidajat and S. Kawi, Appl. Catal., B, 2014, 148–149, 231–242 CrossRef CAS.
  25. G. Valderrama, M. R. Goldwasser, C. U. de Navarro, J. M. Tatibouët, J. Barrault, C. Batiot-Dupeyrat and F. Martínez, Catal. Today, 2005, 107–108, 785–791 CrossRef CAS.
  26. S. M. Lima, J. M. Assaf, M. A. Peña and J. L. G. Fierro, Appl. Catal., A, 2006, 311, 94–104 CrossRef CAS.
  27. M. Kuras, R. Roucou and C. Petit, J. Mol. Catal. A: Chem., 2007, 265, 209–217 CrossRef CAS.
  28. G. Valderrama, A. Kiennemann and M. R. Goldwasser, Catal. Today, 2008, 133–135, 142–148 CrossRef CAS.
  29. L. Luo, Y. Ouyang, X. Lu and Q. Chen, Bull. Chem. Soc. Ethiop., 2007, 21(3), 389–395 CrossRef CAS.
  30. R. Sumathi, K. Johnson, B. Viswanathan and T. K. Varadarajan, Appl. Catal., A, 1998, 172, 15–22 CrossRef CAS.
  31. J. McMurry, Organic Chemistry, Cengage Learning Co., Boston, 5th edn, 2001 Search PubMed.
  32. R. Pereñíguez, V. M. González-DelaCruz, J. P. Holgado and A. Caballero, Appl. Catal., B, 2010, 93, 346–353 CrossRef.
  33. N. A. Abdullah, N. Osman, S. Hasan and O. H. Hassan, Int. J. Electrochem. Sci., 2012, 7, 9401–9409 CAS.
  34. A. Balasubramanian, N. Karthikeyan and V. V. Giridhar, J. Power Sources, 2008, 185, 670–675 CrossRef CAS.
  35. S. Liu, K. Li and R. Hughes, Mater. Res. Bull., 2004, 39, 119–133 CrossRef CAS.
  36. R. Navamathavan, C. Y. Kim, A. S. Jung, C. K. Choi and H. J. Lee, J. Korean Phys. Soc., 2008, 53, 351–356 CAS.
  37. C. Ronning, H. Feldermann, R. Merk, H. Hofsäss, P. Reinke and J. U. Thiele, Phys. Rev. B: Condens. Matter Mater. Phys., 1998, 58, 2207–2215 CrossRef CAS.
  38. P. M. López-Pérez, A. P. Marques, R. M. P. da Silva, I. Pashkuleva and R. L. Reis, J. Mater. Chem., 2007, 17, 4064–4071 RSC.
  39. V. Datsyuk, M. Kalyva, K. Papagelis, J. Parthenios, D. Tasis, A. Siokou, I. Kallitsis and C. Galiotis, Carbon, 2008, 46, 833–840 CrossRef CAS.
  40. W. Song, S. K. So and L. Cao, Appl. Phys. A, 2001, 72, 361–365 CrossRef CAS.
  41. S. Mickevičius, S. Grebinskij, V. Bondarenka, H. Tvardauskas, M. Senulis, V. Lisauskas, K. Šliužienė, B. Vengalis, B. A. Orlowski and E. Baškys, Lith. J. Phys., 2010, 50(3), 317–323 CrossRef.
  42. C. Heine, B. A. J. Lechner, H. Bluhm and M. Salmeron, J. Am. Chem. Soc., 2016, 138, 13246–13252 CrossRef CAS PubMed.
  43. R. J. Behm and C. R. Brundle, Surf. Sci., 1991, 255, 327–343 CrossRef CAS.
  44. D. H. Prasad, S. Y. Park, E. O. Oh, H. Ji, H. R. Kim, K. J. Yoon, J. W. Son and J. H. Lee, Appl. Catal., A, 2010, 447–448, 100–106 Search PubMed.
  45. S. W. Han, J. S. Kang, K. H. Kim, J. D. Lee, J. H. Kim, S. C. Wi and C. Mitra, Phys. Rev. B: Condens. Matter Mater. Phys., 2004, 69, 104406 CrossRef.
  46. M. Todea, E. Vanea, S. Bran, P. Berce and S. Simon, Appl. Surf. Sci., 2013, 270, 777–783 CrossRef CAS.
  47. M. W. Gaultois and A. P. Grosvenor, J. Phys. Chem. C, 2010, 114, 19822–19829 CAS.
  48. X. Li, V. Agarwal, M. Liu and W. S. Rees Jr, J. Mater. Res., 2000, 15, 2393–2399 CrossRef CAS.
  49. Q. N. Pham, M. Vijayakumar, C. Bohnke and O. Bohnke, J. Solid State Chem., 2005, 178, 1915–1924 CrossRef CAS.
  50. R. Andoulsi, K. Horchani-Naifer and M. Férid, Ceramica, 2012, 58, 126–130 CAS.
  51. D. A. Kumar, S. Selvasekarapandian, H. Nithya, J. Leiro, Y. Masuda, S. D. Kim and S. K. Woo, Powder Technol., 2013, 235, 140–147 CrossRef CAS.
  52. Y. E. Zhao, C. Y. Cai, Y. Y. Luo and Z. H. He, J. Supercond. Novel Magn., 2004, 17, 383–387 CrossRef CAS.
  53. D. Koodynska, J. Ryczkowski and Z. Hubicki, Eur. Phys. J.: Spec. Top., 2008, 54, 339–343 CrossRef.
  54. L. C. Bichara, H. E. Lanús and S. A. Brandán, J. Mol. Liq., 2014, 200, 448–459 CrossRef CAS.
  55. A. Khatib, F. Aqra, D. Deamer and A. Oliver, J. Argent. Chem. Soc., 2009, 97, 1–10 CAS.
  56. T. Noguchi, T. Ono and Y. Inoue, Biochim. Biophys. Acta, 1995, 1232, 59–66 CrossRef.
  57. S. Qiu, H. Fan and X. Zheng, J. Sol-Gel Sci. Technol., 2007, 42, 21–26 CrossRef CAS.
  58. Y. Chen, Y. Wang, H. Xu and G. Xiong, Appl. Catal., B, 2008, 80, 283–294 CrossRef.
  59. J. M. Lavoie, Front. Chem., 2014, 2, 1–17 CAS.
  60. H. R. Gurav, R. Bobade, V. L. Das and S. Chilukuri, Indian J. Chem., Sect. A: Inorg., Bio-inorg., Phys., Theor. Anal. Chem., 2012, 51, 1339–1347 Search PubMed.
  61. K. Sutthiumporn, T. Maneerung, Y. Kathiraser and S. Kawi, Int. J. Hydrogen Energy, 2012, 37, 11195–11207 CrossRef CAS.
  62. E.-H. Yang, Y. S. Noh, S. Ramesh, S. S. Lim and D. J. Moon, Fuel Process. Technol., 2015, 134, 404–413 CrossRef CAS.
  63. W. Y. Lee, J. Hanna and A. F. Ghoniem, J. Electrochem. Soc., 2013, 160(2), F94–F105 CrossRef CAS.
  64. X. Y. Quek, D. Liu, W. N. E. Cheo, H. Wang, Y. Chen and Y. Yang, Appl. Catal., B, 2010, 95, 374–382 CrossRef CAS.
  65. M. S. Fan, A. Z. Abdullah and S. Bhatia, Appl. Catal., B, 2010, 100, 365–377 CrossRef CAS.
  66. J. Zhu, X. Peng, L. Yao, X. Deng, H. Dong, D. Tong and C. Hu, Int. J. Hydrogen Energy, 2013, 38, 117–126 CrossRef CAS.
  67. E. B. Pereira and G. A. Martin, Appl. Catal., A, 1994, 115, 135–146 CrossRef CAS.
  68. M. Rezaei, S. M. Alavi, S. Sahebdelfar and Z. F. Yan, J. Nat. Gas Chem., 2006, 15, 327–334 CrossRef CAS.
  69. N. Wang, X. Yu, Y. Wang, W. Chu and M. Liu, Catal. Today, 2013, 212, 98–107 CrossRef CAS.
  70. G. S. Gallego, J. G. Marín, C. Batiot-Dupeyrat, J. Barrault and F. Mondragón, Appl. Catal., A, 2009, 369, 97–103 CrossRef CAS.

This journal is © The Royal Society of Chemistry 2016