
Magnetic solid-phase extraction coupled with HPLC-Q-TOF-MS for rapid analysis of tyrosinase binders from San-Bai decoction by Box–Behnken statistical design†
Yi Tao*ab,
Dandan Suab,
Yingshan Duab,
Weidong Liab,
Baochang Caiab,
Liuqing Dia,
Liyun Shic and
Lihong Hud
aSchool of Pharmacy, Nanjing University of Chinese Medicine, Xianlin Campus, 138 Xianlin Avenue, Nanjing 210023, PR China. E-mail: taoyi1985812@126.com; Fax: +86-25-86798281; Tel: +86-25-86798281
bJiangsu Key Laboratory of Chinese Medicine Processing, Nanjing University of Chinese Medicine, Nanjing, 210023, PR China
cDepartment of Microbiology and Immunology, Nanjing University of Chinese Medicine, Nanjing, 210023, PR China
dState Key Laboratory of Drug Research, Shanghai Institute of Materia Medica, University of Chinese Academy of Sciences, Chinese Academy of Sciences, Shanghai, 201203, PR China
First published on 11th November 2016
Abstract
Tyrosinase is the rate-limiting enzyme for controlling the production of melanin. A very precise, sensitive and convenient solid-phase extraction based approach was developed for extract and analysis of tyrosinase binders from San-Bai decoction. Tyrosinase binders were captured by using tyrosinase conjugated magnetic beads. The retained tyrosinase binders were dissociated and analyzed by high performance liquid chromatography and quadrupole-time-of-flight mass spectrometry. The powder X-ray diffraction (XRD), transmission electron microscopy (TEM), vibration sample magnetometer (VSM) and Fourier transform infrared (FT-IR) spectroscopy techniques were used for the characterization of tyrosinase conjugated magnetic beads. A variety of experimental conditions such as incubation temperature, buffer pH and ion strength, which may affect extraction yield, were optimized through Box–Behnken statistical design and response surface methodology by using paeoniflorin as a model compound. The optimal incubation conditions were as follows: wash times: 4, wash solvent: 10% acetonitrile–water, incubation time: 30 min, temperature: 34.84 °C, ion strength: 193.67 mM, pH: 6.98. The established approach was successfully applied for the extraction of tyrosinase binders from San-Bai decoction. The tyrosinase inhibitory assay was employed for validation of the activities of these identified binders. Fifteen tyrosinase inhibitors were identified, and nine of which, including benzoylpaeoniflorin, benzoyloxypaeoniflorin, galloylpaeoniflorin, paeonolide, oxypaeoniflora, albiflorin, ononin, mudanpioside C and apiopaeonoside, were reported for the first time.
Introduction
The development of convenient and reliable methods for solid-phase extraction of tyrosinase binders is a valuable task because tyrosinase plays crucial roles in many biological processes and is a potential biomarker in clinical diagnosis.1 As an oxidase, tyrosinase is the rate-limiting enzyme for controlling the production of melanin. It is mainly involved in two distinct reactions of melanin synthesis; firstly, the hydroxylation of a monophenol and secondly, the conversion of an o-diphenol to the corresponding o-quinone. o-Quinone undergoes several reactions to eventually form melanin. Tyrosinase activity is very important. If uncontrolled during melanoma, it results in increased melanin synthesis. Recent evidences also revealed that the expression levels of tyrosinase are very much elevated in melanoma and skin tumor, suggesting tyrosinase as a useful biomarker for melanoma and skin tumor.2,3 Decreasing tyrosinase activity has been targeted for the prevention of melanoma and skin tumor.Several polyphenols, including flavonoids or stilbenoid, substrate analogues, free radical scavengers, and copper chelators, have been known to inhibit tyrosinase.4 Henceforth, the medical industries are focusing research on tyrosinase inhibitors to treat melanoma and skin tumor. A variety of plants from traditional Chinese medicine had been evaluated for their anti-tyrosinase activity.5 San-Bai decoction is a traditional herbal preparation for the treatment of melasma, rough skin, sallow complexion, pigmentation and acne. The recipe of San-Bai decoction is consisted of four herbal medicines, including Paeonia lactiflora Pall, Atractylodes macrocephala Koidz, Smilax china L. and honey-processed Glycyrrhiza uralensis Fisch. Paeoniflorin, one of the major compounds of San-Bai decoction, was proved to show tyrosinase inhibitory effect.6 Therefore, it was hypothesized that anti-tyrosinase agents might exist in the decoction.
Magnetic beads have recently been considered as promising platforms for separation and detection applications, including aptamer capture,7 cell separation,8 bacteria detection,9 protein purification10 and ligand fishing.11 The surface of magnetic beads could be easily modified and conjugated with antibodies, enzymes, proteins or specific ligands that enable them to bind to other biologically active compounds or receptors on the cell surface. The superparamagnetic properties facilitate the separation of the biomolecule conjugated magnetic beads from their matrix. Using magnetic beads as the support of immobilized enzymes has some advantages: (i) higher specific surface area obtained for the binding of a larger amount of enzymes, (ii) lower mass transfer resistance and less fouling, and (iii) the selective separation of immobilized enzymes from a reaction mixture by the application of a magnetic field.
In the present, a new tyrosinase conjugated magnetic beads based approach was established to rapidly extraction of tyrosinase binders from San-Bai decoction. Schematic diagram of the tyrosinase conjugated magnetic beads based solid-phase extraction approach (MSPE) was shown in Fig. 1. First, tyrosinase is conjugated to magnetic beads by amide linkage using 1-(3-dimethyl aminopropyl)-3-ethylcarbodiimide (EDC) and N-hydroxysuccinimide (NHS) as reaction reagents. Secondly, San-Bai decoction was incubated with the tyrosinase conjugated magnetic beads. Subsequently, the unbound compounds and nonspecific binding compounds were separated and discarded in the washing step; while the bound compounds were disclosed from tyrosinase by the organic denature reagents. Finally, the disclosed specific bound compounds were analyzed by HPLC-Q-TOF-MS and the activities of bound compounds were validated using tyrosinase inhibitory assay.
 | ||
| Fig. 1 Schematic diagram of the tyrosinase conjugated magnetic beads based solid-phase extraction approach. | ||
Experimental
Chemicals and reagents
Tyrosinase (from mushroom, EC:1.14.18.1), 1-(3-dimethylaminopropyl)-3-ethyl- carbodiimide (EDC), N-hydroxysuccinimide (NHS), 2-(N-morpholino)ethanesulfonic acid (MES) were purchased from Sigma Chemical Co. Substrate L-tyrosine was purchased from Shanghai Ryon Biological Technology Co. Monodispersed carboxyl functionalized magnetite beads were obtained from Tianjin BaseLine ChromTech Research Centre (1 mg mL−1, 400–500 nm, surface area 2.0 × 10⁻⁸ cm2). HPLC-grade acetonitrile was obtained from Merck. Benzoyloxypaeoniflorin, galloylpaeoniflorin, mudanpioside C, oxypaeoniflora, benzoylpaeoniflorin, apiopaeonoside and paeonolide were purchased from Chroma Biotechnology Co. Gallic acid and liquiritin apioside were purchased from Sichuan Weikeqi Biotechnology Co. Paeoniflorin, albiflorin, liquiritin, ononin, isoliquiritigenin and glycyrrhizic acid were obtained from Chengdu Herbpurify Co. Arbutin was obtained from Aladdin Industrial Co. Kojic acid and vanillic acid were purchased from Shanghai Yuanye Biological Technology Co. Honey was purchased from Shanghai Guanshengyuan Bee Products Co. 96-well microtiter plates were purchased from Corning Inc. All solutions and dilutions were prepared with ultrapure water from a milli-Q water purification system.The root of Paeonia lactiflora Pall was collected in Chuxiong County, Yunnan Province (lot: 20140907). The root of Atractylodes macrocephala Koidz was collected in Baoxing County, Sichuan Province (lot: 20141015). The rhizome of Smilax china L. was collected in Yongsheng County, Yunnan Province (lot: 20141108). The root of Glycyrrhiza uralensis Fisch was collected in Hanggin Banner, Inner Mongolia Municipality (lot: 20140925). All of the plants were authorized by an expert in the field. Voucher specimens were deposited in the herbarium of Jiangsu Key Laboratory of Chinese Medicine Processing, Nanjing University of Chinese Medicine. The sample preparation procedures were as follows: first, the root of Glycyrrhiza uralensis Fisch was honey-processed. Appropriate amount of boiling water was used to dilute honey to a proper concentration (about 85% (v/v)). Then, the honey dilution was added and mixed with the root of Glycyrrhiza uralensis Fisch. After that, the root of Glycyrrhiza uralensis Fisch was stir-fried in a container with gentle heat for 5 min and then removed from the container and cooled. Second, the recipe of Sanbai decoction included 5 g of Paeonia lactiflora Pall, 5 g of Atractylodes macrocephala Koidz, 5 g of Smilax china L and 3 g of Glycyrrhiza uralensis Fisch. The four crude drugs were immersed into 150 mL water for an overnight and then boiled at 100 °C for 2 h. The extract was filtered and centrifuged at 13![[thin space (1/6-em)]](https://www.rsc.org/images/entities/char_2009.gif) 400 rpm for 10 min. The filtrates were evaporated to dryness and the dried powder was stored in −20 °C for the next experiment.
400 rpm for 10 min. The filtrates were evaporated to dryness and the dried powder was stored in −20 °C for the next experiment.
Instrumentation
The analytical apparatus included a transmission electron microscopy (FEI Tecnai G2 F20 S-TWIN), a X-ray diffractometer (XPert PRO), a vibration sample magnetometer (PPMS-9), a fourier transform infrared spectroscopy (Bruker Optics), a ZetaMaster3000 zeta potential laser particle size analyzer (Marven), an Agilent 1100 LC-UV system with chemstation (Agilent), a Shimadzu UHPLC system (Shimadzu), a Q-TOF 5600-plus mass spectrometer equipped with Turbo V sources and a TurboIonspray interface (AB sciex), a PB-10 Sartorious pH meter (Sartorious), a Synergy 2 multimode reader (Biotek).Preparation of tyrosinase conjugated magnetic beads
Immobilization of tyrosinase onto the carboxylic acid-terminated magnetic beads was carried out by forming an amide bond between the carboxyl group of the magnetic beads and primary amino groups of tyrosinase. Briefly, an aliquot of 125 μL magnetic beads was washed with 100 μL MES buffer (25 mM) for three times in a 96-well microtiter plate. An aliquot of 50 μL EDC solution (50 mg mL−1, freshly prepared) and 50 μL NHS solution (50 mg mL−1, freshly prepared) were added immediately to the magnetic beads. The plate was shaken in a specialized stirring mixer for 30 min at room temperature. Meanwhile, about 1 mg of tyrosinase was dissolved in 1 mL MES buffer (25 mM). Then, 100 μL of tyrosinase solution was added to the activated magnetic beads and shaken gently in the specialized stirring mixer at 4 °C. After an overnight incubation, the supernatant of the solution was separated using permanent magnet and abandoned. Subsequently, 100 μL of 0.5% (w/v) aqueous bovine serum albumin solution was added to the well to quench the reaction. The 96-well microtiter plate was shaken in the specialized stirring mixer for 15 min, after which the supernatant was discarded. Finally, the tyrosinase conjugated magnetic beads were stored at 4 °C for the next experiments.Morphology characterization and protein measurement
The morphology of tyrosinase conjugated magnetic beads was characterized using transmission electron microscopy (TEM). Fourier transform infrared spectroscopy (FTIR) was acquired on a Bruker infrared spectrometer. Magnetization curve was measured in a vibration sample magnetometer. The crystalline structure of magnetic beads was identified using powder X-ray diffractometer. Hydrodynamic sizes and zeta potential were detected using zeta potential laser particle size Analyzer.Experiments with varying amounts of magnetic beads (25, 50, 75, 100, 125 and 150 μL) and a constant amount of tyrosinase (100 μL, 1 mg mL−1) were performed to study the amount of protein efficiently immobilized on the magnetic beads. Samples of the supernatants were withdrawn and analyzed for remaining protein by Bradford method and the calibration curve was prepared using gradient concentrations of BSA solutions. The protein immobilized on the magnetic beads was determined.
Box–Behnken design for magnetic solid-phase extraction
One well-known compound, i.e. paeoniflorin, was employed to select the best experimental conditions.6 Three well recognized tyrosinase binders including kojic acid, arbutin and vanillic acid were used to validate the method. All experiments were performed in 1.5 mL centrifuge tubes. The reaction mixtures of the model compound (20 μL, 0.1 mg mL−1) and tyrosinase-conjugated magnetic beads (20 μL) were prepared in phosphate buffer solution to reach a final volume of 200 μL, and incubated for appropriate time at proper temperature. The supernatant was stored, and the tyrosinase-conjugated magnetic beads were washed multiple times with 200 μL of the buffer. The magnetic beads were subsequently incubated in 50 μL denature solvent for 10 min to dislodge specific bound compounds. The final eluate was collected and retained for analysis via HPLC-Q-TOF-MS.Three parameters were investigated in the present study to optimize the experimental conditions. At first, varied wash times (1, 2, 3, 4 and 5 times) were investigated for optimization of the washing procedure. Second, different ratios of acetonitrile–water (10, 30, 50, 70 and 90%, v/v) and methanol–water (10, 30, 50, 70 and 90%, v/v; elution step) were investigated for optimization of the denature procedure. Third, different incubation times (10, 20, 30, 45 and 60 min) were also investigated.
The software Design Expert (Trial Version 7.0.3, Stat-Ease Inc., Minneapolis, MN, USA) was employed for experimental design, data analysis and model building. Box–Behnken designs with three variables was used to determine the response pattern and then to establish a model. Three variables with three levels of each variable used for the optimization of magnetic-solid phase extraction were buffer pH (X1), ion strength (X2) and incubation temperature (X3). In the optimization of extraction, the dependent variables (Y) were the peak area of paeoniflorin. The symbols and levels are shown in Table 1.
| Run | Independent variable | Peak area of paeoniflorin | ||
|---|---|---|---|---|
| X1 (pH) | X2 (ion strength, mM) | X3 (temperature, °C) | ||
| 1 | 7 (0) | 255 (0) | 35 (0) | 59.86 |
| 2 | 6 (−1) | 255 (0) | 25 (−1) | 39.47 |
| 3 | 7 (0) | 500 (1) | 25 (−1) | 48.33 |
| 4 | 7 (0) | 255 (0) | 35 (0) | 59.43 |
| 5 | 8 (1) | 500 (1) | 35 (0) | 38.20 |
| 6 | 8 (1) | 10 (−1) | 35 (0) | 43.96 |
| 7 | 7 (0) | 255 (0) | 35 (0) | 59.91 |
| 8 | 6 (−1) | 500 (1) | 35 (0) | 39.85 |
| 9 | 6 (−1) | 10 (−1) | 35 (0) | 45.17 |
| 10 | 8 (1) | 255 (0) | 25 (−1) | 38.32 |
| 11 | 7 (0) | 500 (1) | 45 (1) | 39.69 |
| 12 | 8 (1) | 255 (0) | 45 (1) | 36.97 |
| 13 | 7 (0) | 10 (−1) | 25 (−1) | 46.86 |
| 14 | 7 (0) | 255 (0) | 35 (0) | 59.44 |
| 15 | 6 (−1) | 255 (0) | 45 (1) | 37.99 |
| 16 | 7 (0) | 10 (−1) | 45 (1) | 50.17 |
| 17 | 7 (0) | 255 (0) | 35 (0) | 59.71 |
A polynomial function to contain second-order model was postulated to describe the extraction procedure:

Method validation
The chromatographic separation was carried out on a reversed-phase XBridge-C18 column (250 mm × 4.6 mm, 5 μm, Waters) with the column temperature set at 30 °C. The mobile phase consisted of water containing 0.1% (v/v) formic acid (A) and acetonitrile (B). A gradient program was used according to the following profile: 0 min, 5% B; 45 min, 100% B. The flow rate was 1 mL min−1 and the injection volume was 10 μL. The UV spectra were recorded at 254 nm.The specificity of the method was determined by analyzing tyrosinase non-binder for interference at the retention times of the tyrosinase binder. Specificity was assessed by comparing the peak of paeoniflorin to that in a solution spiked with analyte at 0.1 mg mL−1 for paeoniflorin and lithospermic acid. The magnetic solid-phase extraction procedure was performed as described above. The calibration curves were constructed by plotting the peak area of paeoniflorin to its gradient concentrations (0.005–0.5 mg mL−1) on the basis of linear regression model. Lower limit of quantification (LLOQ) was defined as the lowest analytical concentration on the calibration curve, which generated S/N ratios of about 10. The accuracy and precision of the method were evaluated by repeated analyses of QC samples (0.125 mg mL−1 for paeoniflorin) on three consecutive days. The measured precision was expressed as relative standard deviation (R.S.D.), and the accuracy was expressed as relative error (R.E.). Matrix effects were investigated on crude extract of San-Bai decoction by calculating the ratio of the peak area of paeoniflorin in the presence of crude extract of San-Bai decoction to the peak area in absence of San-Bai decoction at three different QC concentrations (low, medium, and high). The reusability of tyrosinase conjugated magnetic beads was evaluated by conducting the solid-phase extraction after incubating with paeoniflorin at the same conditions for ten consecutive times.
Applications to San-Bai decoction
The chemical constituents of San-Bai decoction was characterized using high performance liquid chromatography coupled with Q-TOF 5600-plus mass spectrometer. The chromatographic conditions were as follows: reversed-phase XBridge-C18 column (250 mm × 4.6 mm, 5 μm), sample injection volume, 10 μL; the temperature of column oven, 30 °C; flow rate, 1 mL min−1; mobile phases, water with 0.1% formic acid (solvent A) and acetonitrile (solvent B). A gradient programmer was employed according to the following profile: 0–10 min, 10–15% B; 10–25 min linear increase to 30% B; 25–60 min linear increase to 100% B; 60–65 min hold on 100% B. Meanwhile, the concentrations of seven major compounds in San-Bai decoction including albiflorin, paeoniflorin, liquiritin apioside, liquiritin, 6′-;O-galloyl paeoniflorin, ononin and glycyrrhizic acid were determined by HPLC-UV method.The acquisition parameters for quadrupole-time-of-flight mass spectrometry were: collision energy, −35 eV; ion spray voltage, −4.5 kV; nebulizer gas (gas 1), 55 psi; declustering potential, −60 V; heater gas (gas 2), 55 psi; turbo spray temperature, 550 °C; and curtain gas, 35 psi. A full MS-IDA-MS/MS scan was acquired on samples, in which a full mass scan was also recorded and the eight most abundant ions were selected for the MS2 spectra acquisition. The Q-TOF/MS scan range was set as m/z 100–1500.
The extraction procedure was carried out according to the method described above. The reaction mixtures of the extract of San-Bai decoction (20 μL) and tyrosinase-conjugated magnetic beads (20 μL) were prepared in phosphate buffer solution (193.54 mM) to reach a final volume of 200 μL, and incubated for 30 min at 34.83 °C using water bath. The supernatant was stored, and the tyrosinase-conjugated magnetic beads were washed four times with 200 μL of the buffer. The magnetic beads were subsequently incubated in 200 μL of 10% (v/v) acetonitrile/water for 10 min to disclose specific bound compounds. The fifth eluate was collected and retained for analysis via HPLC-Q-TOF-MS.
Tyrosinase inhibitory assay
Tyrosinase inhibitory activity was assayed as described previously with slight modifications,12 using L-tyrosine as substrate. The test compound solutions were prepared as follows: 1 mg test compound was dissolved in 1 mL of 25% aqueous DMSO (stock solution). This stock solution was further diluted with 25% DMSO to give concentrations of 10–500 μM. For inhibition experiments, 100 μL of PBS, 20 μL of the compound solution, and 20 μL of mushroom tyrosinase (250 U mL−1) were pipetted into a 96-well plate. After incubation for 5 min at 35 °C, 20 μL of L-tyrosine solution (3 mM) was added. After incubation for 30 min 35 °C, the absorbance was determined with a microplate reader at 492 nm. Baseline correction for the enzyme assay was performed by subtracting ODs for each compound (‘Blank’). The inhibition for each enzyme assay was calculated as follows:
Each experiment (n = 3) was performed in triplicate, and data are shown as mean ± SE. The IC50, i.e. the concentration of the compound resulting in 50% inhibition of the enzyme was calculated from dose–response curves by non-linear regression analysis. Arbutin was used as the positive control.
Results and discussion
Morphological characterization and protein measurement
Transmission electron microscopy image revealed an average diameter of 400–500 nm as shown in Fig. 2A. The close-up of the beads was present in Fig. 2B. The red arrows clearly shows the presence of thin gray film on the surface of the tyrosinase conjugated magnetic beads, indicating tyrosinase was successfully conjugated onto the surface of magnetic beads via amide reaction. FT-IR analysis indicated a new amide band of 1653 cm−1 appeared after the immobilization (see Fig. S1†), which was due to C![[double bond, length as m-dash]](https://www.rsc.org/images/entities/char_e001.gif) O stretching pattern of the secondary amide linkage. This suggested that the conjugation took place in covalent manner through amide linkage. The main peaks of the X-ray diffraction of the magnetic beads, such as 2.9706, 2.5322, 2.1008, 1.7122, 1.6146 and 1.4837, matched well with the standard magnetite Fe3O4 XRD spectrum (see Fig. S2†). Magnetization curves of blank magnetic beads and tyrosinase conjugated magnetic beads were shown in Fig. S3.† Maximum saturation magnetization (54.3 emu g−1) of tyrosinase-coated magnetic beads is a little less than that (79.4 emu g−1) of blank magnetic beads due to the nonmagnetic tyrosinase on the surface.
O stretching pattern of the secondary amide linkage. This suggested that the conjugation took place in covalent manner through amide linkage. The main peaks of the X-ray diffraction of the magnetic beads, such as 2.9706, 2.5322, 2.1008, 1.7122, 1.6146 and 1.4837, matched well with the standard magnetite Fe3O4 XRD spectrum (see Fig. S2†). Magnetization curves of blank magnetic beads and tyrosinase conjugated magnetic beads were shown in Fig. S3.† Maximum saturation magnetization (54.3 emu g−1) of tyrosinase-coated magnetic beads is a little less than that (79.4 emu g−1) of blank magnetic beads due to the nonmagnetic tyrosinase on the surface.
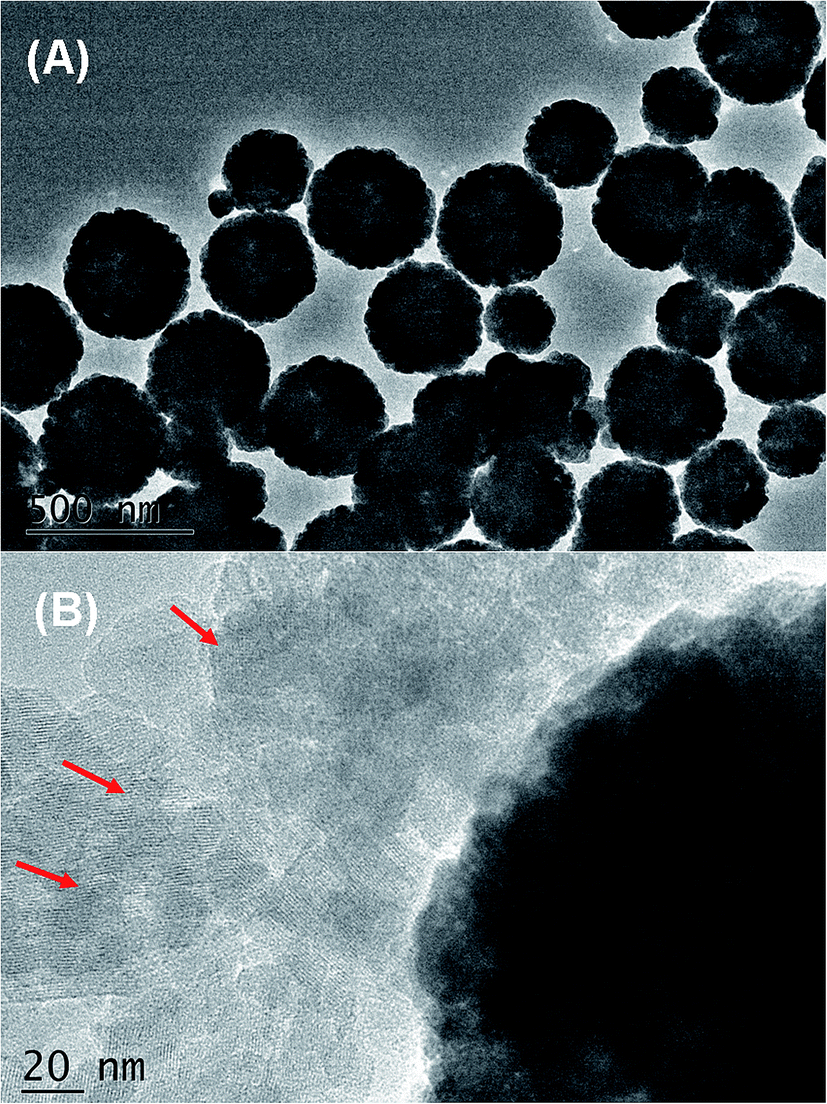 | ||
| Fig. 2 TEM images of tyrosinase conjugated magnetic beads, (A) overall picture, (B) close-up picture. | ||
The amounts of magnetic beads were varied to determine the optimal ratio for tyrosinase binding efficacy with a constant amount of tyrosinase. As shown in Fig. S4,† with increasing the amount of Fe3O4 added at a constant tyrosinase amount of 100 μg, the amount of tyrosinase bound gradually increased and then reached a plateau (∼99%) when the amount of Fe3O4 added was above 125 μL. The results suggested that a ratio of 125 μL Fe3O4 per 100 μg tyrosinase was sufficient for immobilization. Further increases in the amount of Fe3O4 did not increase the amount of bound tyrosinase, suggesting that the largest immobilization efficiency had been achieved. The trend was consistent with a previous report,13 which used human estrogen receptor α as the binding protein. Therefore, a ratio of 125 μL Fe3O4 per 100 μg tyrosinase was chosen for subsequent studies.
Optimization conditions for magnetic solid-phase extraction
Optimization of magnetic solid-phase extraction using Box–Behnken design and response surface methodology
The complete experimental planning for BBD of magnetic solid-phase extraction (MSPE) parameters in coded values consists of 17 experimental combinations in random order with four replicates at the center point, in order to avoid possible artificial systematic effects. The repetitions at the center point are necessary for the estimation of pure error associated with them. The peak area of paeoniflorin was used as the response for the optimization of the MSPE. The experimental runs and the responses obtained in each parameter combination for the MSPE are shown in Table 1. An analysis of variance (ANOVA) was employed to estimate the significance and suitability of the proposed model. The results of ANOVA are presented in Table 2.| Regression coefficients | Value | Standard error | DF | F value | Prob > F |
|---|---|---|---|---|---|
| B0 | 59.67 | 0.21 | 1 | 647.74 | <0.0001 |
|
|||||
| Linear | |||||
| B1 | −0.63 | 0.17 | 1 | 13.94 | 0.0073 |
| B2 | −2.51 | 0.17 | 1 | 222.49 | <0.0001 |
| B3 | −1.02 | 0.17 | 1 | 36.75 | 0.0005 |
|
|||||
| Interaction | |||||
| β12 | −0.11 | 0.24 | 1 | 0.21 | 0.6579 |
| β13 | 0.033 | 0.24 | 1 | 0.020 | 0.8925 |
| β23 | −2.99 | 0.24 | 1 | 157.53 | <0.0001 |
|
|||||
| Quadratic | |||||
| β11 | −12.98 | 0.23 | 1 | 3129.96 | <0.0001 |
| β22 | −4.90 | 0.23 | 1 | 446.23 | <0.0001 |
| β33 | −8.51 | 0.23 | 1 | 1345.49 | <0.0001 |
| Lack of fit | 3 | 8.94 | 0.0302 | ||
| Pure error | 4 | ||||
| R2 | 0.9988 | Adjusted R2 | 0.9973 | ||
F-Test and p-values were used to determine the significance of each factor. The model F-value of 647.74 implies the model is significant. There is only a 0.01% chance that a “Model F-Value” this large could occur due to noise. A term is considered significant when its p-value is lower than 0.05. According to ANOVA results, the linear terms and quadratic terms of pH, ion strength and temperature had a significant effect on the extraction yield. Meanwhile, the interaction between the linear term of ion strength and the linear term of temperature were also found significant.
As was shown in Table 2, the proposed model showed accuracy and good fit at confidence level of 95%, as the value of determination coefficient R2 (>0.99) indicated a good agreement between the observed and the predicted values by the model. The predictive capability of the established model is presented in the plots of observed versus predicted values (see Fig. 3). The adjusted determination coefficient R2 adj, which shows the percentage of response variation explained by the independent variables that truly affect the dependent variable, verified the adequacy of the model, as its value was 0.99.
 | ||
| Fig. 3 Plots of observed versus predicted values of BBD. | ||
Response surface plots were employed for the 3D visualization of the effect of two factors on the response, when the third factor is set to zero. The non-covalent interaction between the paeoniflorin and tyrosinase is mainly driven by electrostatic interactions, so the ionic strength and pH are crucial factors affecting the electrostatic interactions. The interacting effect of pH and ion strength can be understood in the 3-dimensional plots (3D) of these two factors in Fig. 4A. The higher extraction yield of paeoniflorin should be expected at middle of the pH ranged from 6.0 to 8.0. The isoelectric point (pI) of tyrosinase is about 4.7, and when the solution pH value is above the pI of tyrosinase, the tyrosinase conjugated magnetic beads have a net negative surface charge, which favors interaction with paeoniflorin (pKa 11.52 ± 0.70) that have positive charge, however, higher pH reduces the extraction yield and can provoke decomposition of paeoniflorin structure.
 | ||
| Fig. 4 3D surface plots showing the interacting effects of two parameters on peak area of paeoniflorin. (A) ion strength and pH vs. response, (B) temperature and pH vs. response, (C) temperature and ion strength vs. response. | ||
The interaction of temperature with pH was demonstrated in Fig. 4B. The investigated system seems to perform better at the middle value of temperature ranged from 25 °C to 45 °C. The raise of temperature exerts a positive effect on the thermal action and lowers the binding energy between paeoniflorin and the enzyme; however, temperature higher than 40 °C reduces the extraction yield of paeoniflorin and induces protein denaturation. It was reported that the optimum catalytic temperature for tyrosinase was about 40 °C.
The effect of ion strength in relation to temperature was shown in Fig. 4C. Ionic strength is one of the main characteristics of a buffer, which will affect the distribution of charge on the exterior surfaces of the enzyme. With the increase in the buffer concentration from 10 to 500 mM, the extraction yield of paeoniflorin arose first and then dropped. This phenomenon can be explained by the fact that a certain concentration of ions may assist in the binding of paeoniflorin to tyrosinase, but if the concentration of ions exceeds the threshold, the effect of ions will be reversed, which will neutralize the surface charge of tyrosinase and weaken the electrostatic interaction between paeoniflorin and tyrosinase.
To summarize the results of the BBD optimization, the selected values of MSPE are presented in Table 3. The real and the predicted mean yield under repeatability conditions are shown. The experimental values of extraction yield were calculated as 64.87. No significant difference (p < 0.05) was observed between the theoretical and experimental responses (see Fig. 3). The results obtained by RSM optimization verified that the model is valid and adequate for magnetic solid-phase extraction.
| Factor | Value |
|---|---|
| pH value | 6.98 |
| Ion strength (mM) | 193.67 |
| Temperature (°C) | 34.84 |
| Predicted values | 59.99 |
| Experimental values | 64.87 |
Analytical validation
Paeoniflorin is a well known tyrosinase inhibitor, which is one of the major constituents derived from Paeonia lactiflora.6 Lithospermic acid, which is a phenolic compound, displays negative tyrosinase inhibitory effect. Therefore, paeoniflorin and lithospermic acid were selected to investigate the specificity of the magnetic solid-phase extraction approach. As was shown in Fig. S7A,† the peak of paeoniflorin was observed in the presence of lithospermic acid (see black line and red line) after magnetic solid-phase extraction, indicating that the approach had good specificity with no interference of the inactive compound lithospermic acid. To avoid the nonspecific binding, denatured tyrosinase conjugated magnetic beads was used to be incubated with the mixture of paeoniflorin and lithospermic acid. None of the unspecific binding was observed (see red line in Fig. S7B†). Meanwhile, three well recognized tyrosinase binders including kojic acid, arbutin and vanillic acid were used to validate the method. As shown in Fig. S8,† kojic acid, arbutin and vanillic acid were captured and eluted by tyrosinase conjugated magnetic beads.As a four-herb preparation, San-Bai decoction may have a variety of constituents, including phenolics, flavonoids, fatty acid, polysaccharide and tannins. Tannins are found almost in all plants, which can react with proteins, polysaccharides, some alkaloids, few glycosides and form precipitates. The signal from the established approach may be confounded by interference of these nuisance compounds, or synergistic effects of several other compounds. Thus, the aim of this section was to investigate the interference of these nuisance compounds such as tannins or synergistic effects of several other compounds and ensure the result of the approach was reliable.
The calibration curve, linear range, LOD, LOQ, and repeatability of paeoniflorin were carried out using the developed method. Reasonable correlation coefficient values (r2 = 0.9994) indicated good correlations between paeoniflorin concentrations and its peak area within the ranges tested. The LOD and LOQ for paeoniflorin were determined as 1.571 μg mL−1 and 4.713 μg mL−1, respectively. The repeatability present as RSD (n = 6) was 3.57%. The overall intra- and inter-day variations (RSD) of paeoniflorin were 0.68% and 1.85%, respectively. The developed method had good accuracy with the recoveries ranging from 98.59% and 102.15% (see Table 4). The reusability of tyrosinase conjugated magnetic beads was shown in Fig. 5. It was found the immobilized tyrosinase kept its activity by 89% after 10 assays. Collectively, the results demonstrated that the approach was sensitive, precise, and accurate enough for magnetic solid-phase extraction of tyrosinase binders.
| Sample | Initial concentration (μM) | Added concentration (μM) | Found concentration (μM) | Recovery (%) | RSD (%) |
|---|---|---|---|---|---|
| Decoction | 508.18 | 333.02 | 843.78 | 100.77 | 1.16 |
| 561.97 | 1082.81 | 102.15 | 1.98 | ||
| 936.62 | 1431.61 | 98.59 | 1.30 |
 | ||
| Fig. 5 Reusability of the tyrosinase conjugated magnetic beads for ten consecutive cycles. | ||
Applications to San-Bai decoction
The total ion current chromatogram in negative ESI mode of San-Bai decoction was displayed in Fig. 6A. A total of thirty-two compounds were identified, including 11 monoterpene glycosides (peaks 3, 5–7, 10, 11–13, 14, 17, 23), 8 phenolics (peaks 1, 4, 8, 9, 16, 18–20), 9 triterpene saponins (peaks 21, 22, 24–26, 28–31) and 4 unknowns (peaks 2, 15, 27, 32), and their detailed information was shown in Table 5. Compounds corresponding to peaks 1, 3, 5, 6, 7, 8–13, 16–20, 23–25 and 28 were identified as tyrosinase binders from the decoction using the magnetic solid-phase extraction approach (see Fig. 6B). Nonspecific binding was not observed for the San-Bai decoction (see Fig. 6C). The retention time and fragmentation information of compounds 1, 6, 7, 9, 11, 16, 19, 20 and 28 were compared with that of standard compounds. | ||
| Fig. 6 TIC chromatograms of (A) San-Bai decoction, (B) fifth eluent after incubation with tyrosinase conjugated magnetic beads, (C) fifth eluent after incubation with denatured tyrosinase conjugated magnetic beads. Peak numbers are consistent with those in Table 5. | ||
| No. | tR (min) | MS2 | Formula | ESI-MS(−) | Identification | Source | |
|---|---|---|---|---|---|---|---|
| Measured mass [M − H]− or [M + HCOOH − H]− | Error (ppm) | ||||||
| a *Compared to standard compounds. PL: paeonia lactiflora pall; GU: Glycyrrhiza uralensis. | |||||||
| 1* | 3.780 | 125.0246, 124.0171, 79.0220 | C7H6O5 | 169.0163 | 12.1 | Gallic acid | PL |
| 2 | 6.272 | 705.1778, 583.1405, 543.1226, 259.0276 | C32H34O18 | 705.1717 | 6.3 | Unknown | — |
| 3 | 7.041 | 543.1204, 421.0816, 375.0762, 259.0270, 213.0217, 121.0293 | C23H28O14S | 543.1180 | 6.6 | Paeoniflorin sulfonate | PL |
| 4 | 8.220 | 165.0551, 121.0661, 119.0499, 93.0360, 59.0176 | C9H10O3 | 165.0579 | 13.2 | Paeonol | PL |
| 5 | 12.369 | 641.2150, 611.2032, 593.1918, 489.1643, 471.1540, 323.0988, 179.0556, 165.0552, 121.0296 | C29H38O16 | 687.2160 | 9.8 | β-Gentiobiosylpaeoniflorin | PL |
| 6* | 12.877 | 479.1587, 357.1206, 283.0822, 121.0298 | C23H28O11 | 525.1619 | 5.9 | Albiflorin | PL |
| 7* | 14.752 | 479.1600, 449.1557, 327.1012, 283.0775, 121.0302 | C23H28O11 | 525.1613 | 8.6 | Paeoniflorin | PL |
| 8* | 17.837 | 417.1211, 297.0769, 255.0656, 135.0084, 119.0507 | C26H30O13 | 549.1621 | 1.3 | Liquiritin apioside | GU |
| 9* | 18.021 | 255.0655, 148.0161, 135.0081, 119.0501, 91.0202 | C21H22O9 | 417.1197 | 1.4 | Liquiritin | GU |
| 10 | 18.493 | 479.1611, 449.1500, 283.0840, 121.0303 | C23H28O11 | 525.1626 | 10.9 | Albiflorin R1 | PL |
| 11* | 18.746 | 465.1433, 313.0577, 271.0470, 169.0140 | C30H32O15 | 631.1684 | 2.5 | 6′-O-Galloyl paeoniflorin | PL |
| 12 | 18.966 | 613.1618, 491.1226, 399.0947, 313.0567, 271.0457, 169.0134 | C30H32O15 | 631.1687 | 2.9 | 6′-O-Galloylpaeoniflorin isomer | — |
| 13 | 21.086 | 465.1443, 313.0551, 169.0312 | C30H32O15 | 631.1682 | 2.1 | 4′-O-Galloylpaeoniflorin | PL |
| 14 | 23.318 | 463.1648, 341.1252, 121.0299 | C23H28O10 | 509.1674 | 8.3 | Paeobrin | PL |
| 15 | 23.619 | 525.1133, 479.1062, 259.0290, 213.0029, 121.0299 | C26H32O19 | 647.1455 | −1.5 | Unknown | — |
| 16 | 23.896 | 417.1227, 297.0770, 255.0660, 135.0088, 119.0507 | C26H30O13 | 549.1622 | 1.5 | Isoliquiritin apioside | GU |
| 17 | 24.619 | 461.1490, 339.1105, 177.0555, 121.0299 | C23H26O10 | 507.1519 | 8.0 | Lactiflorin | PL |
| 18 | 24.942 | 255.0657, 254.0581, 148.0159, 135.0084 | C21H22O9 | 417.1201 | 2.4 | Isoliquiritoside | GU |
| 19* | 25.381 | 267.0662, 266.2066, 252.0427, 251.0358 | C22H22O9 | 475.126 | 3.0 | Ononin | GU |
| 20* | 27.140 | 255.0656, 135.0085, 119.0505, 91.0208 | C15H12O4 | 255.0675 | 4.8 | Isoliquiritigenin | GU |
| 21 | 30.070 | 351.0570, 193.0345 | C42H62O18 | 853.3910 | 5.5 | 22-Hydroxy-licorice-saponin G2 | GU |
| 22 | 30.254 | 821.0469, 803.3983, 351.0580 | C48H72O21 | 983.4543 | 5.0 | Licoricesaponin A3 | GU |
| 23 | 30.905 | 583.1866, 553.1754, 535.1652, 431.1367, 165.0553, 121.0296 | C30H32O12 | 629.1890 | 7.7 | Paeonin A | PL |
| 24 | 31.321 | 351.0570, 193.0347, 175.0245 | C44H64O18 | 879.4057 | 4.2 | 22-Acetoxyglycyrrhizin | GU |
| 25 | 31.806 | 661.3678, 485.3309, 351.0571, 193.0347, 175.0243 | C42H62O17 | 837.3944 | 3.6 | Yunganoside K2 | GU |
| 26 | 33.365 | 351.0578, 193.0349, 175.0244 | C42H62O17 | 837.3953 | 4.6 | Licoricesaponin G2 | GU |
| 27 | 34.104 | 497.1201, 339.0946 | C66H65O8 | 985.4693 | 0.8 | Unknown | — |
| 28* | 34.636 | 759.4067, 645.3711, 351.0571, 289.0573, 193.0345, 175.0240 | C42H62O16 | 821.3991 | 3.2 | Glycyrrhizic acid | GU |
| 29 | 35.741 | 631.3949, 351.0575, 193.0349 | C42H64O15 | 807.4205 | 4.0 | Licoricesaponin B2 | GU |
| 30 | 36.063 | 759.4067, 645.3712, 351.0561, 333.0470, 289.0555 | C42H62O16 | 821.3992 | 3.3 | Licoricesaponin K2 | GU |
| 31 | 36.432 | 645.3690, 351.0576, 289.0582, 193.0346, 113.0253 | C42H62O16 | 821.3995 | 3.6 | Licoricesaponin K2 isomer | GU |
| 32 | 36.800 | 777.4167, 715.4138, 627.3613, 583.3772, 351.0593 | C45H62O11 | 823.4138 | −6.7 | Unknown | — |
Monoterpene glycosides are the major bioactive constituents derived from Paeonia lactiflora. The chemical structure of their aglycones is generally a cage-like pinane skeleton. The monoterpene glycosides are usually esterified with an aromatic acid such as benzoic acid, p-hydroxybenzoic acid, or gallic acid. A total of eleven monoterpene glycosides (peaks 3, 5–7, 10, 11–13, 14, 17, 23) were identified based on their mass spectra. These monoterpene glycosides had similar fragmentation patterns, for example, losses of a benzoic acid (122 Da), a glucosyl group (162 Da), and their combined loss (284 Da). Peaks 6, 7 and 10 displayed the same [M + HCOOH − H]− ion at m/z 525. The MS2 spectra were used to distinguish between these three isomers. Compared with the MS2 spectra and retention time of paeoniflorin, peak 7 was validated as paeoniflorin. The most abundant ion at m/z 121.0302 was indicative of benzoic acid. The product ions at m/z 449.1557 and m/z 327.1012 resulted from loss of a formic aldehyde and loss of both benzoic acid and formic aldehyde, respectively. The fragment ion at m/z 283.0775 was produced by the loss of the pinane skeleton and the formation of benzoyl glucoside. The retention time of peak 6 was a little earlier than that of peak 7. The product ion at m/z 357.1206 was exclusively observed for peak 6. Compared with the literature,14 peak 6 was assigned as albiflorin. The fragment ion at m/z 357.1206 was attributed to the direct loss of benzoic acid (122 Da). The retention time of peak 10 was much later than that of peak 7. The MS2 fragments of peak 10 were almost as same as that of peak 7. Thus, peak 10 was an isomer of paeoniflorin. By searching the literature,15 peak 10 was tentatively deduced as albiflorin R1. Peak 3 showed the [M − H]− ion at m/z 543. The sulfonic aglycone ion at m/z 259 was a characteristic signal of the sulfonic substituent. Thus, peak 3 was assigned as a sulfonate derivative. Compared with the literature,16 peak 3 was tentatively deduced as paeoniflorin sulfonate. The fragment ion at m/z 421.0816 was produced by the direct loss of benzoic acid (122 Da). Peaks 11, 12 and 13 were deduced as galloylpaeoniflorin or its isomers. Their product ions at m/z 169 suggested the presence of galloyl radical. The fragment ions at m/z 313 corresponded to a [galloyl glucose residue − H]−. Peak 11 was unequivocally identified as 6′-O-galloylpaeoniflorin by comparison with reference standard. Peak 5 displayed [M + HCOOH − H]− ion at m/z 687. The retention time of peak 5 was a little earlier than that of peak 7, indicating the polarity of peak 5 was larger than that of peak 7. The molecular weight of peak 5 was 162 Da larger than that of peak 7, which indicated an increase of glucosyl group. By searching the literature,17 peak 5 was tentatively deduced as β-gentiobiosylpaeoniflorin. The fragment ions at m/z 611.2032 and m/z 593.1918 were yielded by loss of a formic aldehyde (30 Da) and loss of both formic aldehyde and H2O (48 Da), respectively. Peak 14 showed [M + HCOOH − H]− ion at m/z 509. The molecular weight of peak 14 was 16 Da less than that of peak 7, which indicated a loss of oxygen. The most abundant ion at m/z 121.0302 was suggestive of benzoic acid. The neutral loss of 122 Da yielded the fragment ion at m/z 341.1252. Based on the above information, peak 14 was an isomer of peak 7. Compared with the literature,17 peak 14 was plausibly deduced as paeobrin. Peak 17 showed [M + HCOOH − H]− ion at m/z 507. The fragment ions at m/z 339.1105 and m/z 177.0555 were produced by loss of benzoic acid (122 Da) and both of benzoic acid and glucosyl group (284 Da). Thus, peak 17 was tentatively identified as lactiflorin by comparison with the literature.18 Peak 23 displayed [M + HCOOH − H]− ion at m/z 629. The retention time of peak 23 was a much later than that of peak 7. The molecular weight of peak 23 was 105 Da larger than that of peak 7, which indicated an increase of benzoyl group. By searching the literature,19 peak 23 was tentatively assigned as paeonin A. The fragment ions at m/z 553.1754 and m/z 535.1652 were produced by loss of benzoic acid (30 Da) and both of benzoic acid and H2O group (48 Da). Further loss of benzoyl group yielded the fragment ion at m/z 431.1367.
Phenolic compounds are the second major constituents in San-Bai decoction. Eight phenolic compounds were identified in this study (peaks 1, 4, 8, 9, 16, 18–20). Glycosylated flavanones and their related glycosylated chalcones were found to be the major phenolic compounds derived from Glycyrrhiza uralensis Fisch. Among them, different peaks presented MS2 fragmentation patterns that gave rise to a characteristic fragment with m/z 255, corresponding to the aglycone liquiritigenin. Peaks 8, 9, 16, 18 and 20 shared the fragment ion at m/z 255, so these five compounds were assigned as liquiritigenin derivatives. Their MS2 pattern was characterized by the loss of the apioside unit (132 Da), the cleavage of the hexose (120 Da), and the loss of the two glycosidic units. Peaks 8, 9 and 20 were unequivocally identified as liquiritin apioside, liquiritin and isoliquiritigenin by comparison with reference standards. Peak 16 and peak 8 shared the same [M − H]− ion at m/z 507 and fragment ions at m/z 417, m/z 297 and m/z 255. Thus, peak 16 and peak 8 were isomers. By searching the literature,20 peak 16 was plausibly deduced as isoliquiritin apioside. Similarly, peak 18 and peak 9 possessed the same [M − H]− ion at m/z 417 and fragment ions at m/z 255, m/z 148 and m/z 135. Peak 18 and peak 9 were isomers. Compared with the literature,20 peak 18 was tentatively identified as isoliquiritoside. Peaks 1 and 4 showed [M − H]− ion at m/z 169 and m/z 165, which were easily deduced as gallic acid and paeonol by comparison with the literatures.21 Peak 19 displayed [M + HCOOH − H]− ion at m/z 475 and fragment ions at m/z 267 and m/z 252. Compared with the standard, peak 19 was unambiguously identified as ononin. Direct loss of a glucosyl group (162 Da) yielded the ion at m/z 267. Further loss of a methyl group led to the ion at m/z 252.
Triterpene saponins are the third major constituents of San-Bai decoction. Nine triterpene saponins (peaks 21, 22, 24–26, 28–31) were identified. The chemical structure of these triterpene saponins is generally an oleanane-type skeleton. The triterpene saponins are usually esterified with two glucuronic acid. Among them, different peaks presented MS2 fragmentation patterns that gave rise to a characteristic fragment with m/z 351, corresponding to a [2glucuronic acid − H]−. Peaks 28, 30 and 31 displayed the same [M − H]− ion at m/z 821 and almost identical fragment ions at m/z 759 and m/z 645, corresponding to the [M − H2O − CO2]− and [M − glucuronic acid]−. In comparison with the standard, peak 28 was unambiguously identified as glycyrrhizic acid. Peaks 30 and 31 were tentatively deduced as licoricesaponin K2 or its isomer by comparison with the literatures.22,23 Peaks 25 and 26 displayed [M − H]− ion at m/z 837 and had the same molecular formula C42H62O17, which matched well with that of licoricesaponin G2 and yunganoside K2. The two compounds displayed very similar product ions in MS2 spectra. As peak 26 was more abundant than peak 25, it was more likely to be licorice saponin G2 according to the literature,22 while peak 25 was tentatively deduced as yunganoside K2. Similarly, peaks 21, 22, 24 and 29 shared the same product ion at m/z 351, which indicated that glucuroglucuronic acid group was conjugated to their skeleton. By comparing with related references, peaks 21, 22, 24 and 29 were tentatively deduced as 22-hydroxylicoricesaponin G2,24 licoricesaponin A3,25 22-acetoxyglycyrrhizin20 and licoricesaponin B2,23 respectively.
The concentrations of seven major compounds in San-Bai decoction including albiflorin, paeoniflorin, liquiritin apioside, liquiritin, 6′-O-galloyl paeoniflorin, ononin and glycyrrhizic acid were determined by HPLC-UV method and the concentrations of these compounds were listed in Table S1.† The concentrations of albiflorin, paeoniflorin, liquiritin apioside, liquiritin, 6′-O-galloylpaeoniflorin, ononin and glycyrrhizic acid were 0.132, 0.244, 0.027, 0.002, 0.013, 0.004 and 0.044 mg mL−1, respectively.
Tyrosinase inhibitory assay
As shown in Fig. 6B, compounds corresponding to peaks 1, 3, 5, 6, 7, 8–13, 16–20, 23–25 and 28 were identified as tyrosinase binders for the decoction. Thus, compounds 1, 3, 5, 6, 7, 8–13, 16–20, 23–25 and 28 should be evaluated for their inhibitory effect against tyrosinase. However, due to the lack of standard compounds, the inhibitory effects compounds 3, 5, 10–13, 16–18 and 23–25 were not well elucidated at present. In the future, their inhibitory effects will undoubtedly be elucidated with the endeavor of phytochemistry research. Except for compounds 1, 6–9, 11, 19–20 and 28, six available standards derived from Paeonia lactiflora Pall including oxypaeoniflora, benzoyloxypaeoniflorin, benzoylpaeoniflorin, paeonolide, mudanpioside C, and apiopaeonoside were also evaluated for their inhibitory effects against tyrosinase. Therefore, fifteen compounds were obtained and evaluated for their inhibitory activities against tyrosinase using tyrosinase inhibitory assay. Arbutin served as the positive control. The IC50 value of arbutin was determined to be 96.68 μM, which was in agreement with report in the ref. 26. The assay results of other compounds were listed in Table 6. Compared with the positive control, galloylpaeoniflorin, benzoylpaeoniflorin, and benzoyloxypaeoniflorin exhibited better tyrosinase inhibitory activity with IC50 values of 35.54 μM, 31.60 μM and 40.44 μM, respectively. Paeoniflorin showed a little weaker inhibitory effect (IC50 101.09 μM) than that of its derivatives. Their structures were shown in Fig. S8.† The only difference between paeoniflorin and its derivatives was the increase of an aromatic acid substitution group. Albiflorin, as an isomer of paeoniflorin, exhibited tyrosinase inhibitory activity with an IC50 value of 100.13 μM. The tyrosinase inhibitory activity of other compounds derived from Paeonia lactiflora Pall were decreased in the following order: oxypaeoniflora (82.55 μM), mudanpioside C (82.72 μM), apiopaeonoside (97.69 μM), paeonolide (101.54 μM). The IC50 values of glycyrrhizic acid, liquiritin apioside, liquiritin and gallic acid were determined to be 59.44 μM, 88.91 μM, 101.09 μM and 177.87 μM, which had been reported before.27 In summary, fifteen tyrosinase inhibitors were identified, and nine of which, including benzoylpaeoniflorin, paeonolide, benzoyloxypaeoniflorin, galloylpaeoniflorin, oxypaeoniflora, albiflorin, ononin, mudanpioside C and apiopaeonoside, were reported for the first time. New tyrosinase inhibitory compounds were rapidly extracted and analyzed from natural medicines using the established approach.| No. | Compound | IC50 (μM) ± SD |
|---|---|---|
| 1 | Gallic acid | 177.87 ± 1.50 |
| 6 | Albiflorin | 100.13 ± 6.87 |
| 7 | Paeoniflorin | 101.62 ± 7.09 |
| 8 | Liquiritin apioside | 88.91 ± 12.05 |
| 9 | Liquiritin | 171.13 ± 19.37 |
| 11 | Galloylpaeoniflorin | 35.54 ± 2.34 |
| 19 | Ononin | 101.09 ± 8.15 |
| 20 | Isoliquiritigenin | 184.88 ± 10.37 |
| 28 | Glycyrrhizic acid | 59.44 ± 5.15 |
| Oxypaeoniflora | 82.55 ± 2.52 | |
| Benzoylpaeoniflorin | 31.60 ± 3.32 | |
| Benzoyloxypaeoniflorin | 40.44 ± 1.81 | |
| Mudanpioside C | 82.72 ± 7.57 | |
| Paeonolide | 101.54 ± 9.79 | |
| Apiopaeonoside | 97.69 ± 5.77 | |
| Control | Arbutin | 96.68 ± 4.36 |
Comparisons
The differences between the method in the literature28 and our study were summarized in Table S1.† First, the authors in the literature applied glutaraldehyde as reaction solvent to immobilize tyrosinase onto amine-terminated magnetic nanoparticles (i.d. 50 nm), whereas we used EDC and NHS as reaction solvent to immobilize tyrosinase onto carboxyl functionalized magnetic beads (i.d. 400–500 nm). The reaction mode and objective are totally different! Second, the mass spectrometer for detecting binders is different. The author in the literature used Finnigan LCQdeca plus ion trap mass spectrometer, while we employed AB ScieX 5600 Q-TOF mass spectrometer, which is more accurate and efficient. Third, protein-material amount ratio of our study (800 μg mg−1) is much higher than that of the literature (152 μg mg−1), which meant more tyrosinase could be immobilized onto the surface of magnetic beads. Fourth, the method for optimization of incubation conditions is different. Univariate analysis was used in the literature, while response surface method was employed in our study, which is useful for finding out the optimal condition. The final conditions were listed in the Table S2.† Finally, both of the magnetic nanoparticles in the literature and in our study can be reused. In the literature, the activity of immobilized tyrosinase retained 56.9% after ten cycles. Our study showed that about 90% activity of immobilized tyrosinase were retained after ten cycles. In the literature, eleven tyrosinase binders were identified from Glycyrrhiza uralensis. Our study identified fifteen tyrosinase inhibitors, the majority of which were derived from Paeonia lactiflora.Conclusions
This work presents the application and optimization of MSPE technique for extraction of tyrosinase binders in San-Bai decoction. The application of the developed technique for the extraction of tyrosinase binders from herbal samples, demonstrated that MSPE can stand as viable and practicable technique for the efficient, rapid, low cost, repeatable and reproductive extraction of tyrosinase binders from herbal extracts. Particularly, fifteen tyrosinase inhibitors were identified, nine of which were reported for the first time.Acknowledgements
This study was supported by the Natural Science Foundation for the Youth of Jiangsu Province (No. BK20140963), the Nutritional Science Foundation of By-Health Co. (No. TY0141103), and the Priority Academic Program Development of Jiangsu Higher Education Institution (PAPD).References
- G. M. Casanola-Martin, H. Le-Thi-Thu, Y. Marrero-Ponce, J. A. Castillo-Garit, F. Torrens, A. Rescigno, C. Abad and M. T. Khan, Curr. Top. Med. Chem., 2014, 14, 1494–1501 CrossRef CAS PubMed.
- A. Mullard, Nat. Rev. Drug Discovery, 2011, 10, 325–326 CrossRef CAS PubMed.
- R. M. Webster and S. E. Mentzer, Nat. Rev. Drug Discovery, 2014, 13, 491–492 CrossRef CAS PubMed.
- E. Mendes, J. Perry Mde and A. P. Francisco, Expert Opin. Drug Discovery, 2014, 9, 533–554 CrossRef CAS PubMed.
- M. T. Khan, Curr. Med. Chem., 2012, 19, 2262–2272 CrossRef CAS PubMed.
- J. Qiu, M. Chen, J. Liu, X. Huang, J. Chen, L. Zhou, J. Ma, P. Sextius, A. M. Pena, Z. Cai and S. Jeulin, Int. J. Cosmet. Sci., 2016, 39, 1–8 Search PubMed.
- Q. Zhao, X. F. Li and X. C. Le, Anal. Chem., 2011, 83, 9234–9236 CrossRef CAS PubMed.
- L. Sun, H. Fu, Y. Li, X. Duan and Z. Li, Anal. Chem., 2016, 88, 3953–3958 CrossRef CAS PubMed.
- D. Cheng, M. Yu, F. Fu, W. Han, G. Li, J. Xie, Y. Song, M. T. Swihart and E. Song, Anal. Chem., 2016, 88, 820–825 CrossRef PubMed.
- E. D. Bodnar and H. Perreault, Anal. Chem., 2013, 85, 10895–10903 CrossRef CAS PubMed.
- Y. Tao, Y. Jiang, W. Li and B. Cai, RSC Adv., 2016, 6, 98476–98486 RSC.
- Z. Yang, Y. Wang, Y. Wang and Y. Zhang, Food Chem., 2012, 131, 617–625 CrossRef CAS.
- N. Jonker, A. Kretschmer, J. Kool, A. Fernandez, D. Kloos, J. G. Krabbe, H. Lingeman and H. Irth, Anal. Chem., 2009, 81, 4263–4270 CrossRef CAS PubMed.
- L. Zhang, Z. Jiang, J. Yang, Y. Li, Y. Wang and X. Chai, J. Food Drug Anal., 2015, 23, 811–820 CrossRef CAS.
- S. Xiao, K. Luo, X. Wen, X. Fan and Y. Cheng, J. Pharm. Biomed. Anal., 2014, 92, 82–89 CrossRef CAS PubMed.
- Z. Yan, C. Chen, X. Xie, B. Fu and X. Yang, Anal. Bioanal. Chem., 2012, 402, 2173–2182 CrossRef CAS PubMed.
- Q. Wang, Z. Liang, Y. Peng, J. L. Hou, S. L. Wei, Z. Z. Zhao and W. Q. Wang, J. Pharm. Biomed. Anal., 2015, 103, 7–16 CrossRef CAS PubMed.
- L. Chen, J. Qi, Y. X. Chang, D. Zhu and B. Yu, J. Pharm. Biomed. Anal., 2009, 50, 127–137 CrossRef CAS PubMed.
- N. Riaz, I. Anis, A. Malik, Z. Ahmed, R. Aziz ur, P. Muhammad, S. A. Nawaz and M. I. Choudhary, Chem. Pharm. Bull., 2003, 51, 252–254 CrossRef CAS PubMed.
- Q. Wang, W. Song, X. Qiao, S. Ji, Y. Kuang, Z. X. Zhang, T. Bo, D. A. Guo and M. Ye, J. Chromatogr. A, 2016, 1454, 15–25 CrossRef CAS PubMed.
- L. Q. Peng, Q. Li, Y. X. Chang, M. An, R. Yang, Z. Tan, J. Hao, J. Cao, J. J. Xu and S. S. Hu, J. Chromatogr. A, 2016, 1456, 68–76 CrossRef CAS PubMed.
- G. Tan, Z. Zhu, H. Zhang, L. Zhao, Y. Liu, X. Dong, Z. Lou, G. Zhang and Y. Chai, Rapid Commun. Mass Spectrom., 2010, 24, 209–218 CrossRef CAS PubMed.
- L. Montero, E. Ibáñez, M. Russo, R. di Sanzo, L. Rastrelli, A. L. Piccinelli, R. Celano, A. Cifuentes and M. Herrero, Anal. Chim. Acta, 2016, 913, 145–159 CrossRef CAS PubMed.
- S. Wang, Y. Zhu, Q. Shao, Y. Wang, X. Fan and Y. Cheng, J. Pharm. Biomed. Anal., 2016, 117, 255–265 CrossRef CAS PubMed.
- X. Qiao, Q. Wang, W. Song, Y. Qian, Y. Xiao, R. An, D.-a. Guo and M. Ye, J. Chromatogr. AA, 2016, 1438, 198–204 CrossRef CAS PubMed.
- L. Chai, J. Zhou, H. Feng, C. Tang, Y. Huang and Z. Qian, ACS Appl. Mater. Interfaces, 2015, 7, 23564–23574 CAS.
- R. Tundis, M. R. Loizzo, M. Bonesi and F. Menichini, Curr. Med. Chem., 2015, 22, 1515–1538 CrossRef CAS PubMed.
- L. Liu, S. Shi, X. Chen and M. Peng, J. Chromatogr. B: Anal. Technol. Biomed. Life Sci., 2013, 932, 19–25 CrossRef CAS PubMed.
Footnote |
| † Electronic supplementary information (ESI) available. See DOI: 10.1039/c6ra22045b |
| This journal is © The Royal Society of Chemistry 2016 |