
Photocatalytic degradation of a low concentration pharmaceutical pollutant by nanoporous TiO2 film with exposed {001} facets
Tongzhou Xuab,
Hong Zheng*a,
Pengyi Zhang*b and
Wei Linab
aBeijing Key Laboratory of Materials Utilization of Nonmetallic Minerals and Solid Wastes, National Laboratory of Mineral Materials, School of Materials Science and Technology, China University of Geosciences, Beijing 100083, China. E-mail: zhengh@cugb.edu.cn; Fax: +86 10 82322974; Tel: +86 10 82322974
bState Key Joint Laboratory of Environment Simulation and Pollution Control, School of Environment, Tsinghua University, Beijing 100084, China. E-mail: zpy@tsinghua.edu.cn; Fax: +86 10 62796840 ext. 602; Tel: +86 10 62796840 ext. 601
First published on 3rd October 2016
Abstract
Photocatalytic degradation of low concentration ethenzamide, a pharmaceutical pollutant, by nanoporous TiO2 film with exposed {001} facets under UV and 185 nm vacuum UV (VUV) irradiation was studied. Nanoporous TiO2 film was found to have considerably higher UV photocatalytic activity than non-porous TiO2 film and P25 coated on the Ti sheet, close to Pt deposited TiO2 film with exposed {001} facets (Pt-TiO2) when initial ethenzamide concentration was higher than 0.45 ppm. It exhibited higher activity than Pt-TiO2 film when initial ethenzamide concentration decreased to 0.1 ppm. The performance of nanoporous TiO2 film was also confirmed in the flow-through system, which exhibited superior UV photocatalytic activity at different residence time and long-term stability within 47 days' continuous experiments. The nanoporous TiO2 film also showed significant activity under VUV irradiation. VUV photocatalytic degradation of ethenzamide was greatly improved in comparison with the results under UV irradiation. The nanoporous TiO2 film still showed significant photocatalytic activity when the concentration of ethenzamide was as low as 15 ppb under VUV irradiation even when the residence time was only 1.8 min. The mass transfer limits the degradation of low concentration ethenzamide under VUV irradiation, improved flow state, i.e. high Reynolds number can help to increase the photocatalytic efficiency of ethenzamide by nanoporous TiO2 film under VUV irradiation. Nanoporous TiO2 film with exposed {001} facets shows considerable potential for application in removing low concentration pollutants.
1. Introduction
Pollution from pharmaceuticals and personal care products (PPCPs), emerging contaminants in surface and ground waters, is becoming recognized as an environmental concern in many countries.1 In a 2002 nationwide study of “emerging pollutants” in waters, the U. S. Geological Survey (USGS) tested PPCPs in several U. S. locations in 139 rivers in 30 states and detected a wide range of biologically active compounds in nearly 80% of these, even in remote areas.2 Trace amounts of pharmaceuticals have also been found in the tap water of some communities at concentrations ranging between 20 parts per billion (ppb) and less than one part per trillion (ppt).3,4 The most important of these relate to the potential for developmental impairment by trace quantities of pharmaceuticals in drinking water, that is, the subject area of endocrine disruption.1 The sources of PPCPs are also extensive, including the pharmaceutical factory, urban domestic sewage, livestock and poultry breeding wastewater, hospitals, and biological treatment residues in sewage treatment plants.5 They exist as trace amounts in the environment, which would cause serious and lasting pollution and may cause long-term accumulation, even though they do not cause serious harm to humans in the short term.6,7 Therefore, removing low-concentration PPCPs from the aqueous environment is emerging as a critical technology. Ozonation and ozone-based advanced oxidation processes, such as ozone/hydrogen peroxide, ozone/ultraviolet irradiation, and ozone/hydrogen peroxide/ultraviolet irradiation, already underpin significant technologies for the treatment of wastewaters. There appears to be considerable potential for their expanded use in degrading PPCPs. The purpose of ozonation of PPCPs in wastewater and water treatment is to transform the compound into a biologically active form. However, according to recent studies, this objective may not always be achieved.8 Moreover, the oxidation products of some pharmaceuticals from ozone treatment may be harmful and need to be further removed.8 Sole UV treatment, which is very popular for disinfecting potable water, is not applicable to PPCPs removal in wastewater treatment systems since some PPCPs with amide bonds were highly resistant to photodegradation by UV irradiation.9,10The photocatalytic decomposition of pharmaceuticals has been a promising method. TiO2 is widely investigated due to its high photocatalytic activity, long-term stability, non-toxicity and relatively low price.11,12 However, its shortcoming has been simultaneously criticized, such as electron–hole recombination and low quantum yield, which would lead to a low effectiveness and high cost.13
For anatase TiO2, both theoretical and experimental studies have found that the minority {001} facets in the equilibrium state are more reactive than {101} facets.14–16 Since photo-generated electrons and holes could be mainly accumulated on the {101} and {001} facets and then take part in photocatalytic reduction and oxidation reactions, respectively, the simultaneous exposure of the two facets could facilitate charge separation.17 TiO2 crystals with exposed {001} facets from Ti metal have been successfully prepared.18–22 Moreover, the TiO2 film with highly oriented anatase {001} facets and a free standing all-in-one structure could be easily separated from the water after photocatalytic reaction and is more convenient for many practical applications than TiO2 prepared in powder form. However, for low concentration PPCPs the photocatalytic activity of TiO2 films with exposed {001} facets still need to be further improved.
Nanoporous TiO2 materials with large surface areas have proved to be excellent candidates for their many promising applications in environmental and energy areas.23–25 In our previous study,26 TiO2 films with exposed {001} facets and uniform nanopores in the crystal facets were successfully fabricated on a Ti substrate using the hydrothermal process followed by calcination at 600 °C. Nanopore formation mechanism of the TiO2 film was clarified. Preliminary photocatalytic results indicate that the nanoporous TiO2 film with exposed {001} facets exhibited superior UV photocatalytic activities for the degradation of typical organic contaminants than non-porous TiO2 film.26 Herein, for the application of the nanoporous TiO2 film in flow system, which facilitates its practical application, we investigate photocatalytic degradation of low concentration ethenzamide, a widely used acesodyne27–29 with amide and ether groups positioned ortho to each other on a benzene ring, by nanoporous TiO2 film with exposed {001} facets by a series of experiments in the static and dynamic reaction systems under UV and 185 nm vacuum UV (VUV)30–32 irradiation. In addition, dimensionless Reynolds number was used to investigate the effect of hydrodynamic conditions33 in the system and mass transfer on photocatalytic degradation of low concentration ethenzamide under VUV irradiation.
2. Experimental
2.1. Chemicals and materials
All chemicals were used as received without further purification. Ethenzamide (Sigma-Aldrich, >98%, 2-ethoxybenzamide, C9H11NO2) was used. Metallic titanium (Ti) sheet (99.5% in purity) was purchased from Baoji Kehui Titanium Company, Shaanxi, China. Deionized water was used in all experiments.2.2. Preparation of TiO2 catalysts
Nanoporous TiO2 film with exposed {001} facets was prepared according to previous report:26 the Ti sheet with a size of 100 mm × 240 mm × 0.12 mm was first etched in boiled 10% oxalic acid solution for 1.5 h. The pretreated Ti sheet was immediately dipped in 400 mL of 0.03 M HF aqueous solution with the volume ratio of water/isopropanol of 2.2 in a Teflon-lined autoclave with a total volume of 500 mL. After the hydrothermal treatment at 180 °C for 3 h, the Ti sheet was rinsed gently with deionized water and dried in air at room temperature, and finally calcined at 600 °C for 2 h. For comparison, a non-porous TiO2 film, also with exposed {001} facets, was prepared in a similar method as reported by Sayed et al.34 TiO2 (Degussa P25) was coated on Ti sheet by dipping the pretreated Ti-sheet in P25 aqueous suspension (10 g L−1) 15 times and then calcining at 400 °C for 90 min. A Pt-TiO2 film was prepared using a low temperature electrostatic self-assembly method as reported by Lin et al.352.3. Characterization of TiO2 film
The morphology of the as-prepared nanoporous TiO2 film with exposed {001} facets was observed with a field-emission scanning electron microscope (FESEM, S-5500, Hitachi) at an accelerating voltage of 5.0 kV. The high resolution transmission electron microscopy (HRTEM) analysis was conducted using a JEM-2011F electron microscope (JEOL, Japan). To prepare the TEM specimen, the as-prepared nanoporous TiO2 film on the Ti sheet was first ultrasonically peeled in absolute ethanol for 40 min and then the suspension was dropped on a carbon film supported on a copper grid and dried in air before analysis. The adsorption of krypton at 77.4 K was determined using a Micromeritics TriStar II 3020 adsorption apparatus. The Brunauer–Emmett–Teller (BET) specific surface area was determined by a multi-point method using adsorption data in the relative pressure (P/P0) range of 0.05–0.3. In addition to the direct measurement of TiO2 film on the Ti sheet, powder species scratched from the Ti sheet were also measured. The X-ray diffraction (XRD) measurements were carried out on a Rigaku D/max-RB with Cu Kα radiation (λ = 0.15418 nm), operated at 40 kV and 100 mA.2.4. Photocatalytic degradation test
A series of static and dynamic experiments were performed to evaluate photocatalytic degradation of low concentration ethenzamide by the nanoporous TiO2 film with exposed {001} facets under UV and VUV irradiation. In the static reaction system, the photocatalytic degradation of ethenzamide was measured by placing 150 mL of ethenzamide aqueous solution in a 180 mL cylindrical vessel,26 into which as-prepared TiO2 film with the size of 100 mm × 120 mm was inserted and attached to the inner wall. A 10 W low-pressure mercury lamp (UV: emission at 254 nm; VUV: main emission at 254 nm and a minor emission at 185 nm) served as the light source. Cross-sectional view of the reactor is shown in Fig. 1A. Oxygen gas was bubbled from the bottom of the reactor at the flow rate of 30 mL min−1. After equilibrated in dark for 30 min, the lamp was turned on to start the photocatalytic reaction. Aliquots were withdrawn every several minutes and the concentration of ethenzamide was analyzed. Fig. 1B shows the diagram of the dynamic reaction system. The structure and dimension of glass reactor part were the same with static reactor. The ethenzamide aqueous solution flowed though the reactor by the pump. | ||
| Fig. 1 (A) Cross-sectional view of the reactor; (B) a diagram of the dynamic reaction system. | ||
The concentration of ethenzamide was analyzed by a high performance liquid chromatography (LC-10AD, Shimadzu, Japan) with a UV detector (SPD-10AV) at 230 nm and a Kromasil C18 column (250 mm × 4.6 mm) for separation. The mobile phase was a mixture of methanol and water (2![[thin space (1/6-em)]](https://www.rsc.org/images/entities/char_2009.gif) :1 V/V) at a flow rate of 1.5 mL min−1.
:1 V/V) at a flow rate of 1.5 mL min−1.
When the initial concentration of ethenzamide was lower than 0.1 ppm, the concentration of ethenzamide was analyzed by an ultra-performance liquid chromatography-tandem mass spectrum (UPLC-MS/MS). The measurements were performed in positive ionization with the optimized mass parameters as follows: capillary voltage, 3.5 kV; source temperature, 120 °C; desolvation temperature, 350 °C; and desolvation gas flow rate, 650 L h−1. The parent ion, daughter ion, cone voltage (V), and collision energy (eV) for ethenzamide detection were 166.13 > 149.07, 22 V, and 15 eV. Liquid chromatography consists of a Waters Chromatography Acquity UPLC separation module, equipped with an Acquity UPLC BEH C18 column (1.7 μm × 100 × 2.1 mm ID) at 40 °C. The LC mobile phase consisted of a mixture of 0.1% formic acid in water (solution A) and methanol (solution B). The mobile phase initial conditions were solvent A (95%) and solvent B (5%) with a flow rate of 0.35 mL min−1, which were maintained for 2 min (0–2 min). At 2 min, solvent B was increased to 30% by 2.5 min (2–2.5 min). Solvent B was further increased to 55% (2.5–3 min) and held for 0.5 min (3–3.5 min). Then, solvent B was decreased to 5% in 0.5 min (3.5–4 min). At 4 min, the initial conditions were set and the column was equilibrated for 0.5 min (4–4.5 min). The total run time was 4.5 min, the injection volume was 10 μL.
3. Results and discussion
3.1. Characterization of as-prepared nanoporous TiO2 film
FE-SEM images of the as-prepared TiO2 film are shown in Fig. 2A. We can see that the exposed surface of the film consists of truncated tetrahedrons with well patterned major flat and square top surfaces and minor four isosceles trapezoidal lateral surfaces, corresponding to {001} and {101} facets, respectively.16 The average size of the {001} of ca. 830 nm and many uniform nanopores in both the {001} facets and {101} facets can be clearly observed from the enlarged SEM image (as shown in the inset of Fig. 2A). Over 700 nanopores on every {001} facet can be counted using Image-Pro Plus software after the SEM images were modified into black and white images by changing the contrast and brightness with PhotoImpact. From the HR-TEM image of TiO2 samples scratched from the Ti substrate, the presence of {001} facets in the nanoporous TiO2 can be further confirmed by the lattice spacing of 0.237 nm (as shown in Fig. 2B) corresponding to the (004) planes and the lattice spacing of 0.35 nm (as shown in Fig. 2C) corresponding to the (101) planes. The BET specific surface areas of 6.13 m2 g−1 determined by krypton adsorption of the nanoporous TiO2 powder scratched from the Ti sheet is larger than that of the non-porous TiO2 (5.12 m2 g−1). The ratio of the surface area to the apparent area of the nanoporous TiO2 film (72.1 m2 m−2 Ti sheet) is also considerably higher than that of the non-porous TiO2 film (59.4 m2 m−2 Ti sheet). On the basis of the BET surface area values, the ratios of microcosmic area to apparent area, FE-SEM images and HR-TEM images of the samples, the formation of porous structure on porous TiO2 film can be confirmed. From XRD patterns of the as-prepared nanoporous TiO2 film (Fig. 2D) it can be clearly seen that anatase is the main crystal phase, and the rutile phase coexisted in the nanoporous TiO2 film. The rutile content (31%) is almost identical to that (30%) in non-porous TiO2 film. The phase-junction can be advantageous to the separation of photogenerated electron–hole pairs, thus improving the photocatalytic activity of the samples.36 The percentage of {001} facets was calculated from the intensity of the diffraction peak of (004) facet and (101) facet of anatase TiO2, and was found to be 58%, which is close to 57% for the non-porous TiO2 film reported by Sayed et al.34 | ||
| Fig. 2 (A) FE-SEM images of nanoporous TiO2 film with exposed {001} facets (inset: the enlarged nanoporous TiO2); (B and C) HR-TEM images of the nanoporous TiO2 sample scratched off from the Ti-substrate; (D) XRD patterns of nanoporous TiO2 film. | ||
3.2. Degradation of ethenzamide in the static system
UV photocatalytic degradation of ethenzamide with different initial concentrations by nanoporous TiO2 film with exposed {001} facets in the static system is shown in Fig. 3. The nanoporous TiO2 film exhibited considerably higher activity than non-porous TiO2 film and P25 coated on the Ti sheet and is very close to that of Pt-TiO2 film to degrade ethenzamide when initial ethenzamide concentration is 2 ppm (Fig. 3A). | ||
| Fig. 3 (A) UV photocatalytic degradation of ethenzamide by nanoporous TiO2 film in the static reaction system (initial ethenzamide concentration is 2 ppm); (B) pseudo-first-order kinetics constants at different initial ethenzamide concentrations. | ||
Langmuir–Hinshelwood (L–H) model is widely used to formulate the photocatalytic rate equation, that is:
 | (1) |
 of the pseudo-first-order reaction. According to this equation, the pseudo-first-order kinetics constants at different initial ethenzamide concentrations were calculated from the experimental data and shown in Fig. 3B. We can see that the pseudo-first-order kinetic constant degraded by nanoporous TiO2 film increases with the decrease of initial ethenzamide concentration and is slightly smaller than that by Pt-TiO2 film when initial ethenzamide concentration is higher than 0.45 ppm. Both the pseudo-first-order kinetic constants for Pt-TiO2 film and for non-porous TiO2 film decreased when the initial concentration of ethenzamide decreased from 0.45 ppm to 0.1 ppm probably due to the slower mass transfer of ethenzamide to the catalyst surface at lower concentration. However, the rate constant for nanoporous TiO2 film still increases and is even higher than that of Pt-TiO2 film. These results indicate that the nanoporous TiO2 film is a better catalyst than non-porous TiO2 film and Pt-TiO2 for photocatalytic degradation of low concentration pollutants under UV irradiation. The reason for the superior photocatalytic activity of the nanoporous TiO2 film can be ascribed to its numerous pores, which not only provide larger surface area for reaction, but also enhance the charge separation and generation of hydroxyl radicals, as a result the mass transfer is enhanced and the photocatalytic activity is significantly increased.26
3.3. Degradation of ethenzamide in the dynamic system
 | ||
| Fig. 4 (A) Photocatalytic degradation of ethenzamide under UV irradiation by different catalysts in the dynamic system; (B) the long term durability of nanoporous TiO2 film within 47 days and FE-SEM images of the nanoporous TiO2 film after long term operation with the inlet ethenzamide concentration of 0.5 ppm and residence time of 24 min. | ||
 | ||
| Fig. 5 The effect of ethenzamide concentration and residence time on photocatalytic degradation of low concentration ethenzamide under UV irradiation in the dynamic system. | ||
 | ||
| Fig. 6 (A) Photocatalytic degradation of ethenzamide at different residence time under VUV irradiation (inlet concentration is 0.5 ppm); (B) photocatalytic degradation of ethenzamide with different inlet concentrations under VUV irradiation (residence time is 1.8 min). | ||
Moreover, the nanoporous TiO2 film still shows obvious activity even when the inlet concentration of ethenzamide is as low as 15 ppb (Fig. 6B). However, the effect of the nanoporous TiO2 film becomes weaker with the decrease of ethenzamide concentration, which can be ascribed to slower diffusion of ethenzamide to catalyst surface at lower concentration.37
To further improve photocatalytic degradation of low concentration ethenzamide under VUV irradiation, we checked the effect of the flow state of water, reflected by the Reynolds number (Re).
The Reynolds number was calculated as follows:33
 | (2) |
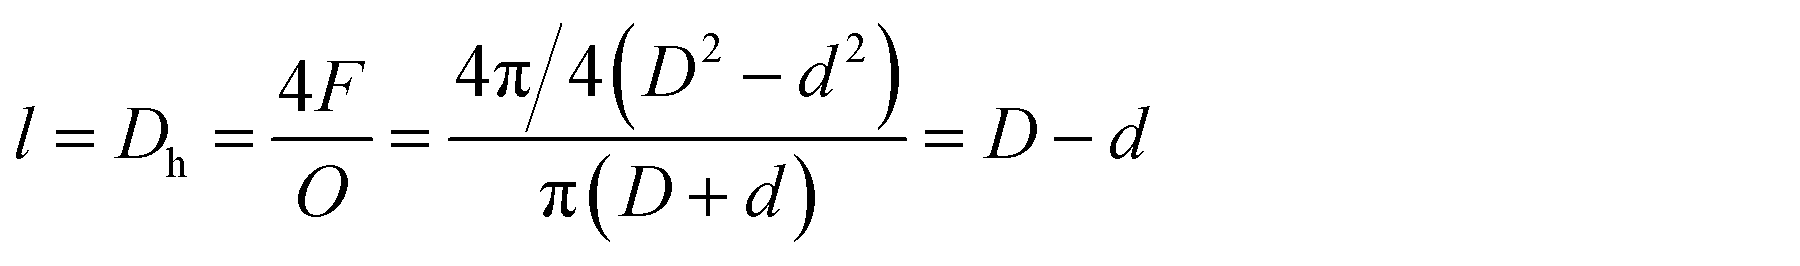 | (3) |
As shown in Fig. 7, we can see that the removal ratio of ethenzamide greatly increased when the Reynolds number increased from 32 to 324, confirming that the mass transfer really limits the degradation of low concentration ethenzamide under VUV irradiation and improved flow state can further increase the photocatalytic efficiency of nanoporous TiO2 film. When Reynolds number further increased to 1632, the removal ratio slightly increased. Moreover, the removal ratio by sole VUV also increase with increase of Reynolds number, which is reasonable because the penetration distance of 185 nm in water is ∼0.5 cm the flow state is also very important for VUV photolysis.
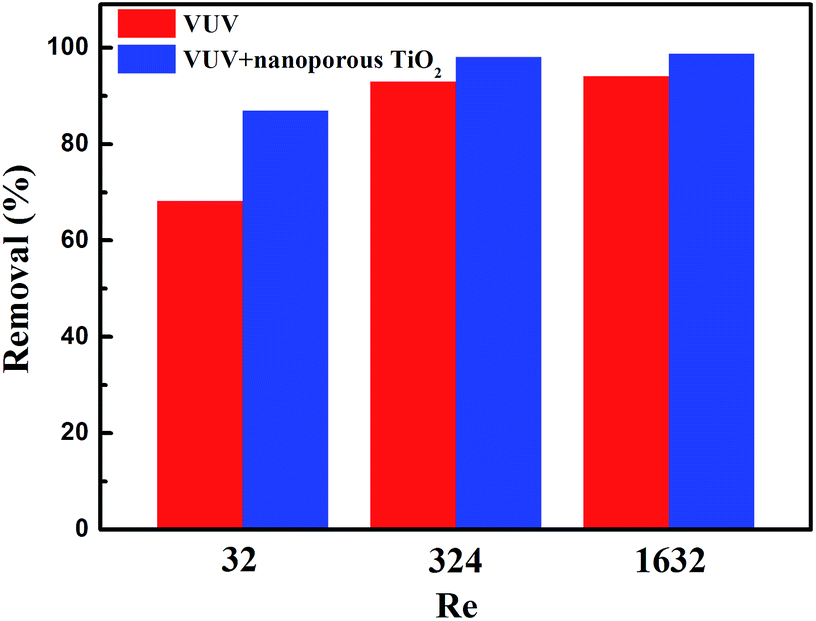 | ||
| Fig. 7 The effect of flow state on degradation of ethenzamide under VUV irradiation (inlet concentration is 100 ppb, residence time is 1.8 min). | ||
4. Conclusions
In summary, photocatalytic degradation of low concentration ethenzamide by nanoporous TiO2 film with exposed {001} facets under UV and 185 nm VUV irradiation was studied. The nanoporous TiO2 film exhibited considerably higher UV photocatalytic activity than non-porous TiO2 film and P25 coated on the Ti sheet, close to Pt-TiO2 film when initial ethenzamide concentration was higher than 0.45 ppm. It was found to have higher activity than Pt-TiO2 film when initial ethenzamide concentration decreased to 0.1 ppm. The nanoporous TiO2 film also exhibited superior UV photocatalytic activity at different residence time and long-term stability within 47 days' continuous treatment in the flow-through system. The nanoporous TiO2 film still showed significant photocatalytic activity when the concentration of ethenzamide was as low as 15 ppb under VUV irradiation even when the residence time was only 1.8 min. The mass transfer limits the degradation of low concentration ethenzamide and high Reynolds number can help to increase the photocatalytic efficiency of low concentration ethenzamide by nanoporous TiO2 film under VUV irradiation.Acknowledgements
This work was supported by the National Basic Research Program of China (2013CB632403), Science Fund for Creative Research Groups (21221004), the Collaborative Innovation Center for Regional Environmental Quality, and the Fundamental Research Funds for the Central Universities (2652015311, 2652015261).References
- S. K. Khetan and T. J. Collins, Chem. Rev., 2007, 107, 2319 CrossRef CAS PubMed.
- D. W. Kolpin, E. T. Furlong, M. T. Meyer, E. M. Thurman, S. D. Zaugg, L. B. Barber and H. T. Buxton, Environ. Sci. Technol., 2002, 36, 1202 CrossRef CAS PubMed.
- P. E. Stackelberg, E. T. Furlong, M. T. Meyer, S. D. Zaugg, A. K. Henderson and D. B. Reissman, Sci. Total Environ., 2004, 329, 99 CrossRef CAS PubMed.
- G. A. Loraine and M. E. Pettigrove, Environ. Sci. Technol., 2006, 40, 687 CrossRef CAS PubMed.
- X. Yang, R. C. Flowers, H. S. Weinberg and P. C. Singer, Water Res., 2011, 45, 5218 CrossRef CAS PubMed.
- E. N. Evgenidou, I. K. Konstantinou and D. A. Lambropoulou, Sci. Total Environ., 2015, 505, 905 CrossRef CAS PubMed.
- K. Kuroda, M. Murakami, K. Oguma, Y. Muramatsu, H. Takada and S. Takizawa, Environ. Sci. Technol., 2012, 46, 1455 CrossRef CAS PubMed.
- N. M. Vieno, H. Harkki, T. Tuhkanen and L. Kronberg, Environ. Sci. Technol., 2007, 41, 5077 CrossRef CAS PubMed.
- I. Kim and H. Tanaka, Environ. Int., 2009, 35, 793 CrossRef CAS PubMed.
- I. Kim, N. Yamashita and H. Tanaka, Chemosphere, 2009, 77, 518 CrossRef CAS PubMed.
- M. R. Hoffmann, S. T. Martin, W. Choi and D. W. Bahnemann, Chem. Rev., 1995, 95, 69 CrossRef CAS.
- S. Liu, J. Yu and M. Jaroniec, J. Am. Chem. Soc., 2010, 132, 11914 CrossRef CAS PubMed.
- N. A. Hamill, L. R. Weatherley and C. Hardacre, Appl. Catal., B, 2001, 30, 49 CrossRef CAS.
- X. Gong and A. Selloni, J. Phys. Chem. B, 2005, 109, 19560 CrossRef CAS PubMed.
- M. Lazzeri, A. Vittadini and A. Selloni, Phys. Rev. B: Condens. Matter Mater. Phys., 2001, 63, 155409 CrossRef.
- H. Yang, C. Sun, S. Qiao, J. Zou, G. Liu, S. C. Smith, H. Cheng and G. Lu, Nature, 2008, 453, 638 CrossRef CAS PubMed.
- W. Xiang, R. Li, X. Qian, H. Han and C. Li, Acta Phys.-Chim. Sin., 2013, 29, 1566 Search PubMed.
- M. Liu, L. Piao, L. Zhao, S. Ju, Z. Yan, T. He, C. Zhou and W. Wang, Chem. Commun., 2010, 46, 1664 RSC.
- M. Liu, L. Piao, W. Lu, S. Ju, L. Zhao, C. Zhou, H. Li and W. Wang, Nanoscale, 2010, 2, 1115 RSC.
- H. Li, Y. Zeng, T. Huang, L. Piao, Z. Yan and M. Liu, Chem.–Eur. J., 2012, 18, 7525 CrossRef CAS PubMed.
- M. Liu, H. Li, Y. Zeng and T. Huang, Appl. Surf. Sci., 2013, 274, 117 CrossRef CAS.
- M. Liu, M. Zhong, H. Li, L. Piao and W. Wang, ChemPlusChem, 2015, 80, 688 CrossRef CAS.
- Y. Ren, L. J. Hardwick and P. G. Bruce, Angew. Chem., 2010, 122, 2624 CrossRef.
- D. Kim, K. Lee, P. Roy, B. I. Birajdar, E. Spiecker and P. Schmuki, Angew. Chem., 2009, 121, 9490 CrossRef.
- J. Wang, Z. Bian, J. Zhu and H. Li, J. Mater. Chem. A, 2013, 1, 1296 CAS.
- T. Xu, H. Zheng, P. Zhang and W. Lin, J. Mater. Chem. A, 2015, 3, 19115 CAS.
- K. R. Back, R. J. Davey, T. Grecu, C. A. Hunter and L. S. Taylor, Cryst. Growth Des., 2012, 12, 6110 CAS.
- K. Kuroda, M. Murakami, K. Oguma, Y. Muramatsu, H. Takada and S. Takizawa, Environ. Sci. Technol., 2012, 46, 1455 CrossRef CAS PubMed.
- N. Nakada, K. Kiri, H. Shinohara, A. Harada, K. Kuroda, S. Takizawa and H. Takada, Environ. Sci. Technol., 2008, 42, 6347 CrossRef CAS PubMed.
- K. Zoschke, H. Börnick and E. Worch, Water Res., 2014, 52, 131 CrossRef CAS PubMed.
- T. Oppenländer, C. Walddörfer, J. Burgbacher, M. Kiermeier, K. Lachner and H. Weinschrott, Chemosphere, 2005, 60, 302 CrossRef PubMed.
- W. Han, W. Zhu, P. Zhang and L. Li, Catal. Today, 2004, 90, 319 CrossRef CAS.
- S. Dobrović, H. Juretić and N. Ružinski, Sep. Sci. Technol., 2007, 42, 1421 CrossRef.
- M. Sayed, P. Fu, H. M. Khan and P. Zhang, Int. J. Photoenergy, 2014, 2014, 490264 CrossRef.
- W. Lin, H. Zheng, P. Zhang and T. Xu, Appl. Catal., A, 2016, 521, 75 CrossRef CAS.
- J. Liu, X. Yu, Q. Liu, R. Liu, X. Shang, S. Zhang, W. Li, W. Zheng, G. Zhang, H. Cao and Z. Gu, Appl. Catal., B, 2014, 158–159, 296 CrossRef CAS.
- W. Han, P. Zhang, W. Zhu, L. Li and N. Sai, China Environ. Sci., 2003, 23, 259 CAS.
| This journal is © The Royal Society of Chemistry 2016 |