 Open Access Article
Creative Commons Attribution 3.0 Unported Licence
Grouping and aggregation of ligand protected Au9 clusters on TiO2 nanosheets†
Hassan S.
Al Qahtani
a,
Rintaro
Higuchi
b,
Takayoshi
Sasaki
b,
Jason F.
Alvino
c,
Gregory F.
Metha
c,
Vladimir B.
Golovko
d,
Rohul
Adnan
d,
Gunther G.
Andersson
 *a and
Tomonobu
Nakayama
*b
aFlinders Centre for NanoScale Science and Technology, Flinders University, Adelaide, SA 5001, Australia. E-mail: gunther.andersson@flinders.edu.au
bInternational Center for Materials Nanoarchitectonics (WPI-MANA), National Institute for Materials Science (NIMS), 1-1 Namiki, Tsukuba, Ibaraki 305-0044, Japan. E-mail: NAKAYAMA.Tomonobu@nims.go.jp
cDepartment of Chemistry, The University of Adelaide, Adelaide, SA 5005, Australia
dThe MacDiarmid Institute for Advanced Materials and Nanotechnology, Department of Chemistry, University of Canterbury, Christchurch 8140, New Zealand
First published on 10th November 2016
Abstract
Atomically precise chemically synthesised Au clusters, in the form of [Au9(PPh3)8](NO3)3, were deposited onto titania nanosheets after UV pre-treatment of the substrate and examined with scanning tunneling microscopy (STM), atomic force microscopy (AFM) and synchrotron X-ray photoelectron spectroscopy (XPS) before and after heat treatment. The STM, AFM and XPS results complement each other. AFM was performed to determine the height of the deposited species and their dispersion on titania nanosheets. STM shows groups of clusters that at least partially consist of individual clusters both before and after annealing. STM cannot exclude the existence of individual clusters on the titania nanosheets outside the groups. XPS shows that before annealing the Au clusters are attached to the titania surface as individual clusters thus as clusters with non-agglomerated cluster cores. After annealing, both individual and agglomerated clusters are found on the surface. The combination of AFM, STM and XPS shows that the groups formed by the clusters consist of individual and agglomerated clusters.
Introduction
Nanoclusters (NCs) are of particular interest because of their unique physical and chemical properties, which are different to the properties of the respective bulk materials.1–11 Small clusters containing only a few metal atoms show fluxionality leading to a change in conformation of the clusters at room temperature.12 The fluxionality decreases with the increasing size of the cluster.13–15 Small clusters show discrete energy levels for the valence electrons. With the increasing size of the cluster the energy levels move closer together. At a size in the order of a few hundred atoms, the metal NCs start to exhibit metallic character.16–19Metal NCs can be generated either in the gas-phase and subsequently deposited onto surfaces under UHV15,20 Alternatively, they can be synthesised chemically as size-specific ligand-protected clusters, which can be deposited onto surfaces from solutions.21,22 Such supported clusters can be used in a wide range of applications, such as sensors and catalysis. Metal NCs deposited onto surfaces modify the electronic structure of the surfaces. For understanding the metal NCs properties deposited onto surfaces it is important to study their size and their dispersion on the surfaces as well as their electronic properties.23,24 Subsequent to deposition on a surface, the clusters can agglomerate and lose the properties of the small clusters. It is thus of interest to investigate the size of the clusters after application of various post-treatments such as heating or chemical washing in an attempt to remove ligands for activating the deposited clusters as catalytic sites. Among all the metal NCs available today, specifically Au NCs have attracted interest in catalysis for CO oxidation because Au NCs have unique electronic properties.25,26 The catalytic activity of Au clusters deposited onto surfaces has been shown to depend strongly on the number of atoms forming the cluster core.21,22,27–33
The geometrical and electronic structure of the clusters depends on the size of the Au NCs. and are thus affected by the distribution of the clusters over the surface, e.g. whether or not clusters have agglomerated to form larger clusters or even nanoparticles (NPs) (>100 atoms). Microscopy techniques such as atomic force microscopy (AFM)34 and scanning tunneling microscopy (STM)19,35–39 are important tools for determining the geometrical and electronic properties of clusters on surfaces, especially their size and distribution on the surfaces. Scanning probe microscopy techniques (SPM) such as AFM and STM are less damaging, milder techniques than electron microscopy such as transmission electron microscopy (TEM). Recently, we have determined the geometrical structure of [Au9(PPh3)8](NO3)3 clusters (hereafter abbreviated as Au9) clusters deposited on titania nanosheets with atomic resolution using high-angle annular dark field scanning transmission electron microscopy (HAADF STEM).12 In electron microscopy, electron irradiation can easily affect the samples due to the energy transferred from the electron beam to the sample which can cause serious damage to the samples40,41 by breaking up clusters or inducing agglomeration. In contrast, SPMs are in principle capable of acquiring high-resolution images without affecting the size and distributions of clusters across surfaces. The chemical compositions of the samples can be identified by high intensity electron spectroscopy such as synchrotron X-Ray Photoelectron Spectroscopy (XPS).21,22,42 In previous work we have characterized Au9 clusters (hereafter abbreviated as Au9) with XPS subsequently to the deposition of the clusters on titania.21,22 The final state effect of protected Au NCs in XPS offers the possibility to estimate the size of clusters. The XPS data can also be used to determine whether or not ligands are removed from the metallic cluster core and whether or not the Au NCs agglomerate.21,22 However, XPS does not have the lateral resolution required to determine the distribution of clusters on a surface – a challenge which motivated this study.
Titania is a particularly interesting support for Au NP-based heterogeneous catalysis.43 On reducible transition metal oxides such as TiO2, the presence of O vacancies associated with extra electrons result in a stronger bond with a metal cluster.44–46 Titania nanosheets are used in the present work as support for Au9 clusters. Ultrathin oxide films with a thickness of 20 Å or less are considered as an interesting support material because their properties differ from the respective thicker bulk material.47 Examples are the dielectric constant, which is higher for TiO2 nanosheets compared to rutile or anatase the density of defect on the surfaces of these two titania materials and the band gaps of the materials.48 Thus, it can be expected that the interaction of the Au NCs with titania nanosheets is expected to be different to other titania substrates. Other materials used for Au-metaloxide nanohybrides are CuO49 and ZnO.50
In the present work, we have applied STM and AFM to determine the size and the distribution of chemically-synthesised, atomically precise Au9 clusters deposited onto titania nanosheets. XPS is used to monitor the change in the size of Au9 clusters before and after annealing. The aim of the work is to determine the degree of aggregation of the Au9 clusters after deposition and after annealing of the clusters.
Experimental
The Au9 clusters used in the present work were synthesized according to a well-established, previously reported method.51 The structure of Au9 clusters was confirmed by nuclear magnetic resonance spectroscopy (NMR), mass spectrometry (MS) and X-ray crystallography. Further, electron diffraction using TEM has been applied previously.52 The Au9 clusters were deposited onto titania (Ti0.87O2) nanosheets that have a thickness of 1.1 nm (ref. 53 and 54) and were prepared by delamination from a parent layered K0.8Ti1.73Li0.27O4 crystal using a soft chemical procedure.55,56 The thickness of the nanosheets is determined by the crystal structure of the parent crystal and thus intrinsic to the compound.52 Further information about the thickness of the nanosheets is provided in the ESI.†For sample preparation, the titania-nanosheets were deposited on a cleaned 10 × 10 mm2 silicon wafer and exposed to ultraviolet (UV) light irradiation in air to photocatalytically decompose the tetrabutylammonium ions surrounding the nanosheets in a process as described in.57 Finally, the silicon/titania nanosheet samples were immersed into a 0.02 mM Au9 methanoic (ultrapure grade) solution for 30 minutes, followed by brief rinsing in ultrapure methanol (Methanol Infinity Pure, Wako company-Japan) with subsequent drying in a room-temperature stream of pure N2 (generated from liquid N2). Annealing of the samples studied in this paper was carried out at 200 °C for 20 minutes under high vacuum. Annealing was applied in order to remove the PPh3 ligands and was performed in a very similar way to that used in our previous work.21,22 The concentration of 0.02 mM has been chosen based on earlier published results.10,12 The thickness of the nanosheets has been checked with AFM and STEM and is described in the ESI.†
The AFM images were acquired in AC tapping mode on an Asylum MFP3D SPM (Asylum Research, USA) at room temperature in air. Tapping mode can reduce the lateral forces applied to the sample and thus results in a lower degree of damage to samples than contact mode. Au9 clusters adsorbed from solutions were found to be stable against the tapping AFM mode. AFM cantilevers with a suitable spring constant were chosen to provide stable images under tapping mode but also so that the tip did not move the Au9 clusters during the imaging process. Olympus OMCL-AC160TS-C3 probes with resonant frequency of 300 kHz (spring constant 26.2 N m−1) were used for this work.
We also performed STM measurements on the same samples previously investigated with AFM. STM observations were carried out with a constant current mode at room temperature under UHV conditions (∼10−9 Pa) with electrochemically etched tungsten tips. STM could stably image the sample surface with conditions of a tunneling current of 25 pA and sample bias voltages (Vs) of 1.5–6 V. Samples were also investigated with STM after heating the sample to 200 °C for 20 minutes after at least 3 to 4 hours under UHV. It should be noted that individual clusters could be moved when applying the STM scanning procedure, which could result in either removal of clusters from the scanned area or lead to drift of clusters in an image.
In order to estimate the probability of tunneling of electrons between the STM tip and the substrate, DFT calculations were employed to calculate the energy levels of the molecular orbitals in the Au9 cluster. Detailed information about the method employed for the DFT calculations can be found elsewhere.12
The photoelectron spectra of Au9 clusters as deposited on titania nanosheets and after annealing at 200 °C were recorded at the Soft X-ray Beamline at the Australian Synchrotron (AS) by using a SPECS Phoibos 150 hemispherical electron analyser. The photon energy used was 690 eV. The spot size of the irradiation beam was adjusted to ∼600 × 600 μm2 with an X-ray photon flux of approximately 1012 photons mm−2 s−1. These conditions have been previously shown not to induce damage to samples as those investigated here.58 High resolution XP spectra of C, O, Si, P, Ti and Au were recorded at a pass energy of 10 eV with an instrumental resolution of 295 meV.59 The stability of the X-ray energy was monitored using a bulk Au reference and the scans were repeated several times to ensure that the X-ray irradiation did not affect the samples. For all XP spectra, a Shirley background was applied to remove the electron-scattering background. A sum of Gaussian (30%) and Lorentzian (70%) functions was used to fit all peaks including the peak positions as described previously.22
Results and discussion
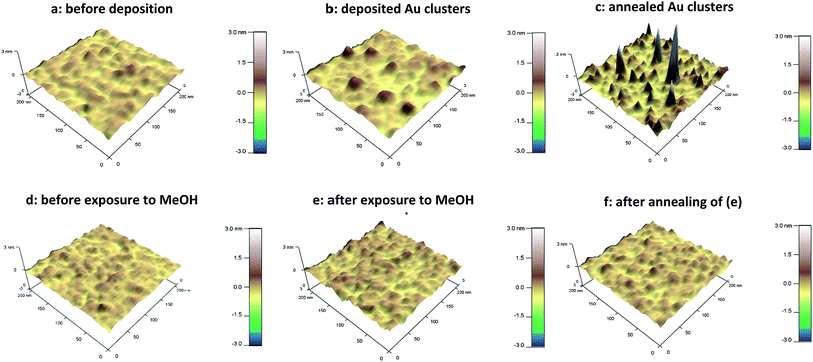
AFM study of the height distribution of Au9 clusters on titania nanosheet.Fig. 1a–c show the AFM 3D images of the titania nanosheet before and after adsorption of Au9 clusters and also after annealing, respectively. These 3D images correspond to the magnified area from topographical images shown in Fig. S3.†Fig. 1d–f show AFM 3D images of the titania nanosheets before and after exposure to methanol only, and after annealing, respectively. Methanol was used as solvent in the deposition of the Au9 clusters and so these images provide a “solvent only” reference of the effect of processing conditions in the absence of the Au9 clusters. The “solvent only” reference images show that the roughness of the surface increases only marginally due to the exposure to the pure solvent. It can be noted that the random distribution of spikes observed in Fig. 1b and c are not seen in the image of the samples that were exposed to solvent only (Fig. 1e and f). Therefore, the spikes in Fig. 1b and c must be attributed to Au9 clusters.
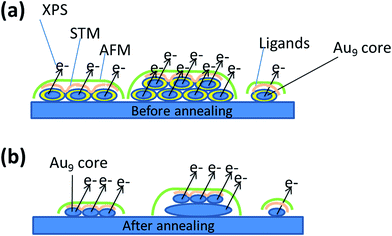
AFM imaging allows for height analysis of the Au NCs. Due to the size of the curvature of the AFM tip and the range of the interaction force between the surface and the tip it is not possible to resolve individual Au9 clusters i.e. individual features with a lateral size smaller than the resolution of AFM will appear almost the same in the image. The measurement of the height of the Au9 clusters, however, is not affected by the curvature of the tip and can be evaluated. The resulting course of the AFM tip is illustrated in Fig. 2. In Fig. 2a, various possible model configurations of the Au9 clusters on the titania surface are sketched. On the left a group of Au9 clusters in close proximity are shown to form a monolayer of clusters. In the centre image a group of Au9 clusters in close proximity are shown forming a double layer of clusters; such layering is certainly not limited to only double layers. However, it needs to be emphasised that the results shown in the present work do not provide experimental evidence for the formation of double or multilayers. The possibility of the formation of a double layer is shown in Fig. 2 only because such layer formation cannot be excluded and any layer below the top layer would have a structure that could not be determined with the methods used in the present work. On the right, a single cluster on the titania surface is illustrated. The AFM tip scanning over each of the three groups is indicated by the green line and only the height of the groups or the single cluster can be identified. Thus the left and the right case will appear to be similar in the AFM image. The possible scenarios after annealing are sketched in Fig. 2b. The Au9 clusters have lost ligands and form groups or individual clusters containing only the cluster core. Similar to the case of as deposited clusters (i.e. no heating), the AFM tip can only identify the height of Au species (medium and larger aggregates from NCs), but could not distinguish groups of several closely located clusters from the individual clusters.
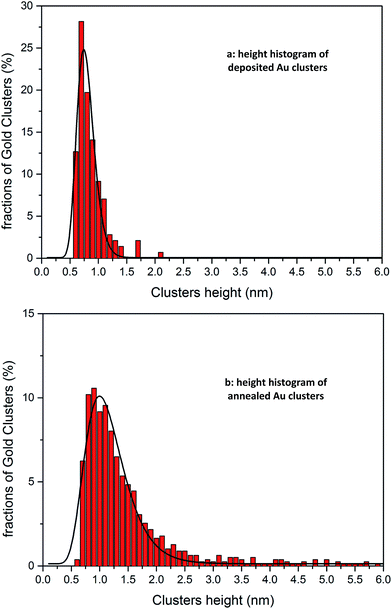
Cluster heights were evaluated from the AFM images using the particle analysis tool of the Asylum software. For evaluating the AFM images, a large number (several hundreds) of features in the AFM images were analysed and the height of the features is shown as a statistical distribution. The roughness of the substrate is taken into account for this procedure in order to differentiate features related to Au9 clusters. It was found that the vast majority of features in the AFM images of bare titania nanosheets with and without exposure to the solvent are less than 0.5 nm in height. Thus, all features in the AFM images of titania nanosheets with adsorbed Au9 clusters that were less than 0.5 nm in height were not considered in the statistical analysis. Au9 clusters are larger than 0.5 nm in diameter51 and thus the discrimination of 0.5 nm in the height analysis does not exclude Au9 clusters in the evaluation procedure. In Fig. 3a and b, the height distributions of the features identified as Au9 clusters on titania nanosheets before and after annealing are shown. The fraction of the features found for a given height interval are calculated by
STM observation and width distribution of Au9 clusters on titania nanosheet
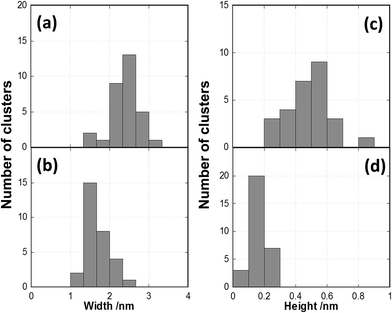
Fig. 4a and c show STM images of titania nanosheets with deposited Au9 clusters before heating. The STM images of blank samples before and after annealing (UV-irradiated nanosheets and also MeOH-treated nanosheets on the Si wafers) are shown in the ESI (Fig. S5†). A black arrow in Fig. 4c indicates an example of hemispherically shaped feature, which were not observed in the blank sample before heating (Fig. S5c†). The statistical distribution of the height and width of the features in the STM images are shown in Fig. 5. In the statistical analysis we only considered features which are approximately symmetric spots (typical examples are shown as open blue circles in Fig. 4) to measure the width and height, and excluded asymmetric spots because these could be drifting clusters. The width distribution of the Au NCs before heating varies from 2 nm to 3 nm, with the average found at 2.4 ± 0.4 nm (Fig. 5a). The height distribution varies from 0.2 nm to 0.7 nm with the average found at 0.5 ± 0.2 nm (Fig. 5c). Based on the width of the bright hemispherical features shown in Fig. 4c, we can attribute these to individual Au9 clusters. The average height of the features, however, is smaller than the theoretical height of the Au9 clusters. We assume that the reason for this finding is that the STM tip during the scanning process does not get into contact with the nanosheet layer underlying the Au9 clusters and thus the height variation found in the STM images is less than the height of individual clusters. The interpretation of the STM images is given in Fig. 2a where the orange line illustrates that the STM tip does not reach the titania nanosheet substrate. However, the lateral resolution is better than in AFM and individual Au9 clusters can be identified.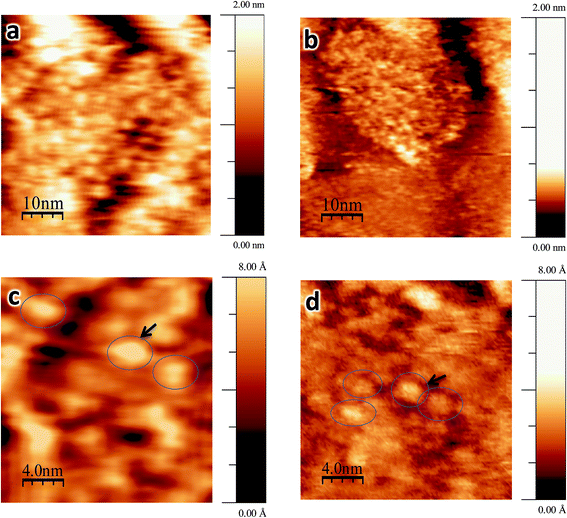 | ||
| Fig. 4 STM images of Au9 clusters deposited on titania nanosheets: (a) as-deposited, (b) after annealing to 200 °C. Images (c) and (d) are magnifications of (a) and (b). The image size is 50 × 50 nm2 for (a) and (b) and 20 × 20 nm2 for (c) and (d). The STM operation conditions were (a) +1.5 V, 20 pA; (b) +2.0 V, 18 pA; (c) +1.5 V, 20 pA; (d) +2.5 V, 25 pA. Heights and widths of the clusters which are surrounded by open blue circles were used for the histogram analysis (Fig. 5). | ||
After annealing at 200 °C for 20 minutes under UHV, STM measurements were repeated for the same sample. Fig. 4b and d show STM images of annealed Au clusters. The brighter spots can be identified in the same way as in the case of non-annealed samples (Fig. 4a and c); note that the bright spots are not observed in the heated blank sample (Fig. S5d†). A black arrow in Fig. 4d indicates one of the individual Au NCs. In Fig. 5b and d the width and height distributions of the features after annealing are shown. In comparison with the non-annealed samples, the width distribution has decreased to 1.3–2.3 nm with an average of 1.7 ± 0.3 nm, and the height distribution to 0.1–0.2 nm with the average 0.17 ± 0.05 nm. The significant decrease in cluster width is compatible with the evidence from the XPS data shown below that the ligands have been removed through the annealing process. The height, however, is less than what is expected from the cluster core. However, it is important to mention that the 2D cluster reported in our previous paper should have a height around 0.2 nm,12 which is in good agreement with the measured height in this work. The scanning process of the STM tip is illustrated in Fig. 2b. As explained for the non-heated samples, the STM tip does not interact with the layer underlying the top of the Au9 NCs and thus the height variation is less than the height of an individual cluster core.
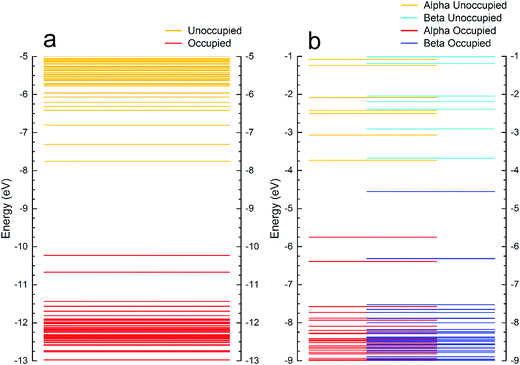
Fig. 6a shows the energy levels of ligated Au9 before heating while Fig. 6b shows the Au9 cluster core without ligands (corresponding to Au9 clusters after removing the ligands through heating). These isomers have been observed as preferable configurations for deposited Au9 clusters on titania nanosheet.12 The molecular orbital visualisations in Fig. 6a show that the ligands are not electronically transparent to STM at the chosen bias voltages, thus electrons could tunnel into the respective energy levels. For estimating whether electrons could tunnel into specific orbitals of the clusters, two considerations have to be taken into account; (i) that the Fermi level is the reference potential when applying the bias voltage in STM and that it lies approximately half-way between the occupied and unoccupied orbital and (ii) that the energy of the molecular orbitals of a cluster are broadened owing to the interaction with the adjacent cluster or with the substrate. At room temperature, the molecular orbitals within an energy range of 0.5 to 1 eV overlap due to the energetic broadening of each orbital. Therefore, we consider in Fig. 6 that not only is a single molecular orbital is involved (i.e. the LUMO) but that combinations of orbitals can be accessed (i.e. LUMO, LUMO+1 and LUMO+2). It will be shown below that in all STM images the Au clusters appear approximately hemispherically shaped both before and after heating. This implies that electrons are tunneling into a range of orbitals and not into one specific orbital.
XPS results of Au9 clusters on titania nanosheet
High resolution XP spectra of the Au clusters deposited onto titania nanosheet have been measured for the Au 4f, P 2p, Si 2p, Ti 2p, C 1s and O 1s regions. The main C 1s peak is assigned to 285 eV and used to calibrate peak position for all other elements. The Au shows the Au 4f doublet with the Au 4f7/2 peak found at 84.8 eV (Fig. 7a) for the non-heated sample, which is close to the binding energy previously found for as-deposited, non-agglomerated Au9 clusters.9,21,22 No signal is observed at 84 ± 0.2 eV, the binding energy of bulk Au. The shift from bulk gold for the Au 4f7/2 peak position of isolated Au9 clusters is attributed to the final state effect as has been described in detail in our previous work.21,22 The Au XP spectrum of the annealed titania nanosheet/Au9 sample is shown in Fig. 7b and shows two Au 4f doublets. A narrow peak is found at 83.8 ± 0.2 eV and is consistent with the value for the binding energy for bulk Au. This is attributed to aggregated nanoparticles much larger than Au9 clusters that arise from the heating procedure.22 The second, broader Au 4f7/2 peak is found at higher binding energy, 85.3 ± 0.2 eV. This peak is attributed to non-agglomerated Au9 clusters that have lost ligands and are in close, electronic contact with the titania substrate.22,65 The P 2p3/2 peak is found at 131.6 ± 0.2 eV and is attributed to ligands attached to the Au NCs (Fig. 7c).21,22 After annealing, no P signal was found which means that the ligands have been detached from the Au9 cluster core through the heating procedure and removed from the sample under UHV. Titanium signal 2p3/2 is found at 459 eV for all samples (Fig. S6†). There is a small shoulder at 457.5 eV that can be seen in the Ti spectra, owing to the presence of reduced titania surfaces (Ti3+) as an effect of the UV or X-ray irradiation, inducing O vacancy in the titania nanosheet.8,43,66 After vacuum annealing the Ti3+ peak increases and is due to the increase in the number of the defects.8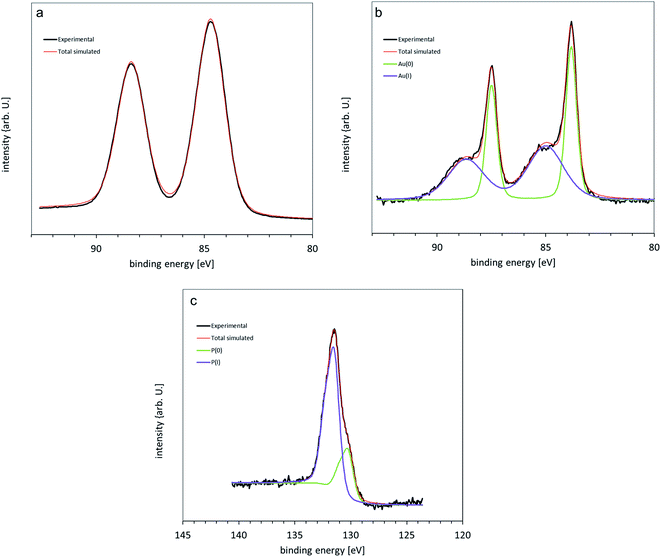 | ||
| Fig. 7 XPS of [Au9(PPh3)8](NO3)3 clusters on titania nanosheet (a) 4f Au spectrum of as-deposited samples, (b) after annealing and (c) the 2p P peak of as-deposited samples. | ||
The interpretation of the XPS results for the non-annealed samples is illustrated in Fig. 2. It is important to note that the electron mean free path for the samples investigated here is about 1.5 nm and thus XPS is sensitive for a depth around 4 to 5 nm. Irrespective of whether the clusters form larger groups of Au9 clusters or are isolated on the surface, each individual cluster has its own cluster core and the emission of electrons from a given cluster is influenced by the final state effect as illustrated in Fig. 2a. Thus all Au9 clusters appear as individual and isolated clusters irrespective whether another Au9 cluster is located in close proximity or not. After removing the ligands through annealing, the clusters form groups in which the cluster cores have either merged into a larger particle, similar to the larger block in the middle of Fig. 2b, or they form groups in which the individual clusters are in close proximity but the cluster cores are retained as individual clusters. The latter option is illustrated on the right and left in Fig. 2b, and the top layer in the middle of the figure.
Integrating AFM, STM and XPS results
AFM, STM and XPS measurements reveal complementary information about the properties of the Au9 clusters deposited onto titania nanosheet and can be integrated into a single interpretation. The interpretation is schematically illustrated in Fig. 2. The AFM measurements allow height analysis of the features attributed to Au9 clusters. Before heating, the majority of features found in the AFM images show a height corresponding to the smallest diameter of individual Au9 clusters. Identifying individual Au NCs is not possible with AFM due to the large tip curvature and the large interaction range between the AFM tip and the sample. In contrast, STM is used to investigate small areas with the size of a few nanometers with high lateral resolution sufficient to resolve individual Au NCs. It needs to be taken into account that individual clusters outside groups were not seen in STM most likely because they were moved out of the image area when scanning the STM tip across the desired area. The STM images identify individual Au9 clusters even when they form groups of clusters within close proximity to each other. In contrast to AFM, it is very difficult to determine the total height of a group of clusters with STM. Based on the final state effect found in the XPS results, it can be concluded that the Au9 clusters are individual and separate clusters.After annealing of the samples, the Au9 clusters have lost the PPh3 ligands. The cluster cores could either retain their identity as Au9 cluster cores or merge into larger particles, as schematically illustrated in Fig. 2b. AFM measurements show that partial agglomeration has occurred leading to an increase of the heights of the features found. However, a significant number of features have retained the height of single clusters. The STM results cannot be used to derive information about the overall size of the groups formed by the clusters but can shed light on the fine structure of the top layer of a group. The STM results allow identifying individual clusters but do not allow us to draw conclusions about whether these individual clusters in the top layer have merged electronically or retained their individual structure. XPS shows that at least a fraction of the Au9 clusters have not merged to form a bulk electronic structure and have retained their individual electronic structure. This conclusion is based on the XPS data, which shows species with Au 4f7/2 electron binding energy of 85.3 ± 0.2 eV that can only be due to small clusters. STM also cannot be used to reveal information about the layer below the top Au cluster layer. The layer below could be the substrate, or it could be a layer of agglomerated Au clusters as sketched in the middle section of Fig. 2b, or it could be composed of the individual Au clusters. The layer below the top layer could be formed by agglomerated clusters, which could explain the XPS Au 4f7/2 peak found at 83.8 ± 0.2 eV which is assigned to larger bulk Au particles. In this context, it is important to note that the depth for which XPS is sensitive is much larger than in the case of STM. Summarising the STM, AFM and XPS data it can be concluded, that agglomeration does not necessarily include all clusters within a group. At least in the top layer of these groups, individual clusters could be identified that most likely have retained the electronic structure of individual clusters.
In a previous study, we investigated the deposition of Au9 clusters onto plasma treated ALD titania.10 The coverage of ALD titania with Au in the earlier study was approximately 40 times lower compared to the present case (the Au/Ti ratio was less than 0.1 in ref. 10 and it is 3.5 here). We assume that the higher coverage of the titania nanosheet surface with non-agglomerated Au9 clusters is due to the larger number of defects on the titania nanosheet surface compared to the surface of ALD titania.
Conclusions
Au9 clusters deposited on titania nanosheets have been investigated with AFM, STM and XPS. Each method has allowed the determination of specific information about the structure of the Au9 clusters before and after annealing which have been integrated into an overall interpretation of the Au9/titania surface. After deposition, the Au9 clusters attached to the surface with a range of configurations from individual clusters to groups of clusters. All clusters have retained their individual electronic structure. Heating of the samples to 200 °C leads to partial agglomeration of the Au NCs that lead to the formation of larger Au particles. Some clusters, however, are not involved in agglomeration and are left as individual isolated clusters on the surface. The electronic structure of the agglomerated Au particles is different to that of the isolated individual clusters. Agglomeration does not necessarily include all clusters within a group. At least in the top layer of these groups, individual clusters could be identified that most likely have retained the electronic structure of individual clusters.Acknowledgements
We would like to thank the King Abdullah Foreign Scholarship Program (KASP-Saudi Arabia) for providing the scholarship support for H. S. Al Qahtani. We also acknowledge that the research undertaken at the National Institute of Material Science in Japan was through the Flinders University-NIMS partnership. The XPS data were collected at the soft X-ray beamline at the Australian Synchrotron, Victoria, Australia (grant AS123/SXR/5335). Computing resources provided by the National Computational Infrastructure (NCI) Facility and eResearch SA is also gratefully acknowledged.References
- T. Imaoka, H. Kitazawa, W. J. Chun, S. Omura, K. Albrecht and K. Yamamoto, J. Am. Chem. Soc., 2013, 135, 13089–13095 CrossRef CAS PubMed.
- F. Baletto and R. Ferrando, Rev. Mod. Phys., 2005, 77, 371–423 CrossRef CAS.
- W. A. de Heer, Rev. Mod. Phys., 1993, 65, 611–676 CrossRef CAS.
- G. Schmid, M. Baumle, M. Geerkens, I. Heim, C. Osemann and T. Sawitowski, Chem. Soc. Rev., 1999, 28, 179–185 RSC.
- L. N. Lewis, Chem. Rev., 1993, 93, 2693–2730 CrossRef CAS.
- M.-C. Daniel and D. Astruc, Chem. Rev., 2004, 104, 293–346 CrossRef CAS PubMed.
- R. Ferrando, J. Jellinek and R. L. Johnston, Chem. Rev., 2008, 108, 845–910 CrossRef CAS PubMed.
- T. Bennett, R. H. Adnan, J. F. Alvino, R. Kler, V. B. Golovko, G. F. Metha and G. G. Andersson, J. Phys. Chem. C, 2015, 119, 11171–11177 CAS.
- J.-Y. Ruzicka, F. Abu Bakar, C. Hoeck, R. Adnan, C. McNicoll, T. Kemmitt, B. C. Cowie, G. F. Metha, G. G. Andersson and V. B. Golovko, J. Phys. Chem. C, 2015, 119, 24465–24474 CAS.
- G. G. Andersson, V. B. Golovko, J. F. Alvino, T. Bennett, O. Wrede, S. M. Mejia, H. S. Al Qahtani, R. Adnan, N. Gunby, D. P. Anderson and G. F. Metha, J. Chem. Phys., 2014, 141, 014702 CrossRef PubMed.
- J. F. Alvino, T. Bennett, D. Anderson, B. Donoeva, D. Ovoshchnikov, R. H. Adnan, D. Appadoo, V. Golovko, G. Andersson and G. F. Metha, RSC Adv., 2013, 3, 22140–22149 RSC.
- H. S. Al Qahtani, K. Kimoto, T. Bennett, J. F. Alvino, G. G. Andersson, G. F. Metha, V. B. Golovko, T. Sasaki and T. Nakayama, J. Chem. Phys., 2016, 144, 114703 CrossRef PubMed.
- Z. W. Wang, O. Toikkanen, B. M. Quinn and R. E. Palmer, Small, 2011, 7, 1542–1545 CrossRef CAS PubMed.
- K. J. Batenburg, R. Erni, M. D. Rossell, S. Van Aert and G. Van Tendeloo, Nature, 2011, 470, 374–377 CrossRef PubMed.
- B. Yoon, H. Häkkinen, U. Landman, A. S. Wörz, J.-M. Antonietti, S. Abbet, K. Judai and U. Heiz, Science, 2005, 307, 403–407 CrossRef CAS PubMed.
- D. Lee, R. L. Donkers, G. Wang, A. S. Harper and R. W. Murray, JACS, 2004, 126, 6193–6199 CrossRef CAS PubMed.
- J. Jung, H. Kim and Y.-K. Han, JACS, 2011, 133, 6090–6095 CrossRef CAS PubMed.
- G. Ramakrishna, O. Varnavski, J. Kim, D. Lee and T. Goodson, JACS, 2008, 130, 5032–5033 CrossRef CAS PubMed.
- M. Valden, X. Lai and D. W. Goodman, Science, 1998, 281, 1647–1650 CrossRef CAS PubMed.
- S. Kunz, K. Hartl, M. Nesselberger, F. F. Schweinberger, G. Kwon, M. Hanzlik, K. J. J. Mayrhofer, U. Heiz and M. Arenz, PCCP, 2010, 12, 10288–10291 RSC.
- D. P. Anderson, R. H. Adnan, J. F. Alvino, O. Shipper, B. Donoeva, J.-Y. Ruzicka, H. Al Qahtani, H. H. Harris, B. Cowie, J. B. Aitken, V. B. Golovko, G. F. Metha and G. G. Andersson, Phys. Chem. Chem. Phys., 2013, 15, 14806–14813 RSC.
- D. P. Anderson, J. F. Alvino, A. Gentleman, H. A. Qahtani, L. Thomsen, M. I. J. Polson, G. F. Metha, V. B. Golovko and G. G. Andersson, Phys. Chem. Chem. Phys., 2013, 15, 3917–3929 RSC.
- M. Haruta, Catal. Today, 1997, 36, 153–166 CrossRef CAS.
- K. Judai, S. Abbet, A. S. Wörz, U. Heiz and C. R. Henry, JACS, 2004, 126, 2732–2737 CrossRef CAS PubMed.
- M. S. Chen and D. W. Goodman, Catal. Today, 2006, 111, 22–33 CrossRef CAS.
- P. Pyykkö, Angew. Chem., Int. Ed., 2004, 43, 4412–4456 CrossRef PubMed.
- X.-G. Li, X. G. Zhang and H.-P. Cheng, Nano Lett., 2014, 14, 4476–4479 CrossRef CAS PubMed.
- Y. Zhu, H. Qian and R. Jin, J. Mater. Chem., 2011, 21, 6793–6799 RSC.
- Y. Zhu, H. Qian, B. A. Drake and R. Jin, Angew. Chem., 2010, 122, 1317–1320 CrossRef.
- Y. Liu, H. Tsunoyama, T. Akita, S. Xie and T. Tsukuda, ACS Catal., 2011, 1, 2–6 CrossRef CAS.
- M. Haruta, S. Tsubota, T. Kobayashi, H. Kageyama, M. J. Genet and B. Delmon, J. Catal., 1993, 144, 175–192 CrossRef CAS.
- R. Meyer, C. Lemire, S. K. Shaikhutdinov and H.-J. Freund, Gold Bull., 2004, 37, 72–124 CrossRef CAS.
- R. H. Adnan, G. G. Andersson, M. I. J. Polson, G. F. Metha and V. B. Golovko, Catal. Sci. Technol., 2015, 5, 1323–1333 CAS.
- P. Rodríguez-Zamora, F. Yin and R. E. Palmer, J. Phys. Chem. A, 2014, 118, 8182–8187 CrossRef PubMed.
- C. C. Chusuei, X. Lai, K. A. Davis, E. K. Bowers, J. P. Fackler and D. W. Goodman, Langmuir, 2001, 17, 4113–4117 CrossRef CAS.
- A. Kolmakov and D. W. Goodman, Surf. Sci., 2001, 490, L597–L601 CrossRef CAS.
- N. Spiridis, J. Haber and J. Korecki, Vacuum, 2001, 63, 99–105 CrossRef CAS.
- X. Tong, L. Benz, P. Kemper, H. Metiu, M. T. Bowers and S. K. Buratto, JACS, 2005, 127, 13516–13518 CrossRef CAS PubMed.
- E. Wahlström, N. Lopez, R. Schaub, P. Thostrup, A. Rønnau, C. Africh, E. Lægsgaard, J. K. Nørskov and F. Besenbacher, Phys. Rev. Lett., 2003, 90, 026101 CrossRef PubMed.
- P. E. Batson, Microsc. Microanal., 2008, 14, 89–97 CrossRef CAS PubMed.
- Z. Y. Li, N. P. Young, M. Di Vece, S. Palomba, R. E. Palmer, A. L. Bleloch, B. C. Curley, R. L. Johnston, J. Jiang and J. Yuan, Nature, 2008, 451, 46–48 CrossRef CAS PubMed.
- S. Porsgaard, P. Jiang, F. Borondics, S. Wendt, Z. Liu, H. Bluhm, F. Besenbacher and M. Salmeron, Angew. Chem., Int. Ed., 2011, 50, 2266–2269 CrossRef CAS PubMed.
- M. Chen and D. W. Goodman, Chem. Soc. Rev., 2008, 37, 1860–1870 RSC.
- A. S. Wörz, U. Heiz, F. Cinquini and G. Pacchioni, J. Phys. Chem. B, 2005, 109, 18418–18426 CrossRef PubMed.
- U. Diebold, Surf. Sci. Rep., 2003, 48, 53–229 CrossRef CAS.
- A. Fujishima, X. Zhang and D. A. Tryk, Surf. Sci. Rep., 2008, 63, 515–582 CrossRef CAS.
- H.-J. Freund and G. Pacchioni, Chem. Soc. Rev., 2008, 37, 2224–2242 RSC.
- M. Osada and T. Sasaki, Adv. Mater., 2012, 24, 210–228 CrossRef CAS PubMed.
- X. Zhang, Y. Yang, W. Que and Y. Du, RSC Adv., 2016, 6, 81607–81613 RSC.
- N. Guo, R. Lu, S. Liu, G. W. Ho and C. Zhang, J. Phys. Chem. C, 2014, 118, 21038–21041 CAS.
- F. Wen, U. Englert, B. Gutrath and U. Simon, Eur. J. Inorg. Chem., 2008, 2008, 106–111 CrossRef.
- T. Sasaki, Y. Ebina, Y. Kitami, M. Watanabe and T. Oikawa, J. Phys. Chem. B, 2001, 105, 6116–6121 CrossRef CAS.
- T. Shibata, N. Sakai, K. Fukuda, Y. Ebina and T. Sasaki, PCCP, 2007, 9, 2413–2420 RSC.
- T. Sasaki, M. Watanabe, H. Hashizume, H. Yamada and H. Nakazawa, JACS, 1996, 118, 8329–8335 CrossRef CAS.
- T. Sasaki and M. Watanabe, JACS, 1998, 120, 4682–4689 CrossRef CAS.
- T. Sasaki, S. Nakano, S. Yamauchi and M. Watanabe, Chem. Mater., 1997, 9, 602–608 CrossRef CAS.
- T. Sasaki, Y. Ebina, K. Fukuda, T. Tanaka, M. Harada and M. Watanabe, Chem. Mater., 2002, 14, 3524–3530 CrossRef CAS.
- Y.-Y. Fong, B. R. Visser, J. R. Gascooke, B. C. C. Cowie, L. Thomsen, G. F. Metha, M. A. Buntine and H. H. Harris, Langmuir, 2011, 27, 8099–8104 CrossRef CAS PubMed.
- B. C. C. Cowie, A. Tadich and L. Thomsen, AIP Conf. Proc., 2010, 1234, 307–310 CrossRef.
- J. Söderlund, L. B. Kiss, G. A. Niklasson and C. G. Granqvist, Phys. Rev. Lett., 1998, 80, 2386–2388 CrossRef.
- C. G. Granqvist and R. A. Buhrman, J. Appl. Phys., 1976, 47, 2200–2219 CrossRef CAS.
- D. Susan-Resiga, V. Socoliuc, T. Boros, T. Borbáth, O. Marinica, A. Han and L. Vékás, J. Colloid Interface Sci., 2012, 373, 110–115 CrossRef CAS PubMed.
- C. Bosch-Navarro, Z. P. L. Laker, H. R. Thomas, A. J. Marsden, J. Sloan, N. R. Wilson and J. P. Rourke, Angew. Chem., Int. Ed., 2015, 5, 9560–9563 CrossRef PubMed.
- Y. Fukamori, M. König, B. Yoon, B. Wang, F. Esch, U. Heiz and U. Landman, ChemCatChem, 2013, 5, 3330–3341 CrossRef CAS.
- A. Y. Stakheev and L. M. Kustov, Appl. Catal., A, 1999, 188, 3–35 CrossRef CAS.
- M. Ohwada, K. Kimoto, T. Mizoguchi, Y. Ebina and T. Sasaki, Sci. Rep., 2013, 3, 2801 Search PubMed.
Footnote |
| † Electronic supplementary information (ESI) available. See DOI: 10.1039/c6ra21419c |
| This journal is © The Royal Society of Chemistry 2016 |

