Highly stable electrical manipulation of reflective colors in colloidal crystals of sulfate iron oxide particles in organic media

Hye-Young Leeab, Seung-Hyun Kimb, Hae-Nyung Leeab, Keum Hwan Parka, Young-Seok Kim*a and Gi-Ra Yi*b
aKorea Electronics Technology Institute, Seongnam, Gyeonggi 13509, Republic of Korea. E-mail: vis4freedom@keti.re.kr
bSchool of Chemical Engineering, Sungkyunkwan University, Suwon, Gyeonggi 16419, Republic of Korea. E-mail: yigira@skku.edu

Received 19th August 2016 , Accepted 14th October 2016

First published on 14th October 2016


Abstract

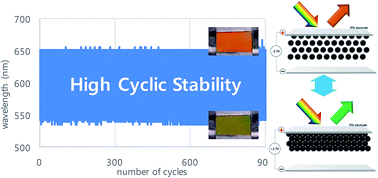
Monodisperse Fe3O4 particles are prepared by solvothermal reaction, in which negatively charged sulfate groups are formed on the surface by adding potassium sulfate during the high-pressure reaction. Then, those particles are successfully dispersed in the polar solvent propylene carbonate and manipulated electrophoretically between transparent electrodes. By applying an external electric field, they showed structural colors which can be tuned precisely over the visible range depending on the strength of the electric field. Because sulfate groups on the particle surface are chemically stable or inert, those particles are highly stable against irreversible deposition on the electrode during electrophoretic operation. Therefore, we demonstrate highly stable color switches over at least hundreds of cyclic operations, which may be useful in real electronic paper display applications.


1. Introduction

Photonic crystals, periodic dielectric structures in the light wavelength scale, can reflect light strongly over selective frequency ranges of light, called photonic bandgaps. In butterflies (Morpho peleides) and beetles (Lamprocyphus augustus), photonic crystal structures have been discovered which show blue or green iridescent colors, respectively.1,2 Surprisingly, Teyssier et al. discovered that chameleons use photonic crystal structures in their remarkable color-changing skins.3 Over the past decades, such bio-inspired photonic structures have been considered as potential candidates for highly efficient and low-cost color production in several applications including reflective displays in mobile devices, e-signage systems, sensors, anti-counterfeit systems or thermal protection. Moreover, several other unusual optical properties of photonic crystals including ‘slow’ photons, light extraction, light absorber for solar cells or negative refraction have also been explored for practical applications.4,5

At low salt concentrations, highly charged colloidal particles can form low density or soft colloidal crystals. When inter-particle distance is comparable to the wavelength of visible light, colloidal crystals show highly reflective colors in the certain range of wavelength which may be tuned by changing their periodicity or inter-particle distance under external electric or magnetic field. In case of aqueous suspension, salt or ion concentration can be removed by dialysis and tunable structural colors were demonstrated.6,7 However, due to electrochemical reaction at electrode or electrolysis, addressability of structural colors over hundreds of cycles is very limited particularly within only a few working voltage.8,9 Unlike water as medium, oil is intrinsically free of salt and inert for electrochemical reaction near electrode.10 Thereby, if charged particles are dispersed in oil, they can form crystals even at low concentration, which can be tuned under external electric field. Recently, uniform magnetite nanoparticles with silica shell were prepared and form colloidal photonic crystals at low concentration under either magnetic11 or electric field.12 Similarly, silica particles with titania shells were dispersed in oil phase were used to show tunable structural color under external electric field.13,14 More recently, carbon-coated core–shell magnetite particles (<200 nm) are prepared using ferrocene as precursors by solvothermal process,15–17 in which carboxyl groups are formed on the particle surface and formed soft colloidal crystals in oil. Spectral absorption of carbon over visible range eliminates multiple light scattering, thus increases color purity of display which requires black background. Unfortunately, however, under electric field, those particles are not stable enough to avoid irreversible adsorption on wall or aggregation each other. Therefore, it is still challenging to keep particles in oil near wall when they were concentrated under external electric field. Enhancement of cyclic stability is of great importance to develop electrophoretic color display based on colloidal photonic structure. Here, we report robust and highly effective method for decorating charged functional groups on the particle surface and demonstrate reversible structural transition of charged particles under external electro field with long term cyclic stability.

2. Experimental

2.1 Materials

Ferrocene (98%, Sigma Aldrich), hydrogen peroxide (30%, Sigma Aldrich), acetone (≥99.5%, Sigma Aldrich), potassium persulfate (95%, SAMCHUN), propylene carbonate (anhydrous, 99.7%, Sigma Aldrich).

2.2 Synthesis of sulfate Fe3O4@C NPs

Ferrocene (0.3 g) was dissolved in acetone (30 mL). After sonication for 1 h, potassium persulfate (5 mol% of ferrocene) and hydrogen peroxide (0.75 mL) were slowly added to the solution using syringe pump (0.1 mL min−1) under vigorously stirred for 1 h with mechanical stirring. And then, the mixture solution was transferred to the stainless autoclave and heated at 240 °C for 24 h. After that, the autoclave was naturally cooled to room temperature. The products were washed with ethanol and then dried at 60 °C.

2.3 Device fabrication

The display test cell consists of two ITO-coated glass electrodes separated by 60 μm, 100 μm surlyn film (Meltonix 1170-100) spacers. Sulfate Fe3O4@C suspension (10–20 wt% in propylene carbonate) was injected into gap between those electrodes.

2.4 Characterization

Surface charge was measured using Zetasizer Nano ZS90 from Malvern. High-resolution transmission electron microscopy (HRTEM) images were taken on JEM-2100F from JEOL. Field emission scanning electron microscopy (FE-SEM) images were performed on S-4300 from HITACHI. The FT-IR spectrum was obtained using a FTIR spectrophotometer (IRAffinity-1S, Shimadzu) in the range of 500–4000 cm−1. The reflective spectra were achieved using spectrophotometer (CM-3600A) from CONICA MINOLTA in the range of 380–760 cm−1.

3. Results & discussion

In solvothermal reaction, iron salt or iron–organic complex can be decomposed and oxidized into iron oxide (magnetite) nanoparticles, which are clustered into submicrometer-sized particles.15,18 In case that ferrocene is used as precursors, carbon shell forms around magnetite cores which covers color of magnetic cores (brown or red) and shows grey color because of absorption of broad visible light. Therefore, the purity of reflective color from colloidal crystals can be improved which is critical for practical application. For further surface modification, we may add adjuvant for surface charge group in solvothermal reactor.

For instance, potassium persulfate is decomposed, which produce surface group on core–shell particles as shown in the schematic diagram of Fig. 1a. In ferrocene decomposition step at 240 °C, iron atoms firstly were oxidized into magnetite under the assistance of hydrogen peroxide. With an increase of concentration of magnetite, the small nuclei under supersaturated solution aggregate into larger secondary clusters. Then the carbon shell with conjugated double bonds can be adsorbed on the surface of magnetite particles having persulfate group from potassium persulfate. Since sulfate group can be attached at any hydrocarbon chain, we speculate that hairy sulfate-functional hydrocarbon chains may be formed at surface which provide steric hindrance and electrostatic repulsion between particles. The scanning or transmission electron micrographs in Fig. 1b and c show the morphology or internal structure of sulfate Fe3O4@C nanoparticles, which confirmed that their size are fairly uniform around 110 nm and 130 nm within 10% of distribution (Fig. 1) but apparently their surfaces in both cases are not smooth. X-ray diffraction pattern corresponds to ring pattern of Fe3O4 in the core (Fig. S1). In the Fourier-transformed infrared spectroscopy (FTIR) of Fig. 1, the peaks of 1566 cm−1 and 1408 cm−1 seem like the C[double bond, length as m-dash]O and C–O–H bonding, respectively and the peak of 1100 cm−1 is Fe–O. Therefore, carboxyl and sulfate groups were formed on Fe3O4@C NPs. Zeta-potential and electrophoretic mobility were measured using Laser Doppler micro-electrophoresis (Zetasizer Nano NS, Malvern Instruments) as shown in Fig. 1e. At low voltage up to 15 kV m−1, zeta-potential of sulfate Fe3O4@C nanoparticles is approximately −50 mV but increases up to – 10 mV at 30 kV m−1 in propylene carbonate. Similar electrokinetic behavior was observed for nonpolar dispersion of PMMA particles with surfactants, in which electrophoretic mobility and apparent zeta-potential were dependent of applied electric field strength in nonlinear fashion.19


image file: c6ra20849e-f1.tif
Fig. 1 (a) Schematic diagram of carbon-coated iron oxide nanoparticles with sulfate group by solvothermal reaction. (b and c) SEM images of sulfate Fe3O4@C nanoparticles. (d) FT-IR spectrum of sulfate Fe3O4@C nanoparticles. (e) Electrophoretic mobility and apparent zeta potential of sulfate Fe3O4@C in propylene carbonate as a function of applied field strength.

Due to such nonlinear change of zeta-potential, it may not be possible to control the structure of colloidal crystals in linear fashion over 15 kV m−1 or 1.5 V with 100 μm thickness gap. As electric field increase, zeta-potential decreased much rapidly. Therefore, electrophoretic force (∝ζE) would decreased as electric field increases. However, interestingly, repulsive force (∝ζ2) between particles gets also weaker as electric field increase.20 Therefore, we speculate that particles may be packed more at higher electric field mainly due to weaker repulsive force between particles. Notably, even at 30 kV m−1, ζ-potential does not cross over zero of zeta-potential but kept under – 10 mV, which kept particles stable under external electric field.

As shown in schematic diagram of Fig. 2a, colloidal structures can be controlled depending on electric field strength. As shown in Fig. 2b, reflection color from 18 wt% of sulfate carbon-coated iron oxide nanoparticle suspension in propylene carbonate is changed from red to blue colors as electrical potential difference increases from 0 V to 3 V. Accordingly, reflectance spectra in Fig. 2c shows maximum peaks (λmax) at 600 nm, 550 and 450 nm for 1.7, 2.2, and 2.6 V, respectively. When concentration of particles in the cell is changed to 19 wt% as shown in Fig. S2, reflection color is shifted to shorter wavelength over all electric field.


image file: c6ra20849e-f2.tif
Fig. 2 (a) Schematic illustration of the formation of soft colloidal crystals and controlling inter-particle distance under external electric field. (b) Color images of colloidal suspension (18 wt%) under various applied voltages ranging from 0 to 3 V and (c) reflectance peaks of colloidal crystals at 1.7, 2.2, and 2.6 V of applied voltages.

By applying constant external electric field (=27 kV m−1), sulfate Fe3O4@C particles exhibits steady reflection peak of wavelength (Fig. 3a, Movie S1), in which electrophoretic force and electrostatic repulsions are balanced. By contrast, carboxylate Fe3O4@C particles, which have developed in previous report,15–17 shows significant change of reflection color from green to orange, which correspond to increase of maximum reflection peaks from 550 to 700 nm (black line of Fig. 3a and Movie S2). We have also checked cyclic stability in tuning reflective color in our device, in which electric potential difference between 2.7 and −2.7 V at 1 Hz have cycled hundreds of times. By balancing electrophoretic force and electrostatic repulsion, inter-particle distance of soft colloidal crystals could be modulated consistently under cyclic electric field (Fig. 3b). As shown in Fig. 3c and Movie S3 in ESI, peaks (λmax) and intensity are kept within less than 5% difference.


image file: c6ra20849e-f3.tif
Fig. 3 Stability of structural color under static or cyclic external electric fields. (a) Maximum peak of reflection spectrum from sulfate and carboxylate Fe3O4@C suspensions under electric potential difference at 2.7 V as a function of time for 10 min. Inset images show corresponding color images. (b) The schematic illustration of the formation of soft colloidal crystals and controlling inter-particle distance under cyclic electric field. Reflection peak positions of (c) sulfate and (d) carboxylate Fe3O4@C particles under cyclic electric field as a function of number of cycles. The insets indicate photographs of structural color corresponding to wavelength of visible range. Graphs on the right indicate number of specific reflective wavelength as switching cycles of 450 times under external electric field.

It is interesting that reflection color is slightly different for initial or second cycles. Before operation, particles are not organized or distributed randomly and they are then moved toward positive electrode at first electrophoretic operation. At OFF state, they are released slowly, in which particle positions are disordered but not completely random. Therefore, we have seen consistent reflective colors after second operation or a few cycles. In Fig. S3a, sulfate iron oxide nanoparticles showed stable uniform reflective colors over whole area while carboxylate iron oxide particles showed non-uniform and unstable reflective colors. Carboxylate carbon-coated iron oxide nanoparticle suspension shows color change from orange to green responding to applied voltage at first cycle, which are iridescent as shown in Fig. S3b. However, as shown in Fig. 3d and S3, their peak position was not very stable but kept changed up to 500 cycles and then peaks become stable in different positions over shorter range of wavelength in which particles were deposited irreversibly on the wall.

We have looked into more behavior of carboxylate and sulfate particles under cyclic electric field. For this observation, new electrophoretic cells are prepared with thin ITO-sputtered cover slip (0.17 mm). As shown in schematic diagram of Fig. 4a, during cyclic voltage change, sulfate particles are assembled on and released from electrode without any residue of particles on substrate. By contrast, carboxylate particles may be adhered on electrode and then stuck, which is irreversible adsorption. We speculate that carboxyl group may form permanent bonding as reported in previous work.21 Since particle size is too small to observe under optical microscope, we observe particles near electrode from the top view as shown in Fig. 4b and c, which confirmed that sulfate particles are manipulated in reversible manner without deposition on electrode in cyclic operation while carboxylate parties are deposited irreversibly. Once particles are deposited, effective electric field will be reduced inside cells, which may bring particles back to disordered state resulting in unstable structural color in static or dynamic electric field.


image file: c6ra20849e-f4.tif
Fig. 4 Optical micrographs of Fe3O4@C nanoparticles (130 nm) during operation of electric field. (a) Schematic illustration of the formation of soft colloidal crystals during cyclic voltage change from 0 V to 4 V. (b) Sulfate particles are not adsorbed on the wall during cyclic voltage operation (0–4 V). (c) Carboxylate particles were stuck on the wall, which may be caused by chemical bonding between carboxylic group and hydroxyl group on the wall.

Finally, we have applied patterned electrode on our sulfate Fe3O4@C nanoparticles as shown in Fig. 5 and movie clips in ESI. As shown in Fig. 5a, reflection colors on patterned area could be controlled by changing electric field strength only, which displayed letters and were also repeated in cyclic electric field (Movie S4 in ESI). Furthermore, ‘KE’ and ‘TI’ of letters are applied to independently different external voltages as in Fig. 5b. Reflection colors in letters is changed to light green or dark blue when voltage was also controlled independently from 2.8 V to −2.8 V or −3.5 V to 3.5 V at 1 Hz, respectively, in which 20% of 130 nm sulfate Fe3O4@C nanoparticles were dispersed in propylene carbonate (Movie S5 in ESI).


image file: c6ra20849e-f5.tif
Fig. 5 Snapshot images of passive reflective display of sulfate iron oxide suspensions on patterned electrode under controlled external electric field. Gap between electrodes is 60 μm. (a) ‘KETI’ letters are changed from yellow green to dark blue colors by controlling amplitude of cyclic external electric strength. (b) Schematic illustration of the formation of soft colloidal crystals and controlling inter-particle distance by independently different external electric field. (c) ‘KE’ and ‘TI’ of letters are changed to light green and dark blue colors by changing voltages as 2.8 V and 3.5 V for yellow green and dark blue, respectively.

4. Conclusions

In summary, sulfate Fe3O4@C core–shell nanoparticles are prepared by modified solvothermal method with potassium persulfate which are then dispersed in propylene carbonate. Their structures are controlled from random structure and ordered structure, in which electrophoretic force and electrostatic repulsion are balanced inside electrophoretic cells. Depending on the strength of applied voltage, structural colors can be tuned precisely over visible range. Unlike previous carboxylate or other particles, those particles are highly stable without deposition onto the electrode during electrophoretic operation due to inert sulfate functional surface groups. Therefore, particle motion is reversible and reflection color are highly stable over hundreds of cyclic operations.

Acknowledgements

We would like to thank Dr Jin-Gyu Park for reading manuscript carefully and helpful comments. This work was supported by the National Research Foundation of Korea (NRF) (NRF-2010-0029409 and NRF-2014S1A2A2028608) and the Ministry of Trade, Industry & Energy of Korea (N0001231).

References

  1. R. A. Potyrailo, H. Ghiradella, A. Vertiatchikh, K. Dovidenko, J. R. Cournoyer and E. Olson, Nat. Photonics, 2007, 1, 123–128 CrossRef CAS.
  2. J. W. Galusha, L. R. Richey, J. S. Gardner, J. N. Cha and M. H. Bartl, Phys. Rev. E: Stat., Nonlinear, Soft Matter Phys., 2008, 77, 050904R CrossRef PubMed.
  3. J. Teyssier, S. V. Saenko, D. van der Marel and M. C. Milinkovitch, Nat. Commun., 2015, 6, 6368 CrossRef CAS PubMed.
  4. S.-H. Kim, S. Y. Lee, S.-M. Yang and G.-R. Yi, NPG Asia Mater., 2011, 3, 25–33 CrossRef CAS.
  5. G. von Freymann, V. Kitaev, B. V. Lotschz and G. A. Ozin, Chem. Soc. Rev., 2013, 42, 2528 RSC.
  6. T. S. Shim, S.-H. Kim, J. Y. Sim, J.-M. Lim and S.-M. Yang, Adv. Mater., 2010, 22, 4494 CrossRef CAS PubMed.
  7. M. G. Han, C.-J. Heo, C. G. Shin, H. Shim, J. W. Kim, Y. W. Jin and S. Lee, J. Mater. Chem. C, 2013, 1, 5791 RSC.
  8. H. S. Shim, C. G. Shin, C.-J. Heo, S.-J. Jeon, H. Jin, J. W. Kim, Y. W. Jin, S. Y. Lee, J. Lim, M. G. Han and J.-K. Lee, Appl. Phys. Lett., 2014, 104, 051104 CrossRef.
  9. M. G. Han, C.-J. Heo, H. Shim, C. G. Shin, S.-J. Lim, J. W. Kim, Y. W. Jin and S. Lee, Adv. Opt. Mater., 2014, 2, 535 CrossRef CAS.
  10. R. Sanchez and P. Bartlett, Soft Matter, 2011, 7, 887 RSC.
  11. J. Ge and Y. Yin, Adv. Mater., 2008, 20, 3485 CrossRef CAS.
  12. I. Lee, D. Kim, J. Kal, H. Baek, D. Kwak, D. Go, E. Kim, C. Kang, J. Chung, Y. Jang, S. Ji, J. Joo and Y. Kang, Adv. Mater., 2010, 22, 4973 CrossRef CAS PubMed.
  13. X. Qiao, Y. Luo, A. Sun, C. Wang, J. Zhang, C. Chu, J. Guo and G. Xu, RSC Adv., 2015, 5, 6489 RSC.
  14. Y. Luo, J. Zhang, A. Sun, C. Chu, S. Zhou, J. Guo, T. Chen and G. Xu, J. Mater. Chem. C, 2014, 2, 1990 RSC.
  15. H. Wang, Y.-B. Sun, Q.-W. Chen, Y.-F. Yua and K. Chenga, Dalton Trans., 2010, 39, 9565 RSC.
  16. X. Qiao, A. Sun, C. Wang, C. Chu, S. Ma, X. Tang, J. Guo and G. Xu, Colloids Surf., A, 2016, 498, 74 CrossRef CAS.
  17. J. Zhang, C. Chu, A. Sun, S. Ma, X. Qiao, C. Wang, J. Guo, Z. Li and G. Xu, J. Alloys Compd., 2016, 654, 251 CrossRef CAS.
  18. J. Ge, Y. Hu and Y. Yin, Angew. Chem., Int. Ed., 2007, 46, 7428 CrossRef CAS PubMed.
  19. C. E. Espinosa, Q. Guo, V. Singh and S. H. Behrens, Langmuir, 2010, 26, 16941 CrossRef CAS PubMed.
  20. J. H. Masliyah and S. Bhattacharjee, Electrokinetic and Colloidal Transport Phenomena, John Wiley & Sons, Hoboken, 2006 Search PubMed.
  21. A. K. Havare, M. Can, S. Demic, S. Okur, M. Kus, H. Aydın, N. Yagmurcukardes and S. Tari, Synth. Met., 2011, 161, 2397 CrossRef CAS.

Footnote

Electronic supplementary information (ESI) available: XRD of sulfate iron oxide particles, reflective color of suspension of sulfate and carboxylate iron oxide nanoparticles under external electric field. Passive reflective display of sulfate iron oxide suspensions on patterned electrode under controlled external electric field (Movies S1–5). See DOI: 10.1039/c6ra20849e

This journal is © The Royal Society of Chemistry 2016
Click here to see how this site uses Cookies. View our privacy policy here.