
Turn-on fluorescence detection of ciprofloxacin in tablets based on lanthanide coordination polymer nanoparticles†
Baoxia Liua,
Yankai Huangab,
Qi Shenb,
Xu Zhua,
Yuanqiang Haoa,
Peng Qu*ab and
Maotian Xu*ab
aHenan Key Laboratory of Biomolecular Recognition and Sensing, College of Chemistry and Chemical Engineering, Shangqiu Normal University, Shangqiu 476000, China. E-mail: qupeng0212@163.com; xumaotian@sqnc.edu.cn; Fax: +86 370 2586802; Tel: +86 370 2586802
bCollege of Chemistry and Molecular Engineering, Zhengzhou University, Zhengzhou 450001, China
First published on 26th September 2016
Abstract
Metal–organic coordination polymers (MOCPs) have emerged as a new family of functional nanomaterials. Here, we report a facile and effective fluorescence method for detecting CIP in tablets using a kind of lanthanide coordination polymer nanoparticle (LCPNP), specifically Eu/GMP NPs, as the sensing platform. Eu/GMP NPs, composed of guanosine monophosphate (GMP) and europium (Eu3+) ion, are by themselves non-luminescent. The addition of ciprofloxacin (CIP) into the Eu/GMP NPs, however, noticeably enhanced their fluorescence due to the strong coordination interaction between CIP and Eu3+, and the improved hydrophobic interior of the LCPNPs resulted in an efficient energy transfer from CIP to Eu3+. The fluorescence intensity of Eu/GMP at 615 nm showed a linear relationship with CIP concentration between 1.0 and 40 μM, with a detection limit of 780 nM. We believe that the proposed time-resolved fluorometric assay based on the Eu/GMP NP lanthanide nanosensor, with its long fluorescence lifetime, has a great potential for using in the testing of biosamples.
Introduction
Ciprofloxacin (CIP) is a synthetic antimicrobial agent and a fluorinated quinolone gyrase inhibitor. CIP has been widely applied as a bactericide by inhibiting DNA replication or interfering with the enzymatic activity of topoisomerase IV.1 Furthermore, as a broad spectrum antisepsis medicine, CIP displays high curative effects for many other diseases such as complicated urinary tract infections,2 cell carcinoma,3 lung infections,4 and cystic fibrosis.5 Due to effective sterilization, a large amount of ciprofloxacin has been applied in hospitals. However, uptake of excessive ciprofloxacin has immediate adverse effects on human beings including gastrointestinal complaints (nausea, diarrhea, dyspepsia), disorders of the central nervous system (headaches, nervousness/restlessness, dizziness, tremors, hyposmia),3 skin photosensitivity reactions and eosinophilia.6 Most alarmingly, ciprofloxacin can also induce acute/severe liver damage/liver injury.7 Therefore, a highly sensitive analytical method to accurately and effectively determine the concentration of this compound in tablets is urgently needed. So far, many analytical technologies for determining the amount of CIP residue in tablets have been reported. However, most of them relied on liquid chromatography (LC)8 mass spectrometry (MS),9 or enzyme-linked immunosorbent assay (ELISA).10 These methods either require expensive instruments/reagents or are time-consuming. Lanthanide-based time-resolved fluorescence assays for CIP in tablets are highly desirable because they offer the advantages of high sensitivity, easy preparation methods, and high anti-interference abilities in complicated media.Metal–organic coordination polymers (MOCPs), i.e., infinite coordination polymers (CPs)11 or metal–organic frameworks (MOFs)12 formed from metal ions and organic ligands, have emerged as a class of fascinating hybrid materials and have been the focus of many scientific investigations. Owing to their very large surface areas, tunable pore sizes, high thermal stability, as well as tempting magnetic, electrical, optical, and catalytic properties,13 MOCPs have attracted considerable attention and have shown potential in applications such as heterogeneous catalysis,14 gas storage,15 imaging,16 sensing17 and drug delivery/release.16,18 Among MOCPs, lanthanide coordination polymers (LCPs) built from the association of lanthanide ions and bridging organic ligands have attracted much attention due to their unique optical and magnetic properties arising from their 4f electron structure.19 In addition, MOCPs provide an interesting platform for assembling and modulating lanthanide ions and organic ligands in a solid framework to yield excellent performances.20 In particular, compared with molecular lanthanide compounds, LCPs show advantages including superior mechanical properties, better processability, and greater thermal stability.20 These advantages make them fascinating for the construction of optical devices and tunable luminescent sensors as well as probes for biological and chemical species.21
Yet, the design and development of LCPs at the nanoscale have received little attention.
Here, we reported on designing an LCP nanoparticle (LCPNP) probe for turning on the fluorescence detection of CIP in tablets. The LCPNPs consisted of guanosine monophosphate (GMP) as a bridging ligand and Eu3+ as a metal node, and are denoted as Eu/GMP NPs. Eu/GMP NPs displayed weak fluorescence due to the deactivation of their excited states through the O–H vibrational modes of coordinated water molecules.22 As a derivative of 4-quinolone-3-carboxylic acid, CIP can displace the bound water molecules to coordinate the Eu3+ through its carboxylate and carbonyl, and sensitize the emission of Eu3+ via an intramolecular energy transfer process.23 With the addition of CIP, the Eu/GMP NPs produced a strong fluorescence (Scheme 1), as we expected.
 | ||
| Scheme 1 Structure of GMP and CIP (a), and a schematic illustration of the mechanism for turning on the fluorescence detection of CIP (b). | ||
Results and discussion
The morphology of Eu/GMP NPs was examined by using scanning electron microscopy (SEM). As shown in Fig. 1a, Eu/GMP NPs formed one species of nano-granules with an irregular surface. The X-ray diffraction (XRD) analysis confirmed that they were amorphous (Fig. S1a†). After the incorporation of CIP, the Eu/GMP NPs maintained their original appearance on the nanoscale, except that they became bigger (Fig. 1), due to the coordination CIP with Eu3+. Moreover, the XRD analysis did not indicate any change in the crystal pattern of the Eu/GMP NPs when CIP was added (Fig. S1†). The chemical compositions of the NPS were analyzed by using energy-dispersive X-ray spectrometry (EDX). As shown in Fig. S2,† EDX peaks corresponding to Eu, C, N, O, F and P were observed, indicating the presence of Eu3+, GMP and CIP in the LCPNPs of the Eu/GMP-CIP NPs. | ||
| Fig. 1 SEM images of Eu/GMP NPs in the absence (a) and presence (b) of CIP. | ||
As shown in Fig. 2, the Eu/GMP NPs by themselves exhibited weak fluorescence, which we attributed to the O–H stretching vibration of the water molecules coordinating the Eu3+. With the addition of CIP, however, the fluorescence of Eu/GMP NPs was enhanced significantly, to a level approximately 11.5-fold higher than that of the Eu/GMP NPs alone. The formed Eu/GMP-CIP NPs exhibited an excitation peak at a wavelength of 276 nm and emission peaks at 579, 590, 615, 650 and 695 nm. These peaks can be assigned to the 5D0 to 7FJ electronic transitions of Eu3+.24
 | ||
| Fig. 2 Excitation (left: a and c) and emission (right: b and d) spectra of an Eu/GMP NP suspension and Eu/GMP NPs in the presence of CIP in HEPES buffer (10 mM, pH 7.4). (The inset is the corresponding fluorescence of these samples under a UV lamp.) | ||
Furthermore, as shown in Fig. S3,† the fluorescence intensity of Eu/CIP in ethanol was much higher than that in aqueous solutions. We attributed the emission of Eu/GMP-CIP NPs to an intramolecular energy transfer from CIP to Eu3+ and the enhanced fluorescence to the hydrophobic environment of the interior of the LCPNPs. It is also noteworthy that blue fluorescence of CIP was not observed under the time-resolved fluorescence mode, which is beneficial for using Eu/GMP NPs as a fluorescence probe for the detection of CIP in biological samples (Fig. 2 and S4†).
To confirm the chemical coordination between the Eu/GMP NPs and CIP, we acquired Fourier transform infrared spectra (FTIR) of GMP, CIP and Eu/GMP in the absence and presence of CIP, as shown in Fig. S5.† These peaks at 1675, 1626, and 978 cm−1 observed in the spectrum of pure GMP were assigned to C5![[double bond, length as m-dash]](https://www.rsc.org/images/entities/char_e001.gif) O, N7–C8 and PO43− P–O stretching bands. These peaks shifted to 1689, 1637, 989 cm−1, respectively, in the spectrum of Eu/GMP NPs, suggesting that both the guanine moieties and phosphate groups of GMP coordinated to Eu3+.25 A new peak was found at 1631 cm−1 in the spectrum of Eu/GMP-CIP, and was assigned to a COO− asymmetric stretching vibration of CIP, indicating the coordination of CIP with Eu/GMP NPs (Fig. S5†). In addition, the COO− symmetric stretching vibration peak of CIP at 1384 cm−1 disappeared, and the CIP COO− asymmetric stretching vibration (from 1475 to 1499 cm−1) and CO stretching vibration (from 1626 to 1684 cm−1) peaks were observed to shift. These changes in the FTIR peaks corresponding to CIP resulted from the coordination of CIP to Eu3+ in Eu/GMP NPs via the carboxylic acid and ketone groups of the CIP.26
O, N7–C8 and PO43− P–O stretching bands. These peaks shifted to 1689, 1637, 989 cm−1, respectively, in the spectrum of Eu/GMP NPs, suggesting that both the guanine moieties and phosphate groups of GMP coordinated to Eu3+.25 A new peak was found at 1631 cm−1 in the spectrum of Eu/GMP-CIP, and was assigned to a COO− asymmetric stretching vibration of CIP, indicating the coordination of CIP with Eu/GMP NPs (Fig. S5†). In addition, the COO− symmetric stretching vibration peak of CIP at 1384 cm−1 disappeared, and the CIP COO− asymmetric stretching vibration (from 1475 to 1499 cm−1) and CO stretching vibration (from 1626 to 1684 cm−1) peaks were observed to shift. These changes in the FTIR peaks corresponding to CIP resulted from the coordination of CIP to Eu3+ in Eu/GMP NPs via the carboxylic acid and ketone groups of the CIP.26
The UV absorption spectra of CIP, GMP, Eu/GMP NPs, Eu/CIP, and Eu/GMP in the presence of CIP were also measured. As shown in Fig. S6,† the characteristic absorption peak of GMP was observed at a wavelength of 260 nm and the free CIP exhibited two maximum absorption peaks, at 270 and 330 nm.22 When the CIP was added to the Eu/GMP NP suspension, however, the absorption peak of CIP at 270 nm was red-shifted to 276 nm and the peak at 330 nm was blue-shifted to 325 nm. These changes in the CIP absorption peaks further supported the chemical coordination between CIP and Eu3+ in Eu/GMP NPs. The absorbance peak observed at 276 nm for Eu/GMP NPs containing CIP was distinctively more intense than any of the peaks in the spectrum of Eu/GMP NPs without CIP. The strong absorption in the UV range for Eu/GMP NPs containing CIP could cause an efficient energy transfer from CIP to the emissive 5D0 state of Eu3+ and sensitize the luminescence of Eu3+ ion effectively.
To gain more insight into the interaction of CIP with Eu/GMP NPs, we investigated the emission lifetimes of Eu/GMP NPs and Eu/GMP-CIP NPs. As shown in Fig. S7,† the luminescence lifetime of Eu/GMP-CIP was observed to be 0.85 μs, and was longer than that observed for Eu/GMP NPs. The longer lifetime indicated a higher fluorescence quantum yield and more stable structure for Eu/GMP-CIP, whose fluorescence was apparently quenched by water molecules to a lesser degree due to its inner hydrophobic environment. This result further confirmed that CIP efficiently removed the water molecules from the coordination sphere of Eu3+ and resulted in the formation of highly fluorescent Eu/GMP-CIP NPs.
To optimize the conditions for detecting CIP, the effect of pH value on the fluorescence intensity of the Eu/GMP NPs in the presence of CIP was investigated, as shown in Fig. S8.† When the pH value was increased up to a value of 7.4, the intensity of the fluorescence was observed to increase, which can be explained by the increase in pH having caused an increase in the amount of unprotonated CIP, which would favor the formation of Eu/GMP-CIP NPs. However, when the pH was increased above 7.4, the fluorescence intensity of Eu/GMP-CIP decreased, which may have been due to the precipitation of europium hydroxide under the alkaline conditions. In addition, the fluorescence intensity reached a maximum value in 15 min (Fig. S9†), indicating the reaction of CIP with Eu3+ to be rapid.
To quantitatively analyze CIP using Eu/GMP NPs as a fluorescent probe, the fluorescence of the Eu/GMP NPs in the presence of CIP at various concentrations, in aqueous solutions, were measured under optimal conditions. As shown in Fig. 3, the fluorescence intensity of Eu/GMP was observed to increase as the concentration of CIP was increased. A highly linear relationship between the fluorescence intensity of Eu/GMP and the concentration of CIP was observed in the range of 1.0–40 μM; and the detection limit was determined to be about 780 nM on the basis of a signal-to-noise ratio of 3![[thin space (1/6-em)]](https://www.rsc.org/images/entities/char_2009.gif) :1.
:1.
 | ||
| Fig. 3 Eu/GMP NP probe for sensing CIP between concentrations of 1.0 and 40 μM in HEPES buffer solutions (pH 7.4). Inset shows the linear relationship between the fluorescence intensity of the Eu/GMP NPs at a wavelength of 615 nm and the concentration of CIP. | ||
Since tablets often consist of many complex ingredients, high analytical performances, including high sensitivity and selectivity, are required of methods aimed at detecting a specific component in such tablets. Due to the observed long-duration fluorescence of LCPNPs and the ability of CIP to turn on the fluorescence of Eu/GMP NPs, we applied the current assay to the detection of CIP in tablets. Different kinds of species including metal ions (Na+, K+, Ca2+, Mg2+), anions (NO3− and Cl−), ascorbic acid (AA), glucose, lactose, fructose, sucrose, starch, dextrin, and mannitol that may possibly interfere with the CIP sensing were tested to observe their influences on the fluorescence intensity of Eu/GMP NPs. As shown in Fig. 4, only CIP caused an obvious enhancement in the fluorescence of Eu/GMP NPs, whereas the presence of other substances had no influence on the fluorescence of the Eu/GMP NPs.
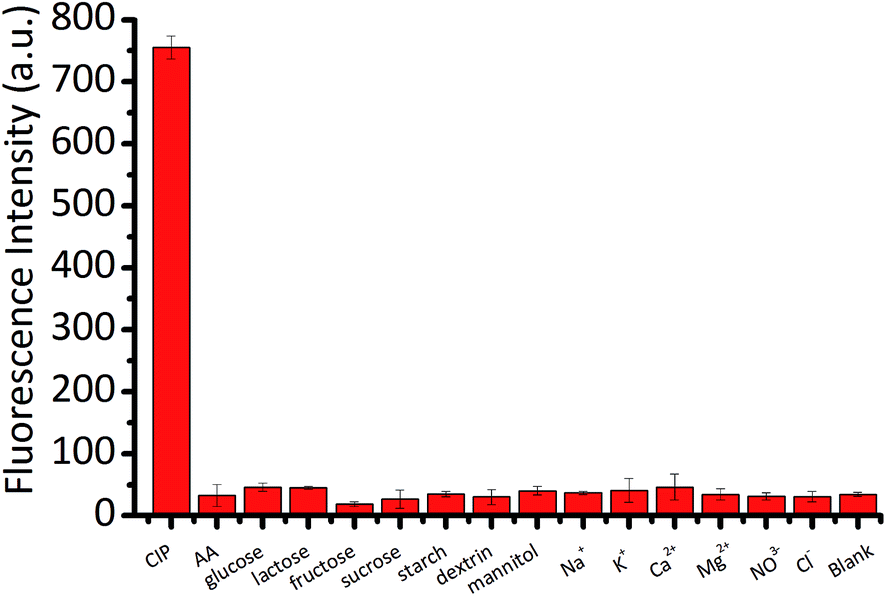 | ||
| Fig. 4 Influence of various interfering agents (20 μM) on the fluorescence intensity of Eu/GMP NPs in HEPES (pH 7.4). | ||
To investigate the practical application of this method, we measured the levels of CIP in tablet samples. As the tablet powders with known amounts of CIP were dissolved in water, the as-prepared solution was filtered. The diluted filtrates were then analyzed by using the Eu/GMP NPs with a standard addition method. As shown in Table 1, the recoveries of CIP in the tablet samples were between 97.03 and 104.89%. The relative standard deviations (RSD, n = 3) are all in normal level. The results indicated that the detection of CIP in tablets by using Eu/GMP NPs as a fluorescent probe showed good recovery and the CIP concentration was determined with high precision.
| Samples | Spiked (μM) | Detected (μM) | Recovery (%) | RSD (n = 3, %) |
|---|---|---|---|---|
| 1 | 0 | 1.47 | — | — |
| 2 | 3 | 4.61 | 104.66 | 1.19 |
| 3 | 10 | 11.96 | 104.89 | 2.26 |
| 4 | 30 | 30.58 | 97.03 | 0.66 |
Conclusion
In summary, we developed a novel strategy for the direct, selective, and sensitive detection of CIP in tablets based on a “turn-on” fluorescent sensor. Compared to the previously reported luminescence probes for CIP, the new probe exhibits distinct advantages, such as a simple preparation procedure, fast response time, high selectivity and sensitivity, and a response with long-lived luminescence signals. These desirable features favor its use in the background-free time-gated luminescence detection of CIP in a complicated tablet.Experimental
Materials and methods
000 rpm for 10 min. The precipitate was washed with ultrapure water several times to remove unreacted reactants. Finally, the obtained Eu/GMP NPs were dispersed in 4.0 mL of a HEPES buffer solution to form an Eu/GMP NP suspension.Acknowledgements
This work was supported by the National Natural Science Foundation of China (Grant nos. 21405103, 21575131, 21305085, U1404215, 21475085 and 21475084), Foundation for Key Scientific and Technological Project of Henan Province (142102210583), Yong Key Teacher Foundation of Shangqiu Normal University (2014GGJS17), and Innovation Scientists and Technicians Troop Construction Projects of Henan Province (No. 41).Notes and references
- M. H. C. H. Scholz and M. U. Schwabe, Taschenbuch der Arzneibehandlung, Springer, Berlin Heidelberg, 2005 Search PubMed
.
- D. A. Talan, K. G. Naber, J. Palou and D. Elkharrat, Int. J. Antimicrob. Agents, 2004, 23, 54–66 CrossRef PubMed
- P. C. Sharma, A. Jain, S. Jain, R. Pahwa, M. S. Yar and J. Enzyme Inhib, Med. Chem., 2010, 25, 577–589 CAS
- D. Cipolla, J. Blanchard and I. Gonda, Pharmaceutics, 2016, 8, 1–31 CrossRef PubMed
- M. Buck, Pediatric Pharmacotherapy, 1998, vol. 4, p. 12 Search PubMed
- R. Mosges, M. Nematian-Samani and A. Eichel, Ther. Clin. Risk Manage., 2011, 7, 325–336 CrossRef CAS PubMed
- A. Zimpfer, A. Propst, G. Mikuz, W. Vogel, L. Terracciano and S. Stadlmann, Virchows Archiv, 2004, vol. 444, pp. 87–89 Search PubMed
- S. Bailac, D. Barron, V. Sanz-Nebot and J. Barbosa, J. Sep. Sci., 2006, 29, 131–136 CrossRef CAS PubMed
- G. Stubbings and T. Bigwood, Anal. Chim. Acta, 2009, 637, 68–78 CrossRef CAS PubMed
- Z. Yuan, J. Duan, S. Fan and K. Kong, Food Agric. Immunol., 2010, 13, 199–204 CrossRef
- A. M. Spokoyny, D. Kim, A. Sumrein and C. A. Mirkin, Chem. Soc. Rev., 2009, 38, 1218–1227 RSC
- A. Schneemann, V. Bon, I. Schwedler, I. Senkovska, S. Kaskel and R. A. Fischer, Chem. Soc. Rev., 2014, 43, 6062–6096 RSC
- B. Li and B. Chen, Porous Lanthanide Metal-Organic Frameworks for Gas Storage and Separation, in Lanthanide Metal-Organic Frameworks, 2015, vol. 163, pp. 75–107 Search PubMed
- B. Gole, U. Sanyal, R. Banerjee and P. S. Mukherjee, Inorg. Chem., 2016, 55, 2345–2354 CrossRef CAS PubMed
- F. Deng, W. Ding, Z. Peng, L. Li, X. Wang, X. Wan, L. Cheng and M. Li, J. Alloys Compd., 2015, 647, 1111–1120 CrossRef CAS
- W. Cai, C.-C. Chu, G. Liu and Y.-X. J. Wang, Small, 2015, 11, 4806–4822 CrossRef CAS PubMed
- M. Shi, C. Zeng, L. Wang, Z. Nie, Y. Zhao and S. Zhong, New J. Chem., 2015, 39, 2973–2979 RSC
- S. Tai, W. Zhang, J. Zhang, G. Luo, Y. Jia, M. Deng and Y. Ling, Microporous Mesoporous Mater., 2016, 220, 148–154 CrossRef CAS
- P. Wang, Y.-J. Zhang, J. Qin, Y. Chen and Y. Zhao, J. Mol. Struct., 2015, 1083, 95–100 CrossRef CAS
- B. Li, H.-M. Wen, Y. Cui, G. Qian and B. Chen, Prog. Polym. Sci., 2015, 48, 40–84 CrossRef CAS
- B. Liu, Y. Huang, X. Zhu, Y. Hao, Y. Ding, W. Wei, Q. Wang, P. Qu and M. Xu, Anal. Chim. Acta, 2016, 912, 139–145 CrossRef CAS PubMed
- N. H. Ryuhei Nishiyabu, T. Cho, K. Watanabe, T. Yasunaga, A. Endo, K. Kaneko, T. Niidome, M. Murata, C. Adachi, Y. Katayama, M. Hashizume and N. Kimizuka, J. Am. Chem. Soc., 2009, 131, 2151–2158 CrossRef PubMed
- H. Tan, L. Zhang, C. Ma, Y. Song, F. Xu, S. Chen and L. Wang, ACS Appl. Mater. Interfaces, 2013, 5, 11791–11796 CAS
- H. Tan, C. Ma, Y. Song, F. Xu, S. Chen and L. Wang, Biosens. Bioelectron., 2013, 50, 447–452 CrossRef CAS PubMed
- J. Scott, L. Klakamp and W. D. Horrocks, J. Inorg. Biochem., 1992, 46, 175–192 CrossRef
- V. L. Dorofeev, Pharm. Chem. J., 2004, 39, 45–49 Search PubMed
- P. Huang, F. Wu and L. Mao, Anal. Chem., 2015, 87, 6834–6841 CrossRef CAS PubMed
Footnote |
| † Electronic supplementary information (ESI) available. See DOI: 10.1039/c6ra20357d |
| This journal is © The Royal Society of Chemistry 2016 |