Influence of CuO morphology on the enhanced catalytic degradation of methylene blue and methyl orange†
Pangkita Dekaa,
Anil Hazarikab,
Ramesh C. Dekaa and
Pankaj Bharali*a
aDepartment of Chemical Sciences, Tezpur University, Napaam 784 028, India. E-mail: pankajb@tezu.ernet.in; Fax: +91-3712-267006; Fax: +91-3712-267005; Tel: +91-3712-275064
bSophisticated Analytical Instrumentation Centre (SAIC), Tezpur University, Napaam 784 028, India
First published on 21st September 2016
Abstract
In this work, CuO nanostructures of different morphologies were synthesized via a precursor mediated, two step hydrothermal method. The as obtained CuO nanostructures were systematically characterized by X-ray powder diffraction, Fourier transform infra-red spectroscopy, scanning electron microscopy, transmission electron microscopy, micro-Raman spectroscopy, Brunauer–Emmett–Teller N2 adsorption–desorption analysis and UV-visible spectroscopy. The results reveal that the CuO nanostructures are monoclinic, with definite morphologies, and they were employed for the catalytic degradation of cationic and anionic dyes in the presence of H2O2. The CuO nanostructures exhibit different efficiencies and rates towards the degradation reactions by the changing of the morphologies. Moreover, the effects of catalyst dosage and reaction temperature were also addressed in dye degradation reactions. The results imply that the increasing temperature led to higher reaction rates and efficacy. The kinetic data reveals that the process of degradation of the dyes was modeled by the pseudo-first-order kinetics involving adsorption and redox reaction. All the thermodynamic parameters, including activation energy (Ea), enthalpy (ΔH#), entropy (ΔS#) and free energy (ΔG#) of activation were calculated for the oxidation reaction. The generation of reactive ·OH from the homolytic cleavage of H2O2 was activated by the Cu2+ ions. The nanostructures also show good recyclability and high stability, up to the fifth cycle of the degradation reaction. Further, the degradation of dyes was confirmed by the FTIR analysis.
1. Introduction
Synthesis of nanostructured metal oxides with controlled morphology and texture have stimulated significant interest, due to their distinct physicochemical properties.1–15 Numerous investigations have been carried out to study their diverse properties, such as optical, electrical, sensing and catalytic. They are particularly used as catalysts in the chemical and petrochemical industries in the control of environmental pollution, and also as sorbents to remove hazardous oxides of sulfur, nitrogen and also the carbon species generated by the combustion of fossil-derived fuels. Moreover, metal oxides find enormous applications in many diverse fields that include the sensing of various toxic gases, as anode materials for electrochemical cells, as piezoelectric devices, etc.16–21Copper oxide (CuO), is a p-type semiconductor with an unconventional band structure, having a narrow band gap of Eg = 1.2 eV. It has potential applications in heterogeneous catalysis, sensing, superconductors, lithium ion electrode materials, and so on.21–31 Nowadays, the synthesis of nanostructured CuO has also received significant attention, and various methods to synthesize CuO nanocrystals have been reported. Wang et al. reported the synthesis of twinned-hemisphere-like CuO nanostructures via a simple, hydrophilic, polymer-assisted hydrothermal route.32 Yang et al. synthesized 3D flower- and 2D branching, sheet-like, nanostructured CuO, via a microwave-assisted hydrothermal method.17 Lu et al. reported the synthesis of graphene-like CuO nanofilms, via a two step electrochemical route.5 Gilbertson et al. reported the synthesis of CuO nanosheets via a simple surfactant-assisted coprecipitation route.33 Joya et al. reported the synthesis of nanoscale leaf-shaped CuO, via the anodization of a chemically etched copper substrate.34 Moreover, we have recently reported the synthesis of a CuO nanostructure, using urea as a base, via a template free hydrothermal method.35
The degradation of refractory organic pollutants has received much attention in recent times, due to their harmful effects on the environment and human health. In particular, industrial dyestuffs are among the major and most common water pollutants.2,36,37 Dyes have complex aromatic structures and as a result, they are very stable and difficult to degrade.2 If not treated properly they will induce health hazards and environmental pollution.38 Therefore, the removal of dyes from industrial effluents has been a major concern in wastewater treatments. Advanced oxidation processes (AOPs) are mainly concerned with the creation of hydroxyl radicals (·OH) that are utilized for the oxidation of refractory organic pollutants into CO2, H2O and some less-toxic small inorganic molecules.39,40 AOPs mostly include ozonation, homogeneous and heterogeneous Fenton's chemistry, photocatalytic oxidation etc., which have been successfully employed for the removal or degradation of refractory pollutants.38 Among them, ozonation is a prevailing technology, but the partial solubility and the short lifespan of ozone lead to high energy consumption; the whole process may be quite expensive, if hydroxyl radicals have to be generated photochemically.39 Homogeneous Fenton oxidation involves less exploitation of hydrogen peroxide, separation and recovery of the iron species, which cause additional costs. Heterogeneous Fenton oxidation with high efficiency and minimum secondary pollution in providing energy is considered as a newer area of research.
Herein, we report a two-step strategy for synthesizing CuO nanostructures via copper basic chloride precursors, using NaOH to see the effect of base on the morphology of the nanostructures. First, the micro-sized precursors assembled by sheet-like and rectangle-like blocks were synthesized. The subsequent sintering of the precursors in an air atmosphere produced CuO nanostructures. Compared to earlier reports the present route for synthesizing CuO nanostructures is environmentally friendly, low-cost, rapid and simple. As such, the synthetic process satisfies the requirements of saving energy and providing environmental protection. Further, the as-synthesized CuO nanostructures are employed for the catalytic degradation of organic water pollutants in the presence of H2O2. Since AOPs are mainly based in the generation of ·OH radicals, it is necessary to add oxidant that can easily generate ·OH radicals in the presence of a CuO catalyst system. Hydrogen peroxide (H2O2) is the simplest oxidant that can easily generate ·OH radicals on self-decomposition over CuO catalyst by forming the Cu2+/Cu+ couple. Thus, CuO nanostructures have been taken as remarkable candidates for wastewater treatment in practical applications.
2. Experimental section
2.1 Materials
Copper chloride dihydrate (CuCl2·2H2O), sodium hydroxide (NaOH) and H2O2 (30 wt%) were supplied by Merck, India. Methylene blue (MB) and methyl orange (MO) were obtained from Rankem Chemicals, India. All the above chemicals were of analytical grade and were used without any further purification. Also, all the experiments were conducted with distilled water.2.2 Synthesis of the CuO nanostructures
Typically, 0.68192 g of copper chloride dihydrate (CuCl2·2H2O) and 1.6 g of NaOH were dissolved separately in 40 mL of distilled water to form homogeneous solutions; the molar ratio of the salt and base was kept as 0.1![[thin space (1/6-em)]](https://www.rsc.org/images/entities/char_2009.gif) :
:![[thin space (1/6-em)]](https://www.rsc.org/images/entities/char_2009.gif) 1. The NaOH solution was then added dropwise to the CuCl2·2H2O solution with constant stirring and the whole mixture was transferred to a 150 mL Teflon-lined stainless steel autoclave, which was sealed, and heated at 120 °C for 6 h. The autoclave was allowed to cool to room temperature naturally. The as-formed precipitate, namely the basic copper chloride precursor, was separated by centrifugation, washed with distilled water and ethanol several times, and dried in an oven at 80 °C for 12 h. The as obtained precursor was further calcined in air at 400 °C for 4 h and the CuO nanostructure was obtained. The collected sample was labeled S-0.1.
1. The NaOH solution was then added dropwise to the CuCl2·2H2O solution with constant stirring and the whole mixture was transferred to a 150 mL Teflon-lined stainless steel autoclave, which was sealed, and heated at 120 °C for 6 h. The autoclave was allowed to cool to room temperature naturally. The as-formed precipitate, namely the basic copper chloride precursor, was separated by centrifugation, washed with distilled water and ethanol several times, and dried in an oven at 80 °C for 12 h. The as obtained precursor was further calcined in air at 400 °C for 4 h and the CuO nanostructure was obtained. The collected sample was labeled S-0.1.
In another synthesis, 6.8192 g of copper chloride dihydrate (CuCl2·2H2O) and 0.16 g of NaOH were separately dissolved in 40 mL of distilled water to form homogeneous solutions. The molar ratio of the salt and base was kept as 1![[thin space (1/6-em)]](https://www.rsc.org/images/entities/char_2009.gif) :
:![[thin space (1/6-em)]](https://www.rsc.org/images/entities/char_2009.gif) 0.1. A similar procedure to the previous one was followed. The final CuO nanostructure was obtained and labeled as S-1.
0.1. A similar procedure to the previous one was followed. The final CuO nanostructure was obtained and labeled as S-1.
2.3 Characterization
The X-ray diffraction (XRD) patterns were recorded using a nickel-filtered CuKα (0.15418 nm) radiation source on a Rigaku instrument. Infra-red spectra were obtained, using a FTIR spectrophotometer (Nicolet Impact I-410). The TGA curves were obtained on a Thermal Analyzer (TGA-50, Shimadzu) instrument. The samples were heated from ambient temperature to 700 °C under N2 flow. Scanning electron microscopy (SEM) analyses were done using a scanning electron microscope (JEOL, JSM 6390 LV) with accelerating voltage of 15 kV. Energy dispersive X-ray analyses (EDX) were carried out on an instrument (Oxford) attached to the scanning electron microscope. Transmission electron microscopic (TEM) investigations were carried out on a FEI-Tecnai (G2 F20S-TWIN) instrument operating at an accelerating voltage of 200 kV, equipped with a slow-scan CCD camera. Measurements were performed by pelletizing the samples with KBr in the mid-infrared region. The UV-visible diffuse reflectance spectra were measured by employing a UV-visible spectrophotometer, Shimadzu Corporation (UV-2450). Raman spectra were recorded using a laser micro-Raman system (make: Horiba Jobin Yvon, model: LabRam HR) at room temperature at 488 nm excitation wavelength. The surface areas were determined by the Brunauer–Emmett–Teller (BET) method, measured by N2 physisorption using a Quantachrome Instrument (Model: NOVA 1000e). The pore size and pore volume were determined following the Barrett–Joyner–Halenda (BJH) method, on the same instrument. The UV-visible absorption spectra were measured on a UV-visible spectrophotometer, Shimadzu Corporation (UV-2550).2.4 Catalytic experiments
Two different organic dye pollutants, namely, methyl orange (MO) and methylene blue (MB) were chosen to investigate the catalytic activity of CuO nanostructures. To a 10 mL aqueous solution of dye (5 mg L−1) was added 1 mL of H2O2 (30 wt%). Immediately, the preferred amount of catalyst was added and as the reaction proceeded, the color of the solution faded. The entire mixture was stirred during the reaction period. The supernatant was then transferred to a quartz cuvette for UV-visible spectral measurement. After the spectrum was measured, the solution was transferred back to the previous reaction vessel while stirring. The process was repeated and UV-visible spectra were recorded consecutively, to check the progress of the reaction. Blank experiments were also conducted to confirm that the reactions did not proceed with catalyst in the absence of H2O2, or without catalyst in the presence of H2O2. The influence of the catalyst amount, effect of reaction temperature and reusability of the representative sample were investigated. To test the reusability, five consecutive cycles of catalytic oxidation were carried out with a fixed amount of catalyst. In the consecutive cycles, the catalyst was recovered by centrifugation from the previous reaction mixture and was washed at least 3 times with distilled water. Further, the recovered catalyst was employed against the fresh reaction mixture, as described previously.3. Results and discussion
3.1 Structural characterization of CuO nanostructures
To investigate the morphologies of the as-synthesized CuO precursors SEM analyses were performed. As shown in Fig. 1a and b, the precursor of S-0.1 is composed of sheet-like building blocks (Fig. 1a). On careful observation, it can be seen that the surfaces of the sheet-like structures are smooth and compact without porous features (Fig. 1b). The size of the sheet-like structure is ca. 2 μm, and is very thin (Fig. 1b). On the other hand, the precursor of S-1, as shown in Fig. 1c and d, is composed of rectangle-like blocks. The surfaces of these rectangle-like structures are also smooth and compact, without porous features (Fig. 1d). The breadth of the rectangle-like structure is ca. 2–3 μm, whereas the length is 5–8 μm (Fig. 1d). The phase structures of the as synthesized precursors were analyzed by X-ray diffraction studies. As presented in Fig. 1e, the diffraction peaks could be indexed to the rhombohedral phase of Cu2(OH)3Cl (JCPDS no. 87-0679), revealing that Cu2(OH)3Cl was obtained by the hydrothermal treatment of CuCl2·2H2O and NaOH. A basic chloride salt can normally be taken as a precursor material, predominantly for the synthesis of metal oxides, without altering the morphology under thermal treatment.41–43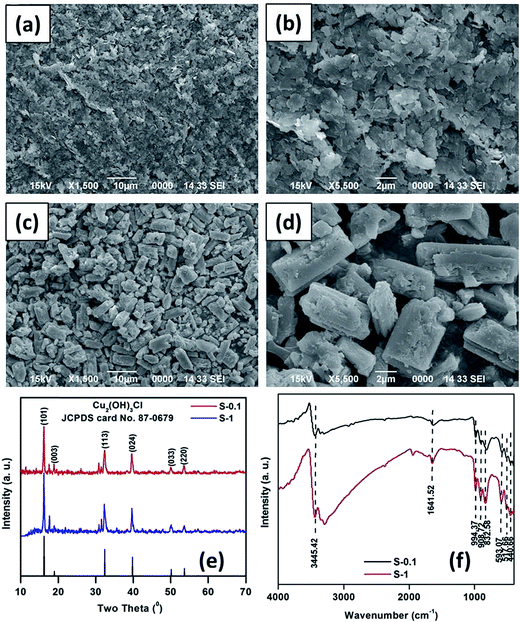 | ||
| Fig. 1 SEM images (a and b) and (c and d), XRD patterns (e) and FTIR spectra (f) of as synthesized precursors of CuO samples S-0.1 and S-1, respectively. | ||
FTIR analyses of the as-synthesized Cu2(OH)3Cl precursors were also performed. The bands below 700 cm−1 are due to Cu–O bond vibration, while the other three bands correspond to Cu–O–H vibration modes with relatively small H-bond vibrations (H⋯Cl effect). The strong peaks at around 3500 cm−1 are assigned to the stretching vibration of the –OH group of molecular water and of hydrogen-bound O–H groups, noting that the peak at 1620–1640 cm−1 is due to the bending mode of water molecules.
To determine a suitable temperature for calcination, the decomposition behavior of the Cu2(OH)3Cl precursors in air was studied using thermogravimetric analysis (TGA). The TG curves are presented in the ESI (Fig. S1†). In the curves, only one weight loss step at 250–400 °C is found and that can be attributed to the decomposition of Cu2(OH)3Cl precursors, which release HCl and water, leaving CuO nanostructures. The TG analysis reveals that the decomposition of Cu2(OH)3Cl occurs in a single-step, as presented in eqn (1).
| Cu2(OH)3Cl → 2CuO + HCl + H2O | (1) |
From eqn (1), the expected weight loss is 25.47%, which is in good agreement with the TG experimental results (i.e., >22%). The TG analyses indicate that the precursors were completely decomposed above 370 °C by the formation of CuO. Accordingly, we employed 400 °C as the calcination temperature for complete transformation of the Cu2(OH)3Cl precursors into CuO. After the thermal treatment in air atmosphere at 400 °C for 4 h, products were obtained. The X-ray diffraction patterns (Fig. 2a) show that the products are in the monoclinic phase of CuO, with lattice constants a = 4.683 Å, b = 3.473 Å, and c = 5.122 Å (JCPDS no. 89-2530). The peaks at 32.2, 35.2, 38.5, 48.7, 52.6, 58.5, 61.4, 66.0, and 68.1° were assigned to the (110), (002)/(−111), (111), (−202), (020), (202), (−113), (−311), and (−221) lattice planes of monoclinic CuO, respectively. The higher crystallinity was confirmed by the high intensity diffraction peaks of the samples. No characteristic diffraction peaks for the precursor was detected, indicating that the Cu2(OH)3Cl precursors were completely transformed into CuO.
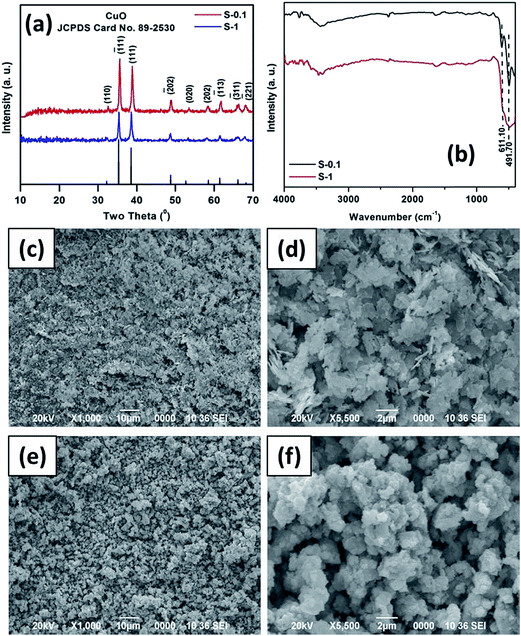 | ||
| Fig. 2 XRD patterns (a), FTIR spectra (b) and SEM images (c and d) and (e and f) of CuO samples, S-0.1 and S-1, respectively. | ||
The FTIR analysis of the CuO nanostructures (Fig. 2b) revealed two distinct peaks at 491.7 and 611.1 cm−1, due to the vibrational modes of the Cu–O bond. These again indicate the formation of the CuO nanostructure.44 The CuO was also assessed by energy dispersive X-ray spectroscopy (EDS), which confirmed the presence of Cu and O, devoid of any other metal and impurities in the oxide samples. The corresponding elemental mappings, along with the electron images are presented in the ESI (Fig. S2 and S3†). Elemental mapping shows that copper and oxygen are homogeneously dispersed all over the nanostructures.
The SEM analyses investigated the morphology of the CuO products. Fig. 2c and d represent the SEM images of the S-0.1 CuO sample. It can be seen from the figures that the premorphology is unchanged, consisting of plenty of sheet-like building blocks. The width and thickness of the sheet-like CuO building blocks are slightly reduced, compared to the precursor, indicating that the precursor shrank in the process of sintering. Notably, this may have been due to the release of HCl and H2O. Fig. 2e and f show the SEM images of the S-1 CuO sample. The morphology is damaged to some extent because of the creation of small pores on the precursor surface, which may be due to the release of HCl and H2O during the thermal treatment process. From the overall observation, it was seen that the morphology of the precursors and oxides were greatly altered by simply altering the base and the molar ratio of the salt and base during synthesis. Due to different morphologies, the samples were expected to exhibit diverse catalytic activity, but the reasons for the modified morphologies are not yet clear.
The obtained CuO products were also characterized by TEM analysis. Fig. 3a and b show the TEM images of S-0.1, suggesting that the sheet-like structures mainly consist of almost dumbbell like units. The particle size distribution of the product is presented in Fig. 3c. From the figure, it can be observed that the average diameter of the basic unit is about 40 ± 4.9 nm. The selected area electron diffraction (SAED) measurements of the S-0.1 CuO sample (Fig. 3d) show that the nanostructure is highly crystalline in nature with two significant rings. These two rings can be attributed to the (−111) and (111) lattice planes of CuO.
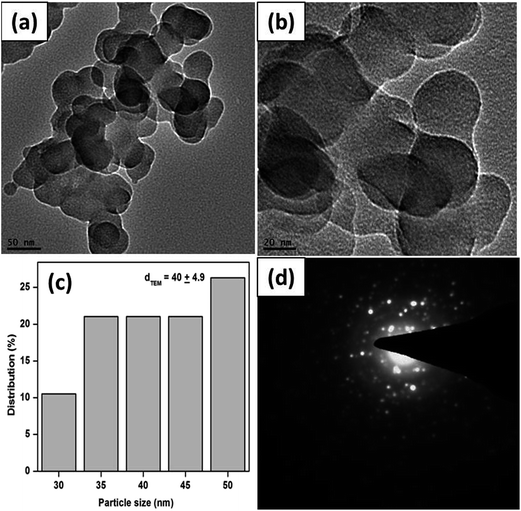 | ||
| Fig. 3 TEM images (a and b), corresponding particle size distributions (c) and SAED pattern (d) of the as obtained CuO sample, S-0.1. | ||
Fig. 4a and b show the TEM images of S-1, suggesting that the CuO structure consists of polycrystalline units of different morphologies. The crystals are irregular in shape and the average diameter of the crystals is about 25 ± 4.9 nm (Fig. 4c). The SAED measurement of small portion of the S-1 CuO sample is presented in Fig. 4d, which shows that the crystals possess two major rings. Again, these two rings can be attributed to the (−111) and (111) reflections of the CuO.
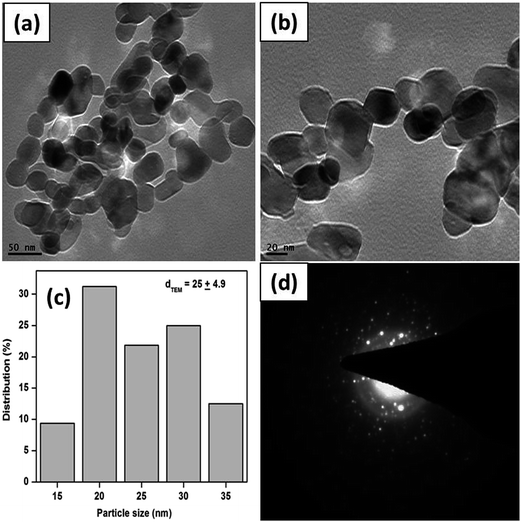 | ||
| Fig. 4 TEM images (a and b), corresponding particle size distributions (c) and SAED pattern (d) of the as obtained CuO sample, S-1. | ||
Moreover, the as synthesized CuO nanostructures were characterized by Raman and UV-visible diffuse reflectance spectroscopy to determine their optical and agglomeration behaviors. Fig. 5a represents the Raman spectra of the synthesized nanostructures. It is evident from Fig. 5a that CuO exhibits three Raman bands, corresponding to Ag and Bg modes. Table 1 lists the position and full-width at half maximum (FWHM) of the Raman peaks of the CuO nanostructures.
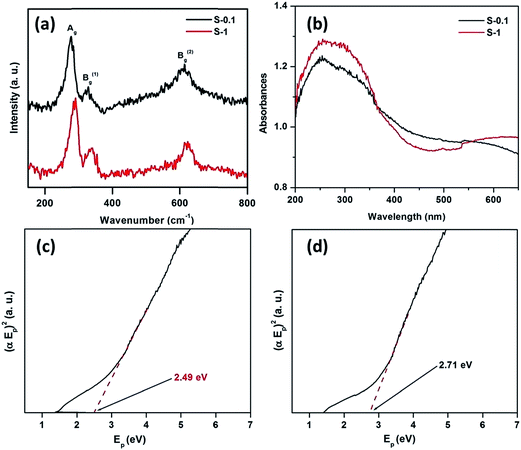 | ||
| Fig. 5 Micro-Raman (a) and UV-Visible diffuse reflectance spectra (b), plot of (αEp)2 vs. Ep, extrapolating the value of Ep at α = 0 for CuO nanostructures S-0.1 (c), and S-1 (d). | ||
| Samples | Ag (cm−1) | B1g (cm−1) | B2g (cm−1) | |||
|---|---|---|---|---|---|---|
| Position | FWHM | Position | FWHM | Position | FWHM | |
| S-0.1 | 273 | 32 | 328 | 30 | 614 | 42 |
| S-1 | 289 | 27 | 336 | 22 | 624 | 33 |
Generally, CuO belongs to the C62h space group, with a total of nine zone-center optical phonon modes having the symmetries 4Au + 5Bu + Ag + 2Bg, but only three modes are Raman active, i.e. Ag + 2Bg. Observing the vibrational spectra of CuO powder45,46 and single crystals,47 the peak near 280 cm−1 could be assigned to the Ag, whereas, the peaks near 330 and 615 cm−1 could be assigned to the Bg modes. These peaks are very close to the literature values that were reported earlier (288, 330 and 621 cm−1).45
The UV-Visible DRS plots are presented in Fig. 5b. We expected that the absorption edge would lie in the UV region because of the nanosize of the particles. In the UV region of the spectra one broad absorption band was observed, again confirming the nanosize of the particles. The optical energy band gaps of the synthesized CuO samples were calculated as reported earlier.35 Fig. 5c and d depict the plots of (αEp)2 vs. Ep, based on the direct transition. The value of Ep extrapolated at α = 0, provides the absorption edge energy corresponding to the band-gap. The band gaps of 2.49 and 2.71 eV were obtained for S-0.1 and S-1 CuO samples, respectively. The Eg found in both cases are quite high, compared to bulk CuO (1.2–1.3 eV), which may be due to the quantum confinement effect.
The textural properties of CuO nanostructures were assessed by nitrogen adsorption/desorption analysis. The nitrogen sorption isotherms of CuO nanostructures, along with the pore size distribution are presented in the ESI (Fig. S4†). The multi-molecular layer type adsorption typically fits well with the results, representing in a weak interaction between N2 and CuO. Physical parameters obtained by means of the N2 adsorption/desorption study of CuO nanostructures are summarized in Table 2.
| Sample | BET surface area (m2 g−1) | Pore volume (cm3 g−1) | Pore diameter (nm) |
|---|---|---|---|
| S-0.1 | 24.1 | 0.020 | 9 |
| S-1 | 12.2 | 0.014 | 6 |
Specific surface areas for all the samples were determined using the multipoint BET equation. Generally, a surface area of about 0.1 m2 g−1 is expected for a commercial CuO powder.48 However, in the present investigation, the obtained specific surface areas for the CuO samples are >10 m2 g−1, which is in good agreement with literature.28 Thus, it was confirmed that the particles are in the nanometric regime. The pore volume and pore diameter were determined by the Barrett–Joyner–Halenda (BJH) method, which reveals the mesoporosity of the samples.
3.2 Catalytic performances of CuO nanostructures
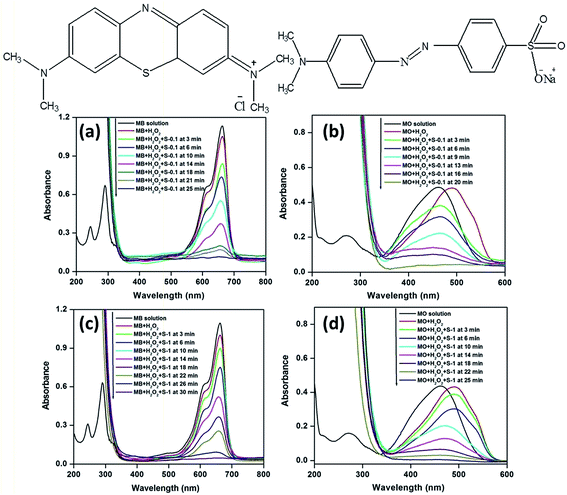
Methylene blue (MB)35,49–54 and methyl orange (MO),35,53–55 two typical industrial pollutants, were chosen as model dyes to examine the catalytic behaviors of the as synthesized CuO nanostructures. The oxidative degradation of the dyes was investigated under neutral conditions in the presence of H2O2 and the CuO as catalysts at three different temperatures. A series of experiments was performed at three different temperatures, viz., 25, 35 and 65 °C, to evaluate the catalytic properties of the CuO nanostructures. The UV-visible absorption spectra of the dye solutions and mixed solutions containing H2O2 and CuO nanostructures (such as MB + H2O2, MB + H2O2 + CuO, MO + H2O2, MO + H2O2 + CuO) as a function of reaction time (reaction temperature 65 °C) are shown in Fig. 6 along with chemical structures of MB (left top panel) and MO (right top panel), respectively.The spectra of MB show four absorption peaks centered at 246, 292, 614, and 664 nm, respectively (Fig. 6a and c), and similarly, MO exhibits two peaks at 246 and 462 nm (Fig. 6b and d). After the addition of H2O2 the absorption peaks at 246 nm (for MB and MO) and 292 nm (for MB only) are covered by the strong absorption of H2O2 in the range of 185–300 nm (Fig. 6).35 As CuO was added, the intensities of the peaks for MB at 614 and 664 nm and 462 nm for MO decreased rapidly. As the reaction proceeded, the characteristic absorptions of the MB at 664 nm and MO at 462 nm gradually weakened and were chosen for monitoring the catalytic process of the CuO nanostructures. Meanwhile, the intense color of the mixtures became less intense.
The rate of degradation of the dye molecules were calculated following the reported procedure.35 The degradation rate of MB and MO over CuO nanostructures under various experimental conditions at 65 °C are presented in Fig. 7. It indicates that the CuO nanostructures only slightly adsorbed MB (∼2 and 8% for S-1 and S-0.1 CuO, respectively) and MO (∼1 and 4% for S-1 and S-0.1 CuO, respectively) from the reaction solutions, up to 60 min. Only 9.9 and 7.8% of MB and MO, respectively, decomposed in the presence of H2O2 without catalyst up to 60 min. No obvious degradation was observed without H2O2 or CuO, even up to 60 min, which implies that the degradation of dye molecules is caused by H2O2-induced oxidation, catalyzed by CuO nanostructures. The corresponding time dependent UV-visible absorption spectra are presented in Fig. 6 and in the ESI (Fig. S5†), which show that the degradation of MB and MO was completed within 25 and 20 min over S-0.1 CuO, whereas 30 and 25 min were required for complete degradation over S-1 CuO as catalyst (Fig. 6 and 7). It is apparent that the catalytic activity of the S-0.1 CuO is much higher and faster than that of S-1 CuO, due to its higher surface area and porosity. Interestingly, MB undergoes degradation at a slower rate, compared to MO catalyzed by CuO. The complex chemical structure of MB compared to MO may increase the steric hindrance and complexity of the reaction. To test the generation of ·OH from the hemolytic cleavage of H2O2, terephthalic acid was chosen as the detector because it can trap ·OH and create fluorescence active 2-hydroxyterephthalic acid.53 The PL spectra indicate that the emission intensity of terephthalic acid solution decreases following the sequence of S-0.1 and S-1 CuO nanostructures, confirming the generation of more ·OH and subsequently, 2-hydroxyterephthalic acid by the S-0.1 CuO nanostructure (in the ESI (Fig. S6†)).
To confirm that the decrease in absorbance of MB and MO in the solutions is due to the catalytic effect, instead of adsorption by CuO nanostructures, EDS analyses were performed to determine the surface elements of the CuO nanostructures after reaction (in the ESI (Fig. S7†)). As shown in Fig. S7a–d,† the absence of sulfur or nitrogen on the surface of CuO indicates that no MB and MO were absorbed over CuO nanostructures. The ESI (Fig. S7†) displays the FTIR spectra of CuO nanostructures recovered after catalytic runs, along with virgin MB and MO. It is clear from the FTIR spectra that the characteristic peaks of MB and MO are absent over CuO after reaction. On the basis of the above experiments, it could be inferred that the degradation of MB and MO occurred in the presence of H2O2 over CuO nanostructures.
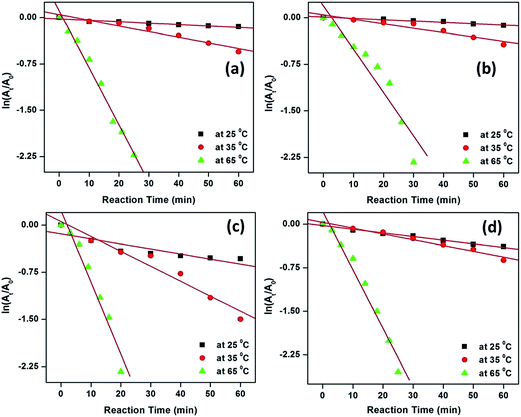
The degradation kinetics of MB and MO were investigated at three different reaction temperatures (viz., 25, 35 and 65 °C) for up to 60 min. To study the kinetics of the degradation reactions, the absorbances at 664 and 462 nm for MB and MO, respectively were measured as a function of time. The concentration of H2O2 was considered as constant during the experiments as it was in great excess. Hence, with respect to the concentration of the respective dyes, pseudo-first-order kinetics was applied; therefore, the rate constant was calculated via the following equations:
| dCt/dt = −kappCt or ln(Ct/C0) or ln(At/A0) = −kappt | (2) |
| Dye | Catalyst | Temperature (°C) | kapp (×10−2 min−1) | Ea (kJ mol−1) | ΔH# (kJ mol−1) | ΔS# (kJ mol−1 K−1) | ΔG# (kJ mol−1) |
|---|---|---|---|---|---|---|---|
| a Conditions: [dye] = 5 mg L−1, volume of dye solution = 10 mL, H2O2 = 1 mL and amount of catalyst = 3 mg. | |||||||
| MB | S-0.1 | 25 | 0.22 | 64.53 | 61.88 | −0.0826 | 86.49 |
| 35 | 0.91 | 87.32 | |||||
| 65 | 9.24 | 89.80 | |||||
| S-1 | 25 | 0.21 | 71.87 | 69.23 | −0.0629 | 87.97 | |
| 35 | 0.71 | 88.60 | |||||
| 65 | 6.99 | 90.49 | |||||
| MO | S-0.1 | 25 | 0.75 | 54.90 | 52.25 | −0.1088 | 84.67 |
| 35 | 2.27 | 85.76 | |||||
| 65 | 11.43 | 89.02 | |||||
| S-1 | 25 | 0.63 | 59.84 | 57.20 | −0.0962 | 85.87 | |
| 35 | 1.00 | 86.83 | |||||
| 65 | 10.09 | 89.72 | |||||
The activation parameters for the reactions were calculated from the rate constants at the above mentioned temperatures. The plots of ln![[thin space (1/6-em)]](https://www.rsc.org/images/entities/char_2009.gif) kapp and ln(kapp/T) versus 1/T (from eqn (3) & (4)), respectively, are shown in Fig. 9.
kapp and ln(kapp/T) versus 1/T (from eqn (3) & (4)), respectively, are shown in Fig. 9.
ln![[thin space (1/6-em)]](https://www.rsc.org/images/entities/char_2009.gif) kapp = ln kapp = ln![[thin space (1/6-em)]](https://www.rsc.org/images/entities/char_2009.gif) A − Ea/RT A − Ea/RT
| (3) |
 | (4) |
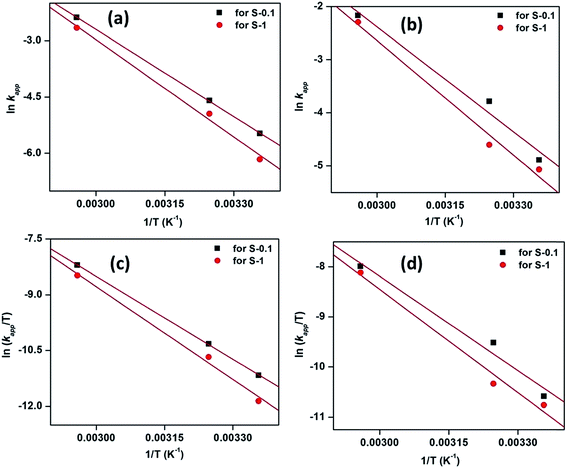 | ||
Fig. 9 Plots of ln![[thin space (1/6-em)]](https://www.rsc.org/images/entities/char_2009.gif) kapp and ln(kapp/T) versus 1/T for the degradation of MB (a and c) and MO (b and d) by H2O2-induced oxidation catalyzed by CuO nanostructures. kapp and ln(kapp/T) versus 1/T for the degradation of MB (a and c) and MO (b and d) by H2O2-induced oxidation catalyzed by CuO nanostructures. | ||
Activation energies, Ea, were determined from the slopes of the linear fitting of the plots ln![[thin space (1/6-em)]](https://www.rsc.org/images/entities/char_2009.gif) kapp versus 1/T.56,57 The enthalpy, ΔH# and entropy, ΔS# of activation were determined from the slopes and intercepts of the plots ln(kapp/T) versus 1/T, respectively.58 The free energies of activation, (ΔG#) were determined from eqn (5).
kapp versus 1/T.56,57 The enthalpy, ΔH# and entropy, ΔS# of activation were determined from the slopes and intercepts of the plots ln(kapp/T) versus 1/T, respectively.58 The free energies of activation, (ΔG#) were determined from eqn (5).
| ΔG# = ΔH# − TΔS# | (5) |
The values of the thermodynamic parameters obtained using these eqn (3)–(5) are presented in Table 3. From the Table, it is observed that the higher values of rate constant are associated with lower activation energy; i.e., enthalpy is greater for the slower reaction. Therefore, the results suggest that the reaction is controlled by the enthalpy of activation.59,60 Moreover, the positive value of ΔH# indicates the endothermic nature of the oxidation process.61
The effect of catalyst dosage on the degradation of dyes was investigated by employing 1, 3 and 6 mg of catalyst in the respective catalytic systems at 65 °C and is presented in Fig. 10. The corresponding time dependent UV-visible absorption spectra against the reaction time are presented in Fig. 6 and in the ESI (Fig. S10 and S11†). It is observed from Fig. 10 that the apparent rate constant (kapp) for both the dye degradations increases with the increasing catalyst dosage. Apparently, the dye degradations are completed at a faster rate as the dosages of catalysts are increased. As the amount of catalyst is increased, the catalytically active sites along with surface area for the catalyst also increases, therefore the reactions move faster.
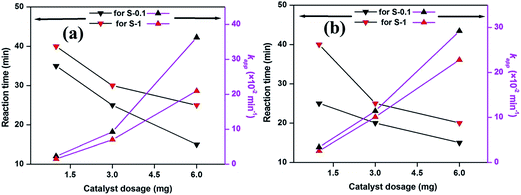 | ||
| Fig. 10 The effect of catalyst dosage on MB (a) and MO (b) degradation. Conditions: [dye] = 5 mg L−1, volume of dye solution = 10 mL, H2O2 = 1 mL and reaction temperature = 65 °C. | ||
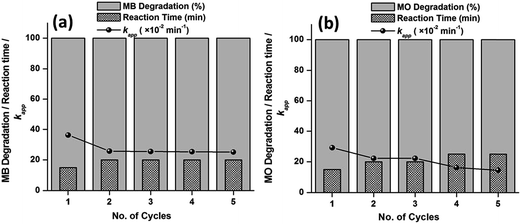
The catalysts show excellent activity for the respective dye (MB and MO) degradations; therefore, the reusability and stability of the catalysts were explored for their practical applications. The experiment was recycled five times using the best catalyst i.e., S-0.1 at 65 °C, with a dosage of 6 mg of catalyst for the respective dyes. For each individual run, the catalyst was collected with the help of centrifugation from the previous solution. The collected catalyst was washed with ethanol three times, dried at 80 °C in an oven and employed for the next run. As observed from Fig. 11, up to the fifth run, both the dyes were degraded completely within 60 min of reaction. However, a subsequent increase in time was observed as the number of cycle increased. Also, there was a meager decrease in the apparent rate constants (kapp) with the increasing number of cycles. A slight loss of catalyst in the course of the separation and collection process from the previous solution may be the reason behind the decrease in activity. The corresponding UV-visible absorption spectra against the reaction time of all the recycling experiments are presented in the ESI (Fig. S12 and S13†).
SEM and XRD analyses were performed on the catalyst before and after the fifth run and the results are presented in Fig. 12, where it is observed that the surface structure and morphology of the catalyst almost remain the same, confirming the high structural stability of the catalyst.
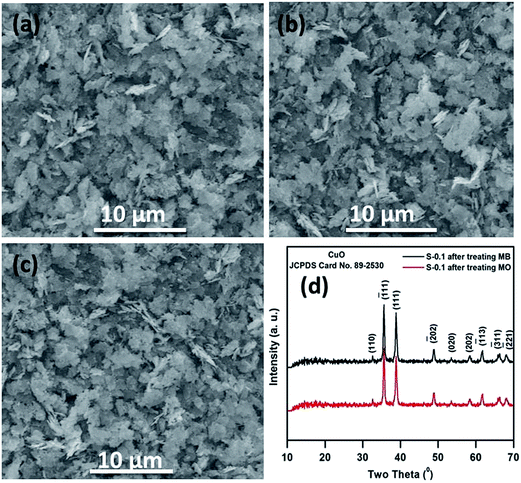 | ||
| Fig. 12 SEM images of the S-0.1 CuO nanostructure before (a) and after the fifth runs of catalytic degradation of MB (b) and MO (c); XRD patterns of S-0.1 CuO after the fifth catalytic run (d). | ||
There are several outstanding reports that are documented in the literature with different catalysts employed for the degradation of MB and MO.49–55 Recently, our group also reported the catalytic degradation of MB and MO in the presence of CuO nanostructures.35 However, the CuO nanostructures reported herein exhibit superior activity, compared to the previous one. The change in morphology and surface properties, including higher specific surface area, may be the cause of the enhanced activity. Table 4 highlights the degradation of MB and MO in the presence of different catalysts. The as synthesized CuO nanostructures show superior activity, compared to the several catalysts reported earlier. Moreover, the S-0.1 CuO nanostructure shows higher catalytic activity than the S-1 CuO nanostructure. This may be due to the high surface area/pore volume and low band gap energy associated with the S-0.1 CuO nanostructure. The present study indicates that the CuO nanostructures exhibit excellent activity for degradation of complex organic dyes with high stability and recyclability.
| Entry | Catalyst | Reaction temperature (°C) | H2O2 (mL) | Degradation (%) | Ref. | |
|---|---|---|---|---|---|---|
| MB (time in min) | MO (time in min) | |||||
| 1 | S-0.1 CuO nanostructure | 65 | 1 | 100 (25) | 100 (20) | Present study |
| 2 | S-1 CuO nanostructure | 65 | 1 | 100 (35) | 100 (30) | Present study |
| 3 | CuO nanostructure | 65 | 1 | 100 (40) | 100 (30) | 35 |
| 4 | Mn3O4-nanocrystal | 80 | 15 | 100 (180) | — | 49 |
| 5 | Porous Co3O4 nanorods-reduced graphene oxide | 80 | 10 | 97 (25) | — | 50 |
| 6 | Fe-species loaded MnO2-superstructure | 25 | 20 | 94.8 (120) | — | 51 |
| 7 | MnO2-superstructure | 30 | 10 | 61.3 (120) | — | 52 |
| 8 | Solid Fe3O4 | Ultrasonic treatment (40 kHz) | 1 | 100 (130) | 100 (50) | 53 |
| 9 | Fe/DWCNTs–MMO | 25 | 5 | 96 (360) | 93 (360) | 54 |
| 10 | CuO/CeO2 catalyst | Microwave (2450 MHz, 380 W) | 0.6 | — | 100 (7) | 55 |
3.3 Proposed mechanisms for the degradation of dye solutions
It has been established that the decomposition of H2O2 occurs over CuO catalysts, and confirmed that a favorable Cu+/Cu2+ couple is necessary for the decomposition.62 As the catalyst accepts an electron, the possible active site is Cu2+, to yield a ˙HO2 radical (eqn (6)), and if the electron is donated, the active site is Cu+, to yield a ·OH radical (eqn (7)).| Cu2+ + H2O2 + e− → Cu+ + ˙HO2 + H+ | (6) |
| Cu+ + H2O2 − e− → Cu2+ + ˙OH + OH− | (7) |
It is reported that the oxide surfaces are always covered with hydroxyl groups (acid and base) formed by the dissociative chemisorption of water molecules.63 As we know, a base hydroxyl group is protonated by releasing an OH− ion to become a positive site, CuOH2+ (eqn (8)),
| CuOH(b) + H2O ⇄ CuOH2+ + OH− | (8) |
| CuOH(a) ⇄ CuO− + H+ | (9) |
The FTIR spectra of the dye molecules and the degradation products are depicted in the ESI (Fig. S14†). The FTIR spectra of dye molecules present in the ESI (Fig. S14†) indicate several important absorption bands. The peak near 3500 cm−1 is associated with the O–H stretching vibration. The peaks near 2900 cm−1 and from 1650–1450 cm−1 represent the C–H and C![[double bond, length as m-dash]](https://www.rsc.org/images/entities/char_e001.gif) C stretching vibration of benzene rings. Again, the peaks near 1380 and 1300 cm−1 correspond to C
C stretching vibration of benzene rings. Again, the peaks near 1380 and 1300 cm−1 correspond to C![[double bond, length as m-dash]](https://www.rsc.org/images/entities/char_e001.gif) N and C–N stretching vibrations of aromatic amines. It can be seen that the peaks for benzene rings disappeared in the degradation products (in the ESI (Fig. S14b†)), indicating the rupture of the benzene rings. The bands at around 1200 and 1050 cm−1 (in the ESI (Fig. S14a†)) are attributed to sulfonate salts. These peaks are also displayed in Fig. S14b† (1200 and 1050 cm−1, with low intensity), confirming the presence of sulfonate salts in the resulting degraded products. A broad band centered at around 3500 cm−1 in the ESI (Fig. S14†) appeared, associated with the O–H stretching vibration. Peaks near 1650 cm−1 (in the ESI (Fig. S14†)) correspond to C
N and C–N stretching vibrations of aromatic amines. It can be seen that the peaks for benzene rings disappeared in the degradation products (in the ESI (Fig. S14b†)), indicating the rupture of the benzene rings. The bands at around 1200 and 1050 cm−1 (in the ESI (Fig. S14a†)) are attributed to sulfonate salts. These peaks are also displayed in Fig. S14b† (1200 and 1050 cm−1, with low intensity), confirming the presence of sulfonate salts in the resulting degraded products. A broad band centered at around 3500 cm−1 in the ESI (Fig. S14†) appeared, associated with the O–H stretching vibration. Peaks near 1650 cm−1 (in the ESI (Fig. S14†)) correspond to C![[double bond, length as m-dash]](https://www.rsc.org/images/entities/char_e001.gif) C stretching vibrations, confirming the presence of small unsaturated molecules in the degradation products.39 Finally, the FTIR analysis confirmed that the parent dye molecules were degraded into small-molecule compounds. However, further study of the degradation products is still under active process.
C stretching vibrations, confirming the presence of small unsaturated molecules in the degradation products.39 Finally, the FTIR analysis confirmed that the parent dye molecules were degraded into small-molecule compounds. However, further study of the degradation products is still under active process.
4. Conclusions
In conclusion, CuO nanostructures have been successfully synthesized via a route involving basic copper chloride precursor. The CuO was characterized using XRD, FTIR, SEM/EDX, TEM, micro-Raman spectroscopy, BET surface area analyses and UV-visible spectroscopy. The activities of the CuO nanostructures were investigated for the catalytic degradation of organic dyes in the presence of H2O2. The CuO nanostructures exhibited diverse activities, depending on their morphologies and surface properties. The sheet like nanostructure (i.e. S-0.1 CuO) shows higher catalytic activity, compared to the polycrystalline CuO nanostructure, as well as a few reported heterogeneous catalysts. The study on activation parameters reveals that the degradations are endothermic in nature on the CuO nanostructures, following pseudo first order kinetics. Further, the sheet-like CuO nanostructure showed good recyclability up to the fifth cycle of the degradation reactions, with high stability. Further work is under active progress for the complete understanding of the reaction mechanism.Acknowledgements
The authors thank Tezpur University, Council of Scientific and Industrial Research (CSIR No.: 01(2813)/14/EMR-II), New Delhi and Science and Engineering Research Board (SERB-DST No.: SB/FT/CS-048/2014), New Delhi for financial support. CIF, IIT Guwahati is also acknowledged for instrumental facilities.References
- Y. Shen, Z. Zhang and K. Xiao, RSC Adv., 2015, 5, 91846–91854 RSC.
- R. Rajesh, S. S. Iyer, J. Ezhilan, S. S. Kumar and R. Venkatesan, Spectrochim. Acta, Part A, 2016, 166, 49–55 CrossRef CAS PubMed.
- S. S. Lee, W. Li, C. Kim, M. Cho, J. G. Catalano, B. J. Lafferty, P. Decuzzi and J. D. Fortner, Environ. Sci.: Nano, 2015, 2, 500–508 RSC.
- Z. Xue, M. Li, H. Rao, B. Yin, X. Zhou, X. Liu and X. Lu, RSC Adv., 2016, 6, 12829–12836 RSC.
- Y. Lu, X. Liu, K. Qiu, J. Cheng, W. Wang, H. Yan, C. Tang, J.-K. Kim and Y. Luo, ACS Appl. Mater. Interfaces, 2015, 7, 9682–9690 CAS.
- S. K. Shinde, D. P. Dubal, G. S. Ghodake and V. J. Fulari, RSC Adv., 2015, 5, 4443–4447 RSC.
- S. Yang, S. Zhang, H. Wang, H. Yu, Y. Fang and F. Peng, RSC Adv., 2014, 4, 43024–43028 RSC.
- P. A. Neale, Å. K. Jämting, E. O'Malley, J. Herrmann and B. I. Escher, Environ. Sci.: Nano, 2015, 2, 86–93 RSC.
- S. Agarwal, I. Tyagi, V. K. Gupta, A. R. Bagheri, M. Ghaedi, A. Asfaram, S. Hajati and A. A. Bazrafshan, J. Environ. Chem. Eng., 2016, 4, 1769–1779 CrossRef CAS.
- S. L. Clavijo-Chaparro, A. Hernández-Gordillo, R. Camposeco-Solis and V. Rodríguez-González, J. Mol. Catal. A: Chem., 2016, 423, 143–150 CrossRef CAS.
- N. Xu, D. K. Sarkar, X. G. Chen, H. Zhang and W. Tong, RSC Adv., 2016, 6, 35466–35478 RSC.
- K. Kobl, S. Thomas, Y. Zimmermann, K. Parkhomenko and A. C. Roger, Catal. Today, 2016, 270, 31–42 CrossRef CAS.
- H. Siddiqui, M. S. Qureshi and F. Z. Haque, International Journal for Light and Electron Optics, 2016, 127, 4726–4730 CrossRef CAS.
- R. K. Upadhyay, S. Pan, A. Barman, J. A. McLaughlin and S. S. Roy, Ceram. Int., 2016, 42, 12119–12128 CrossRef CAS.
- P. R. Bagdi, R. S. Basha, P. K. Baruah and A. T. Khan, RSC Adv., 2014, 4, 10652–10659 RSC.
- C. Fang, L. Shi, H. Hu, J. Zhang and D. Zhang, RSC Adv., 2015, 5, 11013–11022 RSC.
- C. Yang, F. Xiao, J. Wang and X. Su, Sens. Actuators, B, 2015, 207, 177–185 CrossRef CAS.
- R. Sivasubramanian and P. Biji, Mater. Sci. Eng., B, 2016, 210, 10–18 CrossRef CAS.
- J. Han, X. Zong, X. Zhou and C. Li, RSC Adv., 2015, 5, 10790–10794 RSC.
- W. Wu, Z. H. Huang and T. T. Lim, Appl. Catal., A, 2014, 480, 58–78 CrossRef CAS.
- Y. Zhong, T. Shi, Z. Liu, S. Cheng, Y. Huang, X. Tao, G. Liao and Z. Tang, Sens. Actuators, B, 2016, 236, 326–333 CrossRef CAS.
- A. Wongrakpanich, I. A. Mudunkotuwa, S. M. Geary, A. S. Morris, K. A. Mapuskar, D. R. Spitz, V. H. Grassian and A. K. Salem, Environ. Sci.: Nano, 2016, 3, 365–374 RSC.
- B. Andrews, S. Almahdali, K. James, S. Ly and K. N. Crowder, Polyhedron, 2016, 114, 360–369 CrossRef CAS.
- J. Kneer, J. Wöllenstein and S. Palzer, Sens. Actuators, B, 2016, 229, 57–62 CrossRef CAS.
- F. Saadati, N. Khani, M. Rahmani and F. Piri, Catal. Commun., 2016, 79, 26–30 CrossRef CAS.
- B. Dutta, E. Kar, N. Bose and S. Mukherjee, RSC Adv., 2015, 5, 105422–105434 RSC.
- M. T. S. Chani, K. S. Karimov, S. B. Khan and A. M. Asiri, Sens. Actuators, A, 2016, 246, 58–65 CrossRef CAS.
- J. Wang, Y. Liu, S. Wang, X. Guo and Y. Liu, J. Mater. Chem. A, 2014, 2, 1224–1229 CAS.
- M. Jing, Z. Ding, H. Hou, Y. Zhang, G. Zou, S. Li and X. Ji, Chem. Phys. Lett., 2016, 653, 30–34 CrossRef CAS.
- S. Shinde, H. Dhaygude, D. Y. Kim, G. Ghodake, P. Bhagwat, P. Dandge and V. Fulari, J. Ind. Eng. Chem., 2016, 36, 116–120 CrossRef CAS.
- G. Zhu, H. Xu, Y. Xiao, Y. Liu, A. Yuan and X. Shen, ACS Appl. Mater. Interfaces, 2012, 4, 744–751 CAS.
- C. Wang, Y. Ye, B. Tao and B. Geng, CrystEngComm, 2012, 14, 3677–3683 RSC.
- L. M. Gilbertson, E. M. Albalghiti, Z. S. Fishman, F. Perreault, C. Corredor, J. D. Posner, M. Elimelech, L. D. Pfefferle and J. B. Zimmerman, Environ. Sci. Technol., 2016, 50, 3975–3984 CrossRef CAS PubMed.
- K. S. Joya and H. J. M. Groot, ACS Catal., 2016, 6, 1768–1771 CrossRef CAS.
- P. Deka, R. C. Deka and P. Bharali, New J. Chem., 2016, 40, 348–357 RSC.
- A. Banazadeh, H. Salimi, M. Khaleghi and S. S. Haghighi, J. Environ. Chem. Eng., 2016, 4, 2178–2186 CrossRef CAS.
- M. Horáková, Š. Klementová, P. Kříž, S. K. Balakrishna, P. Špatenka, O. Golovko, P. Hájková and P. Exnar, Surf. Coat. Technol., 2014, 241, 154–158 CrossRef.
- M. J. Ndolomingo and R. Meijboom, Appl. Catal., A, 2015, 506, 33–43 CrossRef CAS.
- Z. Yang, Y. Yang, X. Zhu, G. Chen and W. Zhang, Ind. Eng. Chem. Res., 2014, 53, 9608–9615 CrossRef CAS.
- M. Cheng, G. Zeng, D. Huang, C. Lai, P. Xu, C. Zhang and Y. Liu, Chem. Eng. J., 2016, 284, 582–598 CrossRef CAS.
- X. B. Wang, W. P. Cai, Y. X. Lin and G. Z. Wang, J. Mater. Chem., 2010, 20, 8582–8590 RSC.
- S. Ding, T. Zhu, J. S. Chen, Z. Wang, C. Yuan and X. W. Lou, J. Mater. Chem., 2011, 21, 6602–6606 RSC.
- X. W. Xie, Y. Li, Z. Q. Liu, M. Haruta and W. J. Shen, Nature, 2009, 458, 746–749 CrossRef CAS PubMed.
- G. Kliche and Z. V. Popovic, Phys. Rev. B: Condens. Matter Mater. Phys., 1990, 42, 10060–10066 CrossRef CAS.
- M. Basu, A. K. Sinha, M. Pradhan, S. Sarkar, A. Pal and T. Pal, Chem. Commun., 2010, 46, 8785–8787 RSC.
- T. Yu, X. Zhao, Z. X. Shen, Y. H. Wu and W. H. Su, J. Cryst. Growth, 2004, 268, 590–595 CrossRef CAS.
- J. F. Xu, W. Ji, Z. X. Shen, W. S. Li, S. H. Tang, X. R. Ye, D. Z. Jia and X. Q. Xin, J. Raman Spectrosc., 1999, 30, 413–415 CrossRef CAS.
- Y. Liu, G. Zhu, C. Bao, A. Yuan and X. Shen, Chin. J. Chem., 2014, 32, 151–156 CrossRef CAS.
- P. Zhang, Y. Zhan, B. Cai, C. Hao, J. Wang, C. Liu, Z. Meng, Z. Yin and Q. Chen, Nano Res., 2010, 3, 235–243 CrossRef CAS.
- Z. Zhang, J. Hao, W. Yang, B. Lu, X. Ke, B. Zhang and J. Tang, ACS Appl. Mater. Interfaces, 2013, 5, 3809–3815 CAS.
- R. Huang, Y. Liu, Z. Chen, D. Pan, Z. Li, M. Wu, C.-H. Shek, C. M. L. Wu and J. K. L. Lai, ACS Appl. Mater. Interfaces, 2015, 7, 3949–3959 CAS.
- Y. Liu, Z. Chen, C. H. Shek, C. M. L. Wu and J. K. L. Lai, ACS Appl. Mater. Interfaces, 2014, 6, 9776–9784 CAS.
- X. Zhang, M. Lin, X. Lin, C. Zhang, H. Wei, H. Zhang and B. Yang, ACS Appl. Mater. Interfaces, 2014, 6, 450–458 CAS.
- W. Li, T. Sun and F. Li, Ind. Eng. Chem. Res., 2014, 53, 18095–18103 CrossRef CAS.
- D. Xu, F. Cheng, Q. Lu and P. Dai, Ind. Eng. Chem. Res., 2014, 53, 2625–2632 CrossRef CAS.
- Q. Wang, S. Tian and P. Ning, Ind. Eng. Chem. Res., 2014, 53, 643–649 CrossRef CAS.
- L. Xu and J. Wang, Environ. Sci. Technol., 2012, 46, 10145–10153 CrossRef CAS PubMed.
- A. H. Gemeay, Dyes Pigm., 2002, 54, 201–212 CrossRef CAS.
- R. C. Wilkins, The study of the kinetics and mechanism of reactions of transition metal complexes, Allyn and Bacon, Boston, MA, 1974 Search PubMed.
- M. A. Salem and A. H. Gemeay, Monatshefte fur Chemie, 2000, 31, 117–129 CrossRef.
- P. K. Boruah, D. J. Borah, J. Handique, P. Sharma, P. Sengupta and M. R. Das, J. Environ. Chem. Eng., 2015, 3, 1974–1985 CrossRef CAS.
- J. Bandara, J. Kiwi, C. Pulgarin, P. Peringer, G. M. Pajonk, A. Elaloui and P. Albers, Environ. Sci. Technol., 1996, 30, 1261–1267 CrossRef CAS.
- H. Tamura, T. Oda, M. Nagayama and R. Furuichi, J. Electrochem. Soc., 1989, 136, 2782–2786 CrossRef CAS.
- C. Bauer, P. Jacques and A. Kalt, Chem. Phys. Lett., 1999, 307, 397–406 CrossRef CAS.
- S. Horikoshi, A. Saitou and H. Hidaka, Environ. Sci. Technol., 2003, 37, 5813–5822 CrossRef CAS PubMed.
Footnote |
| † Electronic supplementary information (ESI) available: Characterization related to TG, EDS elemental maps, N2 adsorption/desorption isotherm and pore size distribution of CuO; time dependent UV-visible absorption spectra of reaction solutions at various temperatures over CuO catalyzed degradation of MB and MO; PL spectra of terephthalic acid solution in the presence of CuO nanostructures; FTIR spectra of parent dyes and degraded products. See DOI: 10.1039/c6ra20173c |
| This journal is © The Royal Society of Chemistry 2016 |

